Introduction
There is compelling evidence that bilinguals activate information from both of their languages, even when reading in a single language (for recent reviews, see Jared, Reference Jared, Pollatsek and Treiman2015; Lauro & Schwartz, Reference Lauro and Schwartz2017; Sunderman & Fancher, Reference Sunderman, Fancher and Schwieter2013; Titone, Whitford, Lijewska & Itzhak, Reference Titone, Whitford, Lijewska, Itzhak and Schwieter2016; Whitford, Pivneva & Titone, Reference Whitford, Pivneva, Titone, Heredia, Altarriba and Cieślicka2016). Much of this evidence comes from studies using words that share orthographic and/or phonological forms across languages, such as cognates (which also share meaning, e.g., table in English and French) and interlingual homographs (e.g., pain, which means ‘bread’ in French). Fewer studies have used words that share phonology across languages, such as interlingual homophones (e.g., mow in English and mot in French, which means ‘word’). This research has found that a written word in one language activates phonological representations from both languages (e.g., Dijkstra, Grainger & van Heuven, Reference Dijkstra, Grainger and van Heuven1999; Haigh & Jared, Reference Haigh and Jared2007; Jared & Kroll, Reference Jared and Kroll2001). Phonological representations, in turn, can activate their associated semantic representations, even in the non-target language (e.g., Friesen & Jared, Reference Friesen and Jared2012).
However, one limitation of the extant research on cross-language phonological activation in bilinguals is that it has exclusively focused on words presented in isolation through the use of response-based tasks (e.g., Friesen & Jared, Reference Friesen and Jared2012). Importantly, such tasks may probe decision-making processes that are not involved in natural reading (Kuperman, Drieghe, Keuleers & Brysbaert, Reference Kuperman, Drieghe, Keuleers and Brysbaert2013). Here, we used eye movement recordings, which provide a direct and temporally-sensitive measure of the cognitive processes implicated in word recognition to examine whether shared phonology between languages activates cross-language meaning. Furthermore, we also examined whether individual differences variables, such as language proficiency and executive control, modulate the magnitude of phonologically-mediated cross-language meaning activation, given that no published studies have examined the role of individual differences in cross-language activation of phonology.
We first briefly review the literature on phonological activation of word meanings using within-language (intralingual) homophones among monolinguals; this work motivated the methodological choices adopted in the current study. We then review the bilingual literature on phonological activation of word meanings using between-language (interlingual) homophones. Finally, we present an empirical study on whether shared phonology activates cross-language meaning and whether individual differences impact the nature of this activation.
Within-language meaning activation by phonology
Intralingual homophones are word pairs that share a pronunciation, but not meaning within a language (e.g., hear and here). If word meanings are activated just from orthographic representations, then only the meaning of a presented homophone should be activated. However, if word meanings are activated through phonology, then reading a homophone will result in the activation of both homophones’ meanings. Category verification tasks, wherein readers decide if target words are members of a category, reveal processing differences between homophones and their control words. On critical trials, the target word (e.g., rows, which sounds like rose) is not a member of the category (e.g., FLOWER); however, because its homophone mate is, readers are less accurate and slower to reject homophone foils as category members than spelling control words (e.g., robs; Friesen, Oh & Bialystok, Reference Friesen, Oh and Bialystok2016; Jared & Seidenberg, Reference Jared and Seidenberg1991; van Orden, Reference van Orden1987; van Orden, Johnston & Hale, Reference van Orden, Johnston and Hale1988; Ziegler, Benraïss & Besson, Reference Ziegler, Benraïss and Besson1999), indicating that the meanings of both homophones are activated and compete for selection. However, it is unclear from this response-based task whether phonological activation of meaning occurs during initial word recognition or during subsequent decision making processes.
The homophone error paradigm enables the investigation of both early- and late-stage processing. Here, homophones and their control words are placed into sentence contexts (e.g., The delegates flew here/hear/heat from Canada) to examine how phonology activates meaning during reading. Both eye-tracking (e.g., Daneman & Reingold, Reference Daneman and Reingold1993, Daneman, Reingold & Davidson, Reference Daneman, Reingold and Davidson1995; Feng, Miller, Shu & Zhang, Reference Feng, Miller, Shu and Zhang2001; Jared, Levy & Rayner, Reference Jared, Levy and Rayner1999; Jared & O'Donnell, Reference Jared and O'Donnell2017; Rayner, Pollatsek & Binder, Reference Rayner, Pollatsek and Binder1998) and event-related potential (ERP) data (e.g., Newman & Connolly, Reference Newman and Connolly2004; Newman, Jared & Haigh, Reference Newman, Jared and Haigh2012; Niznikiewicz & Squires, Reference Niznikiewicz and Squires1996; Savill, Lindell, Booth, West & Thierry, Reference Savill, Lindell, Booth, West and Thierry2011) examine initial word processing by comparing early-stage fixation durations or ERP components, respectively.
Evidence that phonology contributes to the activation of word meanings comes from observations of shorter fixation durations or modulated ERP components (i.e., N200, N400) on homophones relative to spelling control words (e.g., hear vs. heat). However, the size of the homophone effect is typically larger when homophone pairs are visually similar, when both homophones are low-frequency words, and with less skilled readers (Jared et al., Reference Jared, Levy and Rayner1999; Jared & Seidenberg, Reference Jared and Seidenberg1991). For the latter two, such effects are likely a consequence of weaker connection strengths or lower baseline activation levels arising from less word exposure (Dijkstra & van Heuven, Reference Dijkstra and van Heuven2002; Gollan, Montoya, Cera & Sandoval, Reference Gollan, Montoya, Cera and Sandoval2008; Harm & Seidenberg, Reference Harm and Seidenberg2004). That is, less exposure to words does not enable the connection strengths between a word's orthography and semantics to be firmly established and, consequently, the phonological pathway contributes more to word recognition than it does for high-frequency words. Furthermore, homophone errors are harder to detect when the context is highly constraining, indicating that representations associated with the correct homophone may be pre-activated from top-down expectations (e.g., Jared & Seidenberg, Reference Jared and Seidenberg1991; Rayner et al., Reference Rayner, Pollatsek and Binder1998; Savill et al., Reference Savill, Lindell, Booth, West and Thierry2011). Low constraint contexts thus provide clearer evidence about whether phonology computed from orthographic representations activates word meanings.
Cross-language meaning activation by phonology
Researchers have used interlingual homophones to investigate whether printed words in one language activate phonological representations in another language. Lexical decision, naming, and ERP studies have shown that processing of interlingual homophones differs from that of spelling control words, particularly when participants perform the task in their second-language (L2) (e.g., Carrasco-Ortiz, Midgley & Frenck-Mestre, Reference Carrasco-Ortiz, Midgley and Frenck-Mestre2012; Dijkstra et al., Reference Dijkstra, Grainger and van Heuven1999; Friesen, Jared & Haigh, Reference Friesen, Jared and Haigh2014; Haigh & Jared, Reference Haigh and Jared2007; Lemhöfer & Dijkstra, Reference Lemhöfer and Dijkstra2004). Furthermore, masked primes in one language facilitate responses to phonologically similar target words in another language (e.g., Ando, Matsuki, Sheridan & Jared, Reference Ando, Matsuki, Sheridan and Jared2015; Ando, Jared, Nakayama & Hino, Reference Ando, Jared, Nakayama and Hino2014; Brysbaert, van Dyck & van de Poel; Reference Brysbaert, Van Dyck and Van de Poel1999; Duyck, Diependaele, Drieghe & Brysbaert, Reference Duyck, Diependaele, Drieghe and Brysbaert2004; van Wijnendaele & Brysbaert, Reference van Wijnendaele and Brysbaert2002). These studies provide strong evidence for cross-language activation of phonology.
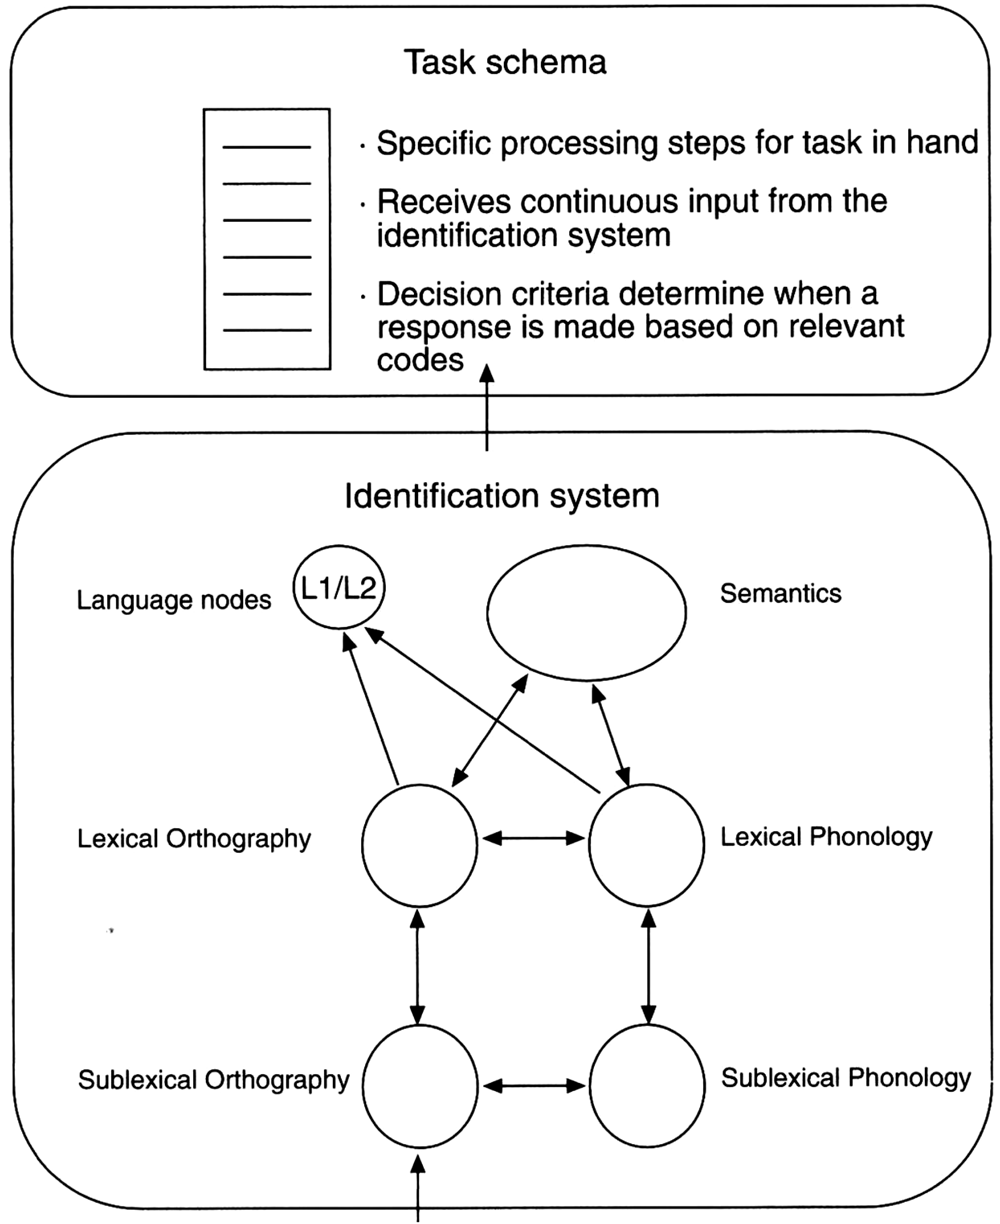
The Bilingual Interactive Activation Plus model (BIA+; Dijsktra & van Heuven, Reference Dijkstra and van Heuven2002) can explain these phonological effects. Here, sublexical orthographic units activate their associated sublexical phonological units. The sublexical units then activate word-level representations in a language non-selective manner. Both lexical orthography and lexical phonology reciprocally activate each other and activate semantic knowledge; they also activate language nodes that identify the input's language membership. Because the model postulates no top-down suppression of the non-target language from these nodes, representations from both languages compete for selection and inhibit each other until one option is selected. For example, the French word mot activates its phonology which is shared with mow. Activation of this shared phonology then spreads to competing meanings (word and cut) before one is selected.
Although the BIA+ postulates that phonological representations activate their corresponding semantic representations in the non-target language, few studies have investigated whether non-target language phonological representations are sufficiently activated such that they send a noticeable amount of activation to their corresponding semantic representation. In a priming study by Duyck (Reference Duyck2005), Dutch–English bilinguals made faster lexical decisions on English words that were preceded by Dutch pseudohomophones of the English words’ meaning (e.g, tauw is not a Dutch word, but is pronounced like the Dutch word touw ‘rope’ where ‘rope’ is the English target word). Friesen and Jared (Reference Friesen and Jared2012) found that highly proficient bilinguals were slower and less accurate in deciding that interlingual homophones (shoe where chou means ‘cabbage’ in French) were not category members (e.g., vegetable) than spelling controls (e.g., silk) in both their first-language (L1) and L2. Degani, Prior, and Hajajra (Reference Degani, Prior and Hajajra2017) further demonstrated that cross-language semantic activation occurs when languages do not share a script. In a semantic relatedness judgment task, Arabic–Hebrew bilinguals saw Hebrew primes with the same pronunciation as an Arabic word (e.g., /sus/, ‘horse’ in Hebrew but ‘chick’ in Arabic), which were followed by Hebrew targets related to the Arabic meaning of the prime (e.g., the Hebrew word egg). Bilinguals were less accurate in judging these interlingual homophone primes and targets as unrelated in Hebrew compared to control pairs.
In these studies, phonological representations were sufficiently activated to activate their cross-language semantic representations. However, there are several limitations associated with these response-based tasks. First, in category verification, category names may provide top-down activation of meanings associated with exemplars and, thus, may overestimate the activation due to phonological representations in the non-target language. Second, it is unclear how to disentangle initial word recognition processes from selection processes in response-based tasks.
To date, only one study has examined how bilinguals process interlingual homophones embedded in sentence contexts to explore language non-selective semantic access. FitzPatrick and Indefrey (Reference FitzPatrick and Indefrey2014) had Dutch–English bilinguals listen to sentences that were either biased toward the target language (e.g., My cat is my favorite pet (pet sounds like hat in Dutch), biased toward the non-target language (e.g., The policeman wore a pet), or fully incongruent (e.g., Jeremy drove a pet) while ERPs were recorded. In both L1 and L2, the fully incongruent condition generated N400s (i.e., large negative deflections in neural waveforms elicited by semantic anomalies ~400 ms post-stimulus onset), whereas the target language bias did not generate a N400. The non-target language biased condition generated an attenuated N400 in both languages, suggesting that both meanings of the homophones were active to some extent during sentence processing. However, as an auditory task, the word's phonology is presented and not generated from the orthography. Moreover, the sentences were highly constrained which may have generated top-down expectations.
The present study
In the current study, we used a bilingual homophone error paradigm with eye-tracking to probe both early- and late-stage phonological activation of cross-language meaning during visual word recognition. Sentences were written in English and on critical trials, the English homophone was presented or was replaced by either the French homophone or a French spelling control (e.g., Tony was too lazy to mow/mot (‘word’) /mois (‘month’) the grass on Sunday). When the French homophone (e.g., mot) was presented, the reader could make better sense of the sentence if they activated the English meaning of the shared phonology (e.g., ‘cut’). This technique is akin to using English pseudohomophones and legal non-words to explore how spelling-sound correspondences activate meaning (e.g., Jared et al., Reference Jared, Levy and Rayner1999). The difference is that French homophones have meanings, and French experience may modulate these effects (as described below). Investigating how readers respond to errors is a useful tool in psycholinguistics to examine processing dynamics in visual word recognition.
To maximize the likelihood that the homophone effect was due to shared phonology and not top-down prediction from prior context, low constraint contexts were used. Although the sentence did not bias the reader towards the English word, overall it was the most plausible of the three meanings (e.g., Tony was too lazy to : ‘cut’, ‘word’,‘month’). Shorter fixations were expected on French homophones than on French control words even in these low constraint sentences because the English homophone meaning always fit. Additionally, both high- and low-frequency French homophones were employed. All English members of the interlingual homophone pairs were low-frequency words. If they had been high-frequency English words, they would have had familiar spellings making it difficult to observe any influence of phonology. In monolingual studies, homophone effects are more often observed on low-frequency words; individuals have less experience pairing orthography to meaning and, thus, likely engage the phonological pathway (Harm & Seidenberg, Reference Harm and Seidenberg2004; Jared & Seidenberg, Reference Jared and Seidenberg1991). However, in a bilingual scenario the impact of word frequency should interact with language experience in both languages.
To investigate how individual differences impact the dynamics of phonologically-mediated meaning activation, we measured language knowledge and executive control ability. A concern in bilingualism research is how monolingual and bilingual individuals are assigned to groups, as a function of their language background. Thus, we adopted a continuous, individual differences approach (Titone, Pivena, Sheikh, Webb & Whitford, Reference Titone, Pivneva, Sheikh, Webb and Whitford2015; Whitford & Luk, Reference Whitford, Luk, Sekerina, Valian and Spradlinin press). Of note, our sample included individuals who did not consider themselves bilingual, although they did receive French instruction (as required by the Canadian education system). Thus, they were functionally monolingual, but could have used their knowledge of French spelling-sound correspondences to decode words in French. Since language non-selectivity effects are typically more clearly observed in highly proficient bilinguals, we expected that our core homophone effects might be weak when all participants were included in the analyses. However, we further expected that the individual differences in French proficiency would modulate the magnitude of homophone effects.
Eye-tracking studies using cognates and interlingual homographs embedded in sentences have provided evidence that lexical activation in bilinguals is initially language non-selective (e.g., Lemhöfer, Huestegge & Mulder, Reference Lemhöfer, Huestegge and Mulder2018; Libben & Titone, Reference Libben and Titone2009; Pivneva, Mercier & Titone, Reference Pivneva, Mercier and Titone2014; Schwartz & Kroll, Reference Schwartz and Kroll2006; Titone, Libben, Mercier, Whitford & Pivneva, Reference Titone, Libben, Mercier, Whitford and Pivneva2011; van Assche, Drieghe, Duyck, Welvaert & Hartsuiker, Reference van Assche, Drieghe, Duyck, Welvaert and Hartsuiker2011; but see Hoversten & Traxler, Reference Hoversten and Traxler2016). Particularly relevant here, several studies found that individual differences can modulate cross-language activation during sentence processing (Lemhöfer et al., Reference Lemhöfer, Huestegge and Mulder2018; Pivneva et al., Reference Pivneva, Mercier and Titone2014; Titone et al., Reference Titone, Libben, Mercier, Whitford and Pivneva2011). For example, Titone and colleagues (Reference Titone, Libben, Mercier, Whitford and Pivneva2011) found that readers with an earlier L2 age of acquisition (AoA) exhibited greater language non-selectivity when reading sentences in their L1. Likewise, Pivneva and colleagues (Reference Pivneva, Mercier and Titone2014) reported a reduced L1 impact on L2 sentence reading with greater L2 proficiency. The authors also found that greater domain-general executive control ability related to reduced interlingual homograph interference when reading low constraint L2 sentences. Extending this work, the current study examined whether individual differences in language proficiency and executive control modulate the extent to which cross-language meaning is activated through shared phonology.
Homophone effects should vary as a function of language proficiency. For a homophone effect to occur, readers must activate French spelling-sound correspondences (e.g., /mot/) and the corresponding English meaning of the shared phonology (e.g., mow ‘to cut’). Accordingly, greater French decoding skills and English word knowledge should produce larger homophone effects. Homophone effects should also vary due to word frequency. For less proficient French users, homophone effects should be larger for high-frequency than for low-frequency words. High-frequency words benefit from more absolute exposure (although still low exposure) and, thus, the shared phonological representations may activate the English meanings. In contast, low-frequency words have received less absolute exposure and, thus, may activate shared phonological representations too weakly. For skilled users of French, homophone effects should be present for both high- and low-frequency words because they will have encountered both sufficiently often to develop strong connections between orthographic and phonological representations. Thus, we expected a larger impact of individual differences in language proficiency on low- versus high-frequency words.
Our predictions for executive control vary for early- versus late-stage reading. Pivneva and colleagues (Reference Pivneva, Mercier and Titone2014) found that bilinguals with better executive control experienced less interlingual homograph interference, which, like our interlingual homophones, have different meanings across languages. Here, if participants inhibit their knowledge of French spelling-sound correspondences when reading the English sentences, then the difference between French interlingual homophones and control words should be reduced because neither French word will activate a corresponding English word. Similarly, if participants inhibit English lexical representations when encountering a French word, the English meaning of the homophone should be suppressed. In both cases, better executive control ability should result in smaller interlingual homophone effects. However, executive control might influence late-stage processing, as participants integrate the relevant meaning into the sentence. Here, better executive control may be associated with larger homophone effects. When anomalous words are encountered, readers may differ in the attention they deploy to resolve the error. For spelling control words, the information needed to resolve the anomaly may be less readily available than for homophones. Individuals with better executive control (i.e., ability to attend to relevant information) may engage in greater effort to resolve their understanding than individuals with weaker executive control ability.
Method
Participants
Ninety-six adults (25 males, 71 females; Age: 21.07 ± 4.39 years) participated for course credit or monetary compensation. Fifty-six participants were recruited from the University of Western Ontario (London, Ontario, Canada) and 40 from McGill University (Montréal, Québec, Canada). Participants were English speakers with varying degrees of French proficiency, ranging from minimal (e.g., required French courses) to native (e.g., acquired French as an L1). The study was approved by both institutions’ research ethics boards.
Materials and procedures
Sentence-reading task
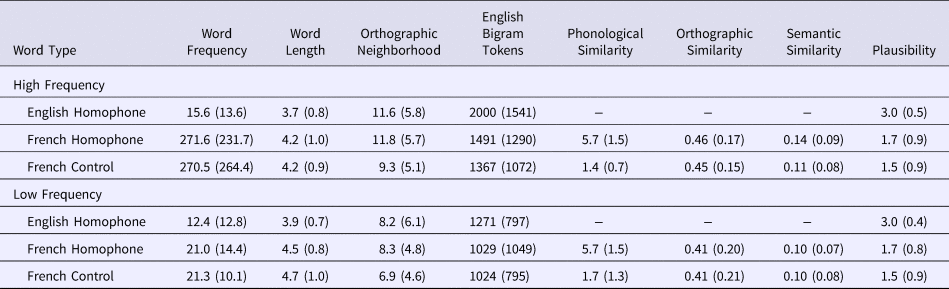
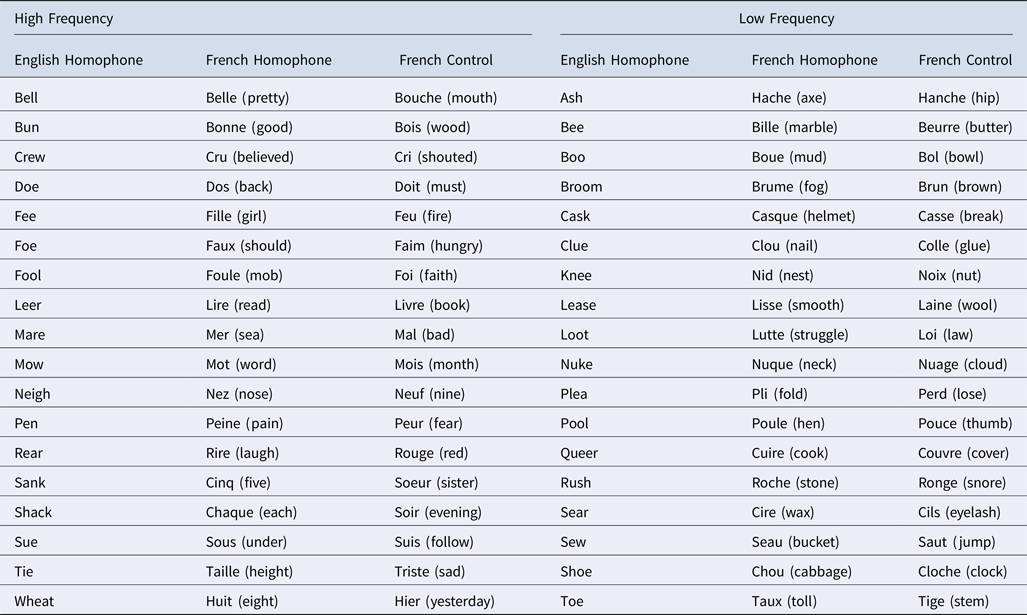
Thirty-six English–French interlingual homophone pairs were selected (e.g., mow and mot). Since there is no dictionary of Canadian French pronunciations (different from European French pronunciations), homophone selection was based on the authors’ judgment of reasonable phonological similarity. Since vowels differ subtly between English and French, these homophone pairs are “close” rather than identical homophones. They have been used in prior work (Friesen & Jared, Reference Friesen and Jared2012; Friesen et al., Reference Friesen, Jared and Haigh2014; Haigh & Jared, Reference Haigh and Jared2007). Using the Celex Corpus (Baayen, Piepenbrock & van Rijn, Reference Baayen, Piepenbrock and van Rijn1993), the English homophones were low word form frequency (0–40 occurrences per million); using the Lexique database (New, Pallier, Brysbaert & Ferrand, Reference New, Pallier, Brysbaert and Ferrand2004), the French homophones were either low (2–52 occurrences per million) or high (76 -1061 occurrences per million) word form frequency. French control words were selected for the French homophones. To confirm that the French homophones were more phonologically similar to the English homophones than the French control words were, 13 proficient English–French bilinguals rated the phonological similarity of the English homophone to both the French homophone and the control word using a seven-point scale (1 = not at all to 7 = identical). An item analysis revealed that English homophones were rated as significantly more similar to French homophones than to the French control words, (t(35) = 24.61, p < .001). Otherwise, French homophones and their controls were matched for written word form frequency (parts per million), word length, English orthographic neighborhood size (Coltheart's N), English bigram frequency (N-Watch; Davis, Reference Davis2005), orthographic similarity to their English homophone using van Orden's (Reference van Orden1987) orthographic similarity metric, and semantic similarity to their English homophone (e.g., mow-mot (word) /mow-mois(month)) (all ps > .20). For the latter, Latent Semantic Analysis values (Landauer, Foltz & Laham, Reference Landauer, Foltz and Laham1998) were obtained from www.lsa.colorado.edu. See Table 1 for word characteristics. Since English homophones and French homophones are yoked, word characteristics cannot be matched. Data from the English homophones are provided as a reference, but were not included in the analyses.
Word Characteristics (Means and Standard Deviations)

For each of the 36 word triplets (i.e., English homophone, French homophone, and French control word), three English sentence frames were created (108 critical sentences total). Sentences were written such that the English homophone was a more plausible continuation of the sentence than either French word, but the sentence stem was not highly constrained (i.e., predictable). Plausibility judgments were collected from 26 native English speakers with little knowledge of French. Sentence stems were followed by a critical word, and raters indicated how plausible the critical word was as a continuation of the sentence using a five-point scale (0 = not at all, 1 = a little, 2 = moderately, 3 = plausible, 4 = very plausible). The French critical words were translated into English (e.g., Tony was too lazy to mow/word/month). Table 1 demonstrates that the English homophones were rated as significantly more plausible than the translations of the French words (ps < .001). Moreover, there were no significant differences between the translations of French homophones and their control words on the plausibility ratings (p > .34). To confirm that the target words were also not predictable from the sentence stems and, thus, were unlikely to be generated from top-down information, six additional native English speakers were given the sentence stems minus the critical words and asked to insert a single word (e.g., Tony was too lazy to ____). Of the 108 sentences, the target word was chosen by a single participant in five cases. For two sentences, three participants inserted the target word; otherwise, no English homophones were inserted (i.e., overall the correct English word was selected 1.7% of the time).
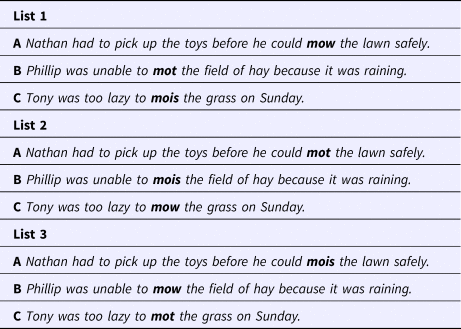
Participants saw each target word in one of the three sentence frames that were written for each triplet, and no sentence frame was seen twice. Three lists were created such that each word was presented in each sentence frame across the entire experiment (see Table 2 for an example). Each participant saw only one list. An additional 132 English filler sentences were created to decrease the percentage of sentences with a French word to 30% across the experiment (15% homophones, 15% French control words). Of all the words presented in the sentences, participants encountered a French word only 2.6% of the time. The 240 trials were divided into three blocks of 80 trials (36 critical trials, 44 filler trials), which were counterbalanced. Each member of a stimulus triplet was presented in a different block to minimize repetition effects. A yes-no comprehension question appeared after each critical sentence and after 50% of filler sentences to ensure that participants were reading for meaning (e.g., Is the grass on Tony's lawn long?). Participants were instructed to read the sentences silently and naturally for comprehension.
Example of a Stimuli Triplet

An EyeLink 1000 desktop-mounted system was used to collect the eye movement data (right eye only) at a 1 kHz sampling rate (SR-Research, Ontario, Canada). Sentences were presented on a 21-inch CRT monitor, positioned 60 cm from participants’ eyes. Calibration was performed at the beginning of each block (and as needed) using a five-point cross formation. Sentences were presented as single lines of text in black 10-point Courier New font against a light gray background.
Language experience questionnaire (LEQ)
Self-report measures of English and French language experience were obtained through a LEQ. Participants reported their age of language acquisition (i.e., AoA), which language they knew best, the proportion of time they used each language, and in what contexts. Participants rated their current level of fluency in listening, speaking, reading, and writing in both languages on a ten-point scale (1 = none to 10 = native-like).
Test of word reading efficiency (TOWRE)
The TOWRE is a timed measure of English reading fluency (Torgesen, Wagner & Rashotte, Reference Torgesen, Wagner and Rashotte1999). Participants read aloud as many items on a card as possible in 45 seconds. Credit for a correct word was given if the word was read fluently and each phoneme was present. High scores reflect greater word reading fluency. Four versions were administered: English word reading (max score: 104); French word reading (max score: 104); English non-word reading (max score: 63); and French non-word reading (max score: 63). French versions were not standardized, and were originally developed and used in prior work (Jared, Cormier, Levy & Wade-Woolley, Reference Jared, Cormier, Levy and Wade-Woolley2011). The TOWRE measures were selected because individual differences in the ability to rapidly extract phonology from print should underlie differences in the activation of shared phonological representations.
Semantic judgment task
The semantic judgment task assessed word knowledge in both English and French. One hundred nouns, 50 of which represented living things and 50 of which represented non-living things (i.e., objects) were selected in both English and French. Different items were selected in each language. The two categories were matched on written word form frequency and word length within each language and across languages (ps > .25). Words were presented one at a time on a computer screen; participants decided whether they were living or an object as quickly and accurately as possible with a button press. Response keys were counterbalanced. For accuracy, d-prime scores were calculated. Higher scores reflect greater word knowledge. The semantic judgment task was selected because it measures knowledge of word meaning and individual differences in semantic knowledge should impact whether the cross-language meaning is activated by shared phonology. If readers do not have knowledge of the meaning associated with the shared phonology in English, then cross-language meaning activation is unlikely.
Simon arrows task
Participants performed a non-linguistic Simon arrow task. Arrows appeared on the left, right, or center of the screen; participants indicated the direction of the arrows and ignored their location. Congruency was manipulated by having the stimulus location and its response location match or mismatch. There were 40 trials of each type, and participants responded as quickly and accurately as possible with a button press. To calculate the magnitude of the Simon effects, participants’ mean reaction time (RT) and number of errors in the congruent condition were subtracted from corresponding value in the incongruent condition and then divided by the congruent condition value. Larger values reflect larger Simon Effects and, thus, poorer executive control. The Simon Arrows task was selected because it assesses cognitive inhibition – the ability to ignore irrelevant information (location) and attend to relevant information (direction) (Martin-Rhee & Bialystok, Reference Martin-Rhee and Bialystok2008). Since readers must both select the relevant meaning of the shared phonology and attend to relevant information to understand the sentences, differences in this executive control ability may modulate how readers process critical stimuli.
Procedure
The sentence-reading task was administered first, followed by the Simon arrow task, TOWREs, semantic judgment tasks, and LEQ. The TOWREs and semantic judgment tasks were counterbalanced for language across participants. The study was part of a larger test battery in a research collaboration between the University of Western Ontario and McGill University.
Results
Individual differences measures
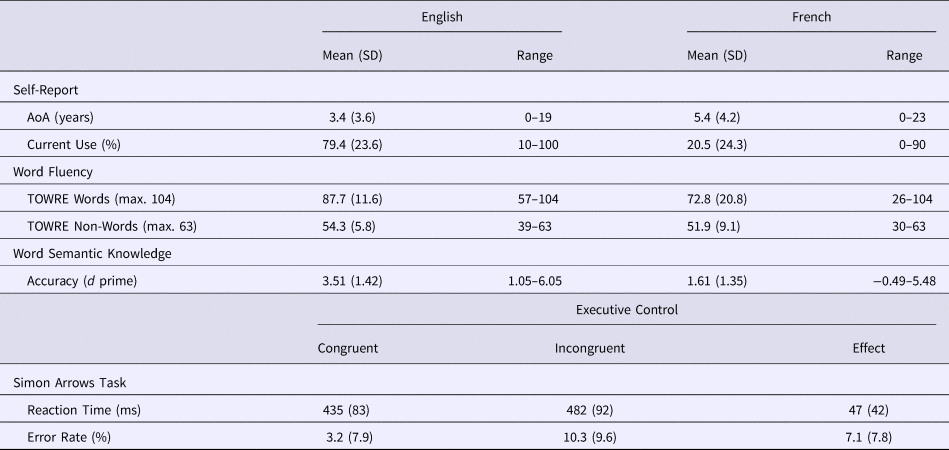
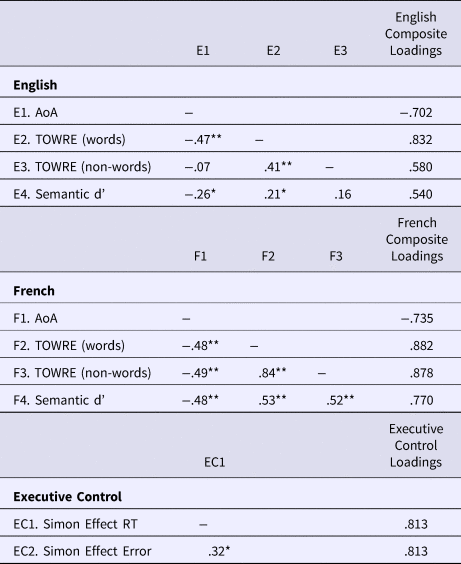
Table 3 presents the means, standard deviations, and ranges for background measures (LEQ, TOWREs, Semantic Judgement, Simon Arrows). Table 4 presents correlations between the: (1) English proficiency measures, (2) French proficiency measures, and (3) RT and Error Simon Effects. To simplify our individual differences analyses, we calculated composite scores for French Proficiency, English Proficiency, and Executive Control using separate Principle Component Analyses (PCAs). We first confirmed that English, French, and Executive Control measures loaded on different factors using a varimax rotation. We then entered the variables for each factor into separate analyses to confirm that they each loaded onto a single factor. Regression coefficients were calculated from the second set of analyses for each participant on each factor; these served as the individual difference scores in subsequent analyses. The variable loadings for each factor are also found in Table 4.
Participant Characteristics and Behavioral Measures

Note: AoA = age of acquisition
Pearson Correlations between Background Measures
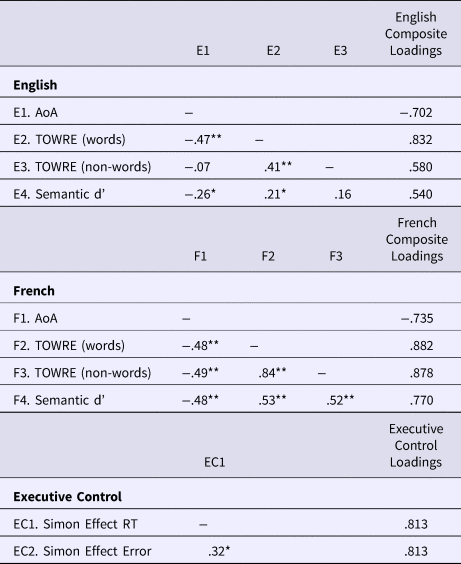
Note: AoA = age of acquisition
Sentence comprehension
Accuracy was 93% for questions on filler sentences, indicating that participants read for meaning. Accuracy for sentences containing French homophones (85%) was significantly higher (t(95) = 4.92, p < .001) than sentences containing spelling control words (80%).
Eye movement data
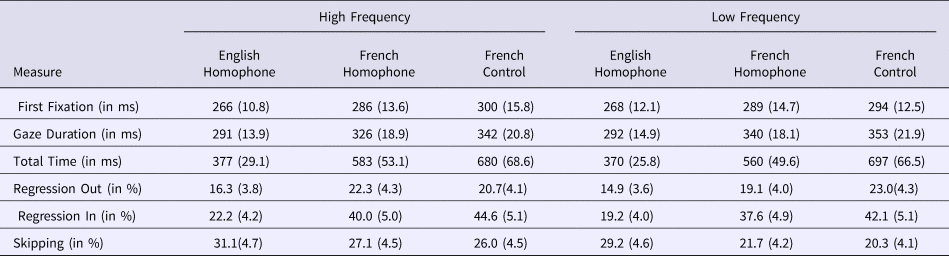
We examined three early-stage and two late-stage eye movement reading measures. Early-stage measures, taken to reflect initial activation of word representations, included first fixation duration (FFD; duration of initial fixation), gaze duration (GD, sum of all fixation durations during first pass on a word), and regressions out1 (probability of regressing out of a word to an earlier word). Late-stage measures, taken to reflect post-lexical integration, included regressions in (probability of regressing back into a word from a later word) and total reading time (TRT, sum of all fixation and re-fixation durations on a word). Although skipping rates were also examined, there were no significant differences between the critical French conditions (all zs < 1); thus, analyses are not reported. Means for word type by word frequency for each measure are presented in Table 5.
Means and Standard Deviations for Eye Movement Measures as a function of Word Type and Word Frequency

Across the experiment, 0.4% of the trials were removed because of track loss and/or skimming (i.e., failure to fixate on large portions of the sentences). Data from trials with fixation durations less than 80 ms were discarded (FFD = 23, GD = 23, TRT = 20). No upper cutoff was applied to fixations; rather, analyses were performed on log-transformed data.
The data were analyzed using linear mixed-effects models (LMMs) within the lme4 package (Bates & Sarkar, Reference Bates and Sarkar2006) of R (version 3.3.0) (Baayen, Reference Baayen2008; Baayen, Davidson & Bates, Reference Baayen, Davidson and Bates2008; R Development Core Team, 2017). Logistic generalized linear mixed models (GLMMs) were used for the regression data. The specifications of each model (e.g., fixed and random effects structure) are reported for each analysis to follow. Only effects of theoretical interest are reported in the text. Complete model outputs can be found in Appendices B through H.
For ease of data interpretation, we first present the analyses of homophone effects. In these analyses, fixed effects included word type (French homophones vs. French control words) and word frequency (high vs. low); both variables were deviation-coded (0.5, -0.5)2. Control predictors included word length (continuous), orthographic similarity to the unseen English homophone (continuous), and phonological similarity of the French homophone to the unseen English homophone (continuous); continuous variables were scaled (i.e., z-scored)3. Random effects included random intercepts for participants and items, and random slope adjustments for word type across participants4. Initially, maximal random effect structures were employed, where both word type and word frequency were included in the participant random slope. However, several models failed to converge; thus, word frequency was dropped from the random slope for all analyses. Subsequently, we conducted separate analyses where each composite score was included as a fixed effect, along with word type and word frequency. The p-values were derived using Satterthwaite approximations of degrees of freedom in the lmerTest function, an approach found to produce acceptable Type 1 error rates (Luke, Reference Luke2017).
Homophone facilitation effects
Early-stage measures
A marginal effect of word type was found for FFD (β = −0.02, SE = 0.01, t = −1.77, p = .08) and GD (β = −0.03, SE = 0.002, t = −1.63, p = .10); fixations were marginally shorter for homophones than for control words. Although the interactions of word type and word frequency were non-significant for both FFD (β = −0.03, SE = 0.02, t = −1.25, ns) and GD (β = −0.03, SE = 0.003, t = −0.83, ns), our prediction that the homophone effect would be significant for high-frequency words was confirmed (FFD: β = −0.02, SE = 0.01, t = −2.07, p < .05; GD: β = −0.02, SE = 0.01, t = −1.92, p = .06). The effect was not significant for low-frequency words (FFD: β = −0.01, SE = 0.01, t = −0.74, ns; GD: β = −0.01, SE = 0.01, t = −0.68, ns).
A significant two-way interaction between word type and word frequency (β = 0.43, SE = 0.14, z = 2.96, p < .01) was found for Regressions Out. Sub-models of word frequency revealed that the homophone effect occurred for low-frequency words (β = −0.30, SE = 0.10, z = −2.92, p < .01); fewer regressions out occurred for low-frequency French homophones than for control words. The homophone effect was non-significant for high-frequency words (β = 0.13, SE = 0.10, z = 1.31, ns).
Late-stage measures
A significant effect of word type was found for both Regressions In (β = −0.30, SE = 0.08, z = −3.61, p < .001) and TRT (β = −0.12, SE = 0.03, t = −3.74, p < .001); fewer regressions in and shorter reading times occurred for French homophones than for French control words. No other effects were observed.
Summary
Interlingual homophone errors were less disruptive than spelling control errors. In the immediate eye-tracking measures, this effect was seen in fixation durations for high-frequency words, whereas for low-frequency words this effect was seen in regressions made from the target word. Both late-stage measures showed a robust interlingual homophone facilitation effect, indicating that French homophones were easier to integrate into the English sentences than French spelling control words.
Individual differences effects
French proficiency
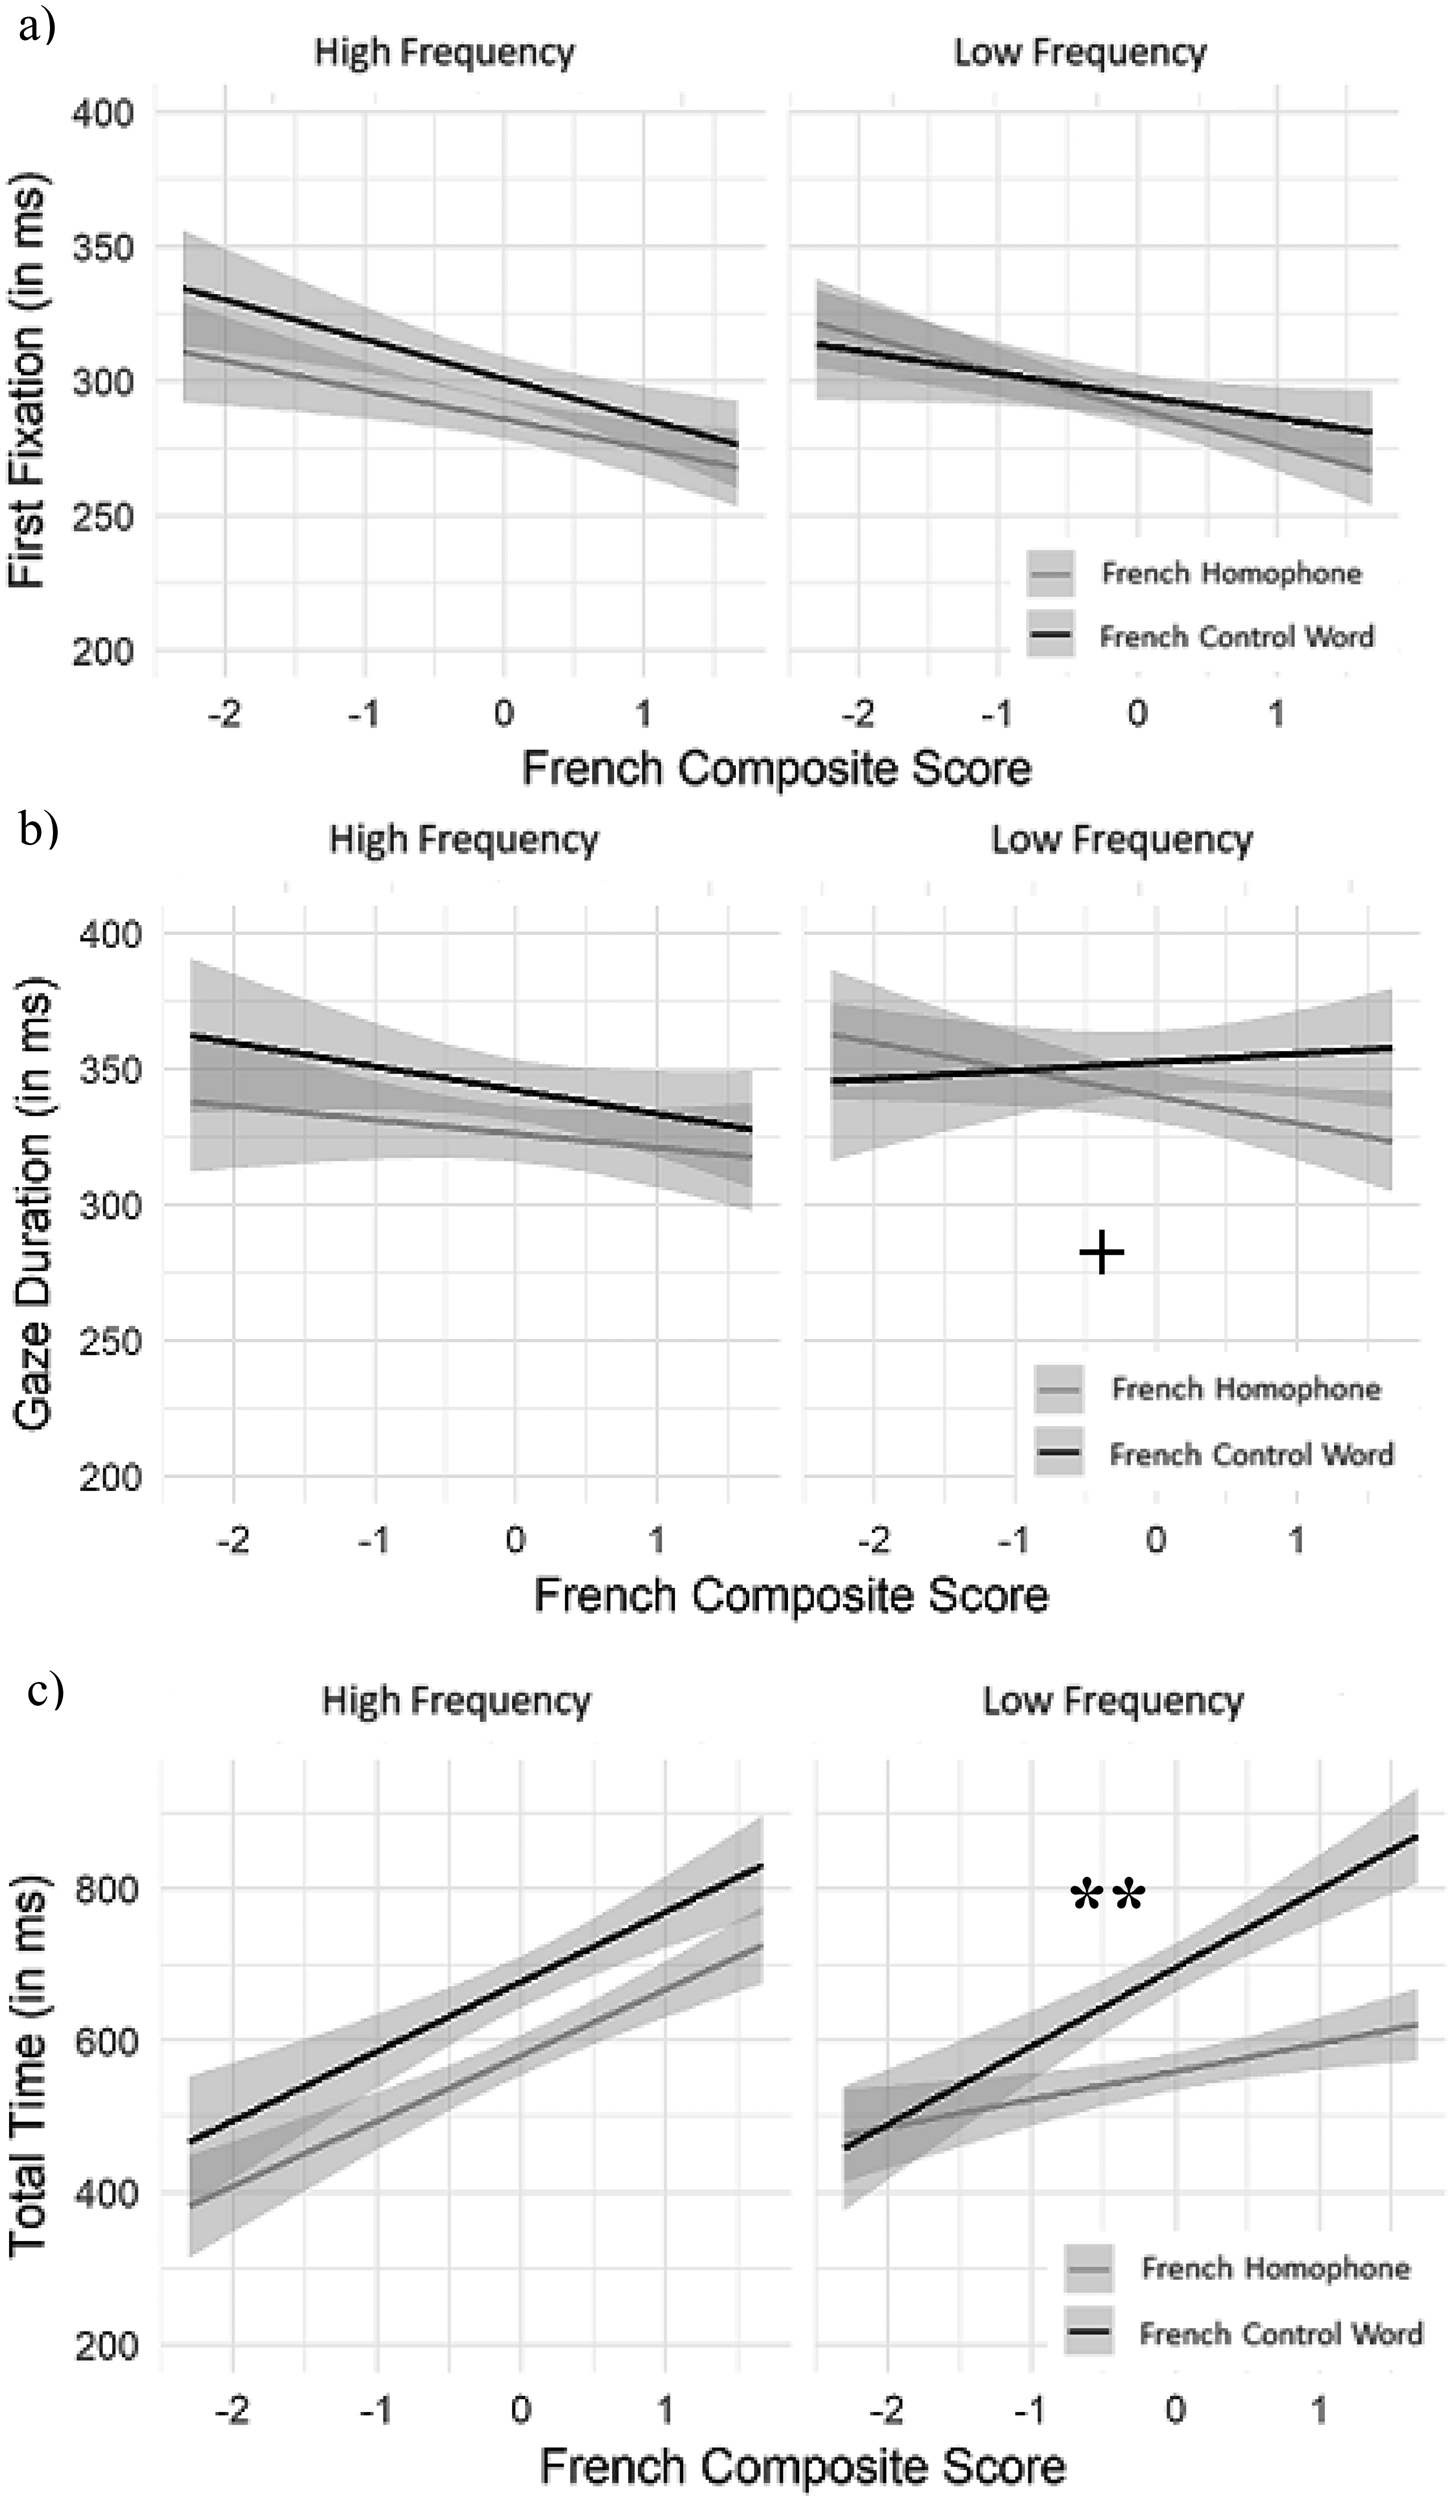
The three-way interaction between word type, word frequency, and French proficiency approached significance in the early measures (FFD: β = −0.04, SE = 0.02, t = 1.84, p = .06; GD: β = 0.04, SE = 0.02, t = 1.86, p = .06), and was firmly established in the late measures (TRT: β = 0.08, SE = 0.03, t = 2.65, p < .01; Regressions In: β = 0.23, SE = 0.11, z = 2.65, p < .01). Models were then run separately for low- and high-frequency French words. For low-frequency words, fixations were influenced by French proficiency. In FFD, shorter fixations related to greater French proficiency (β = −0.03, SE = 0.02, t = −2.12, p < .05). The interaction between word type and French proficiency was not significant in FFD (β = −0.01, SE = 0.01, t = −0.72, ns), but approached significance in GD (β = −0.02, SE = 0.01, t = −1.83, p = .07). This interaction was significant in TRT (β = −0.07, SE = 0.03, t = −2.69, p < .01) and Regressions In (β = −0.11, SE = 0.04, z = −2.83, p < .01). Here, higher French proficiency scores related to larger homophone facilitation effects (See Figure 2).
The Bilingual Interactive Activation+ Model (BIA+) by Dijkstra and van Heuven (2002). Reproduced with permission of The Licensor through PLSclear.

First Fixation (a), Gaze Duration (b), and Total Reading Time (c) as a function word type, word frequency, and French proficiency. Actual values are plotted. Shaded areas represent confidence intervals. Interactions are marked: + p < .1, ** p < .01

For high-frequency words, there was no interaction between word type and French proficiency (FFD: β = 0.01, SE = 0.01, t = 0.90, ns; GD: β = 0.01, SE = 0.01, t = 0.66, ns; TRT: β = 0.01, SE = 0.02, t = 0.35, ns; Regressions In: β = 0.01, SE = 0.04, t = 0.19, ns; Regressions Out: β = 0.01, SE = 0.10, t = 0.15, ns). However, the main effect of word type as reported above was still present for high-frequency words, particularly in the early measures (FFD: β = −0.02, SE = 0.01, t = −2.07, p < .05; GD: β = −0.02, SE = 0.01, t = −1.92, p = .06; TRT: β = −0.08, SE = 0.05, t = −1.78, p = .08); fixations were shorter for homophones than for control words.
English proficiency
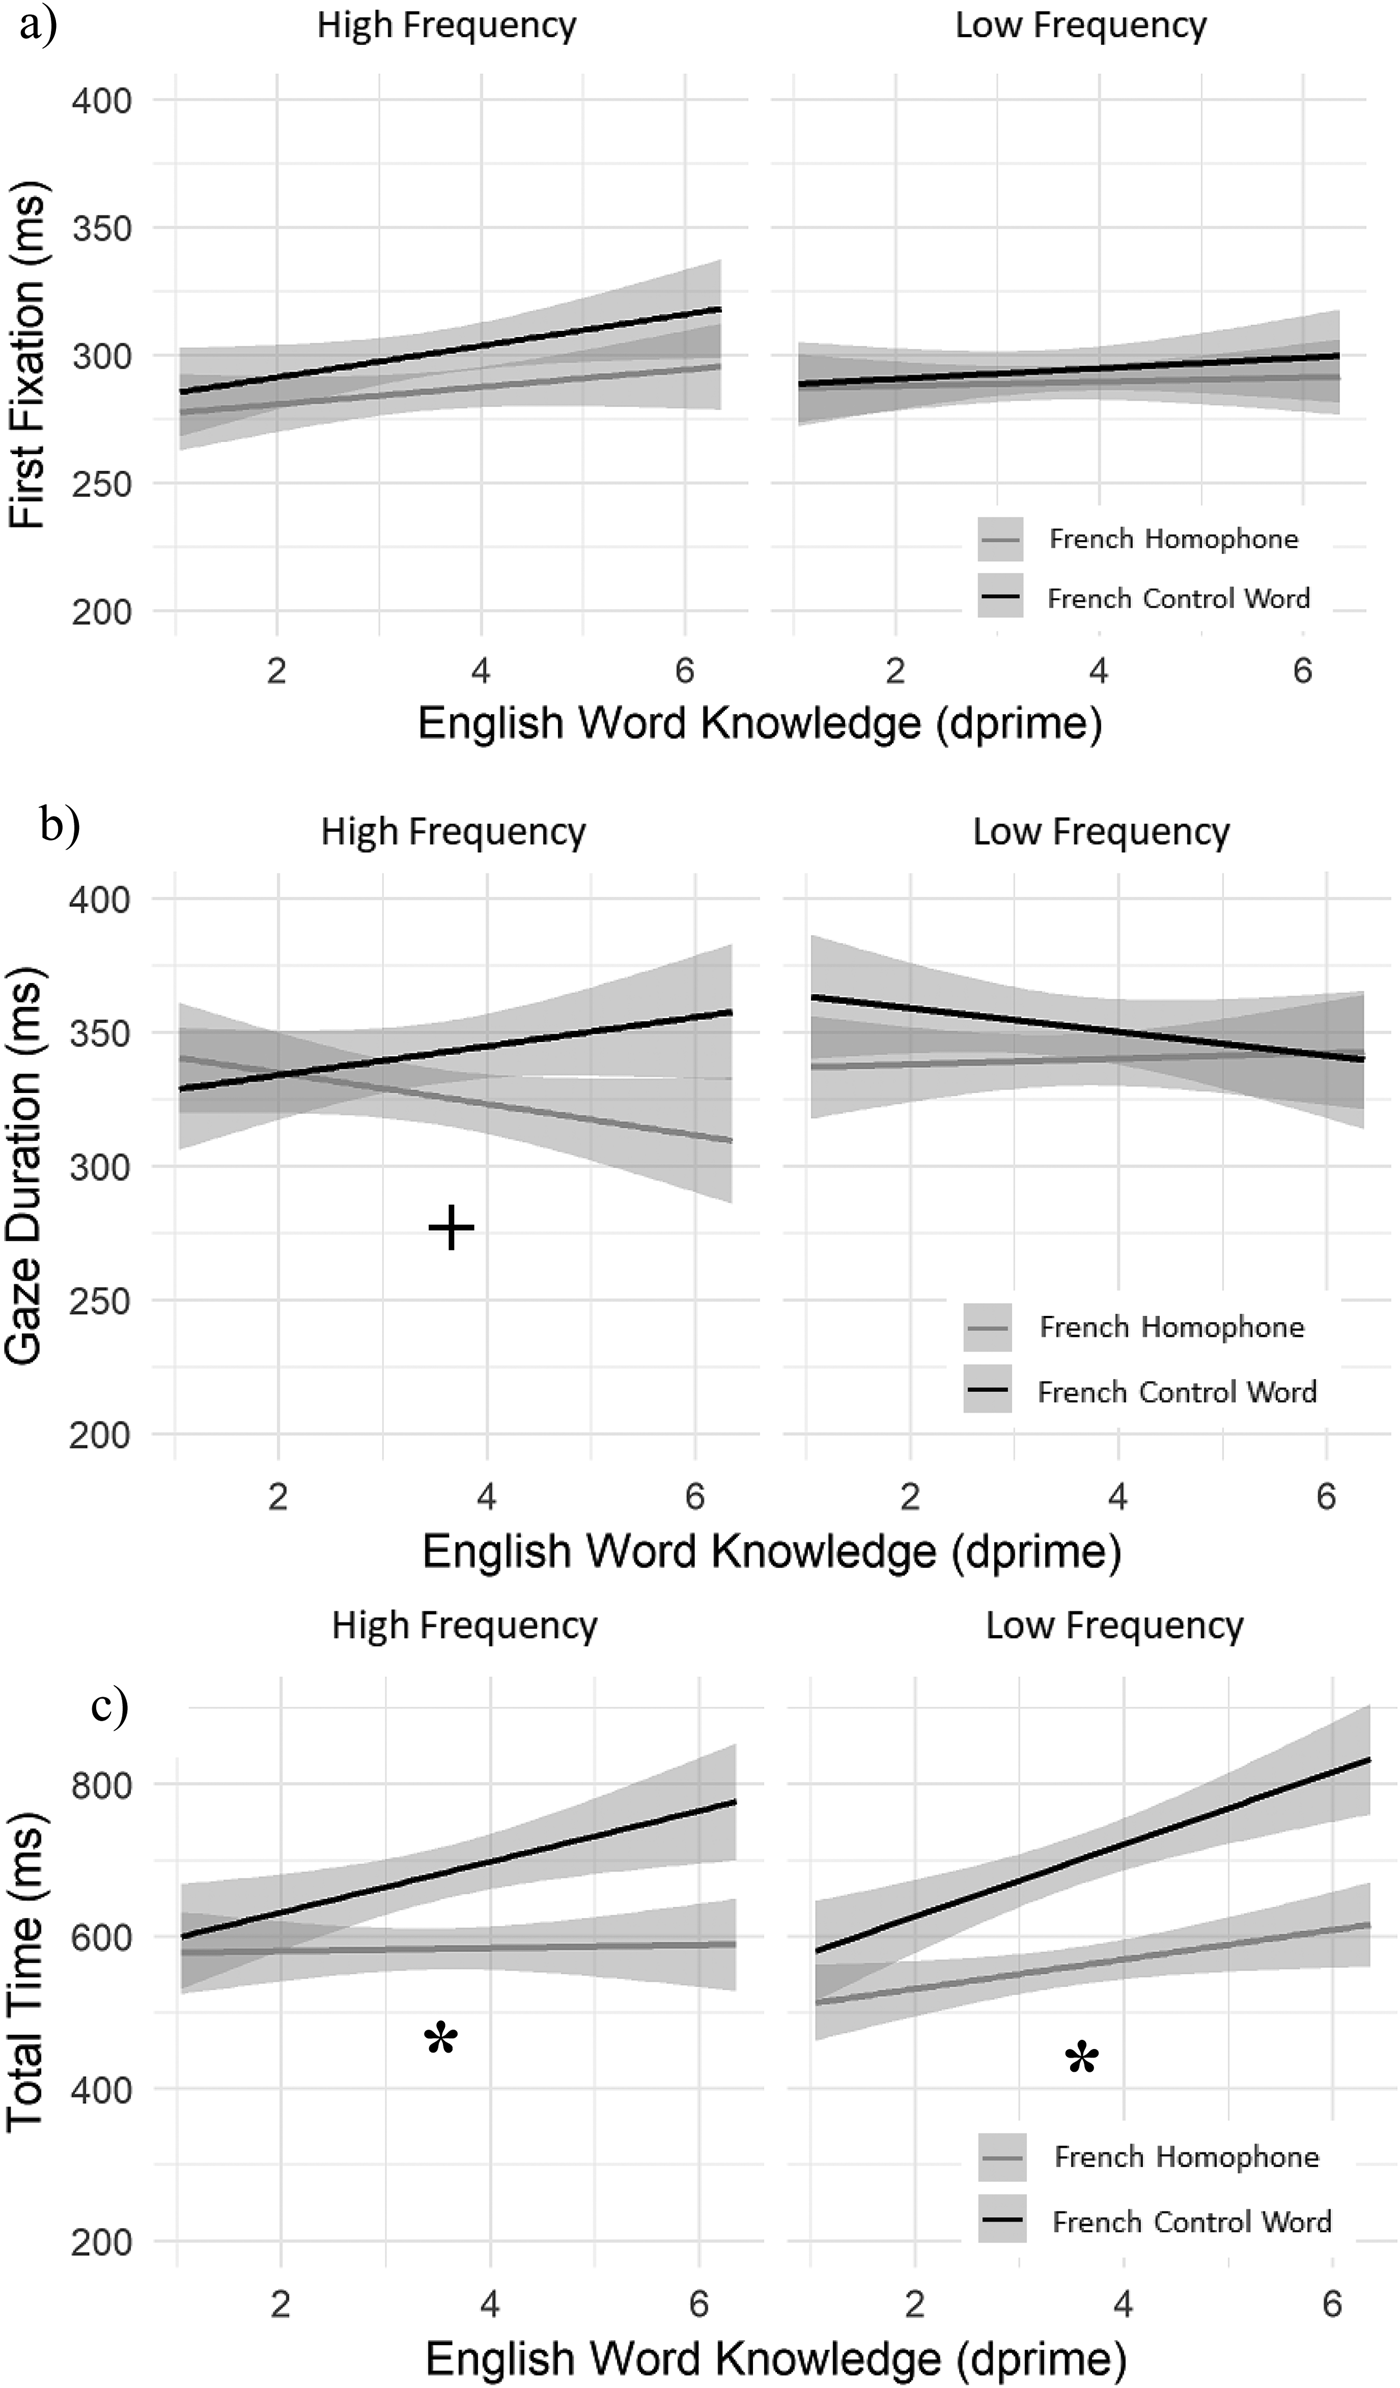
There was no influence of English proficiency (see Appendix D). However, the English word knowledge variable had a low factor loading, and, thus, was not well captured by the English composite score. English word knowledge is key to readers’ ability to activate the English meaning from the shared phonology. A subsequent analysis was conducted with English word knowledge (d' scores) as a fixed factor. For the early-stage measures, there was a significant two-way interaction between word type and English word knowledge for Regressions Out (β = −0.15, SE = 0.06, z = −2.27, p < .05); better English word knowledge related to more regressions out of control words than interlingual homophones. A marginal three-way interaction between word type, word frequency, and English word knowledge for GD (β = −0.04, SE = 0.02, t = −1.80, p = .07) indicated that better English word knowledge related to larger homophone effects in high-frequency words.
For the late-stage measures, there was a significant two-way interaction between word type and English word knowledge for TRT (β = −0.03, SE = 0.01, t = −2.25, p < .05); better English word knowledge related to longer reading times for control words than for interlingual homophones. There was also a three-way interaction between word type, word frequency, and English word knowledge for Regressions In (β = 0.24, SE = 0.11, z = 2.26, p < .05). For low-frequency words, better English word knowledge related to more regressions into control words than into interlingual homophones (see Figure 3).
First Fixation (a), Gaze Duration (b), and Total Reading Time (c) as a function of word type, word frequency, and English word knowledge. Actual values are plotted. Shaded areas represent confidence intervals. Interactions are marked: + p < .1, * p < .05

Executive control ability
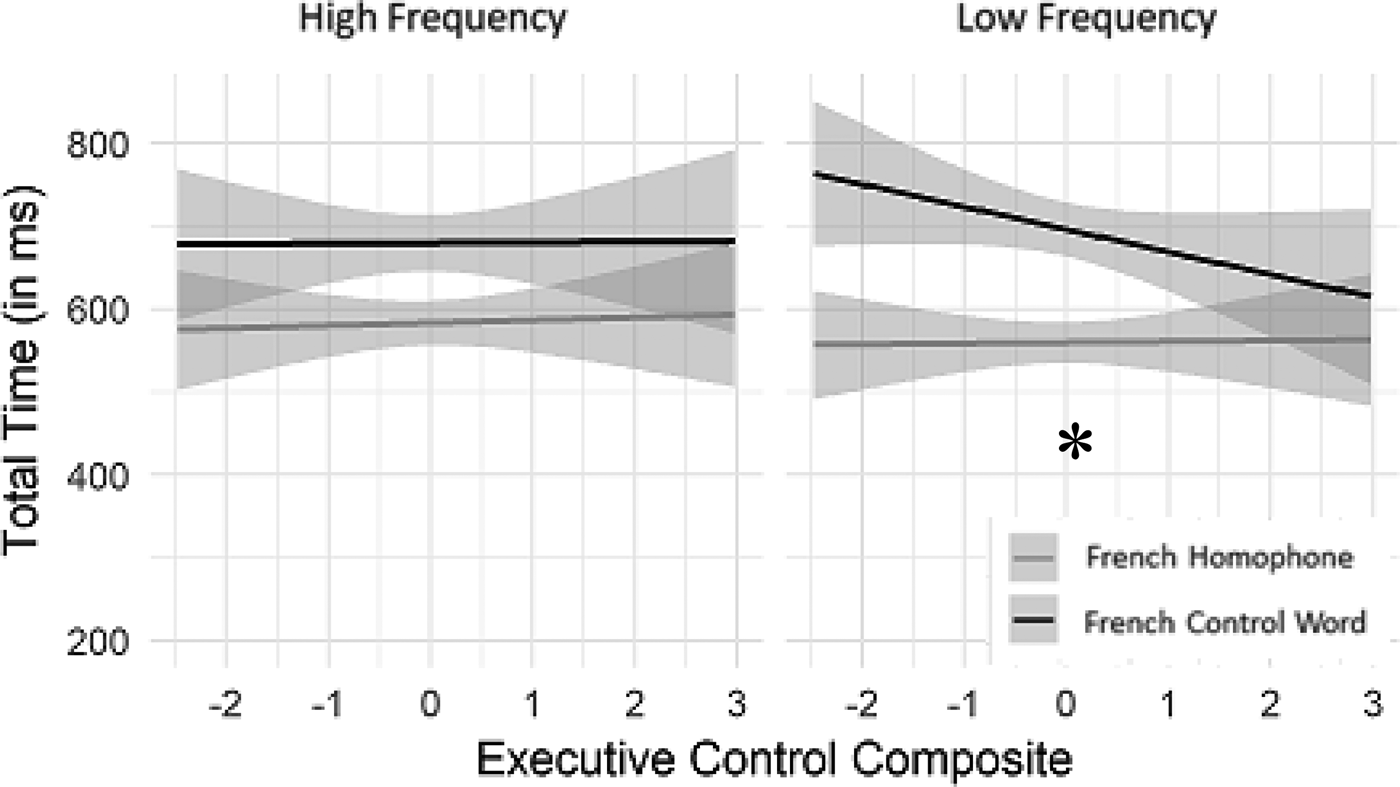
For early-stage measures, although better executive control related to longer initial fixations on French words (FFD: β = −0.02, SE = 0.01, t = −1.80, p < .08; GD: β = −0.04, SE = 0.02, t = −2.28, p < .05), this variable did not modulate the homophone effect. In contrast, for TRT, there was a significant three-way interaction between word type, word frequency, and executive control ability (β = −0.07, SE = 0.03, t = −2.26, p < .05). Sub-models of word frequency revealed a significant interaction between word type and executive control ability (β = 0.07, SE = 0.03, t = 2.68, p < .01) for low-frequency words only (see Figure 4). Smaller executive control composite scores (i.e., better executive control) related to longer reading times for control words than for interlingual homophones.
Total Reading Time as a function of word type, word frequency, and executive control composite score. Actual values are plotted. Shaded areas represent confidence intervals. Interactions are marked: * p < .05

Summary
The interlingual homophone effect was modulated by individual differences in participant skills, primarily for low-frequency words during late-stage reading. In particular, participants who were more proficient in French showed a larger homophone facilitation effect for low-frequency words. Likewise, participants with greater executive control ability showed a larger homophone facilitation effect. Larger homophone effects were also found for those with better English word knowledge, regardless of word frequency.
Discussion
This study is novel in two key ways: (1) It is the first to examine the dynamics of cross-language phonologically-mediated meaning activation through the use of eye-tracking, which can disentangle early- and late-stage processing and (2) It is the first to examine how individual differences in language proficiency and executive control impact the nature of this activation. A homophone error paradigm using English sentences with French interlingual homophones and their French control words was employed. Shorter/fewer fixations on homophones relative to their spelling control words indicated that shared phonology activated the meaning of the corresponding English homophone, and that readers incorporated this meaning into their understanding of the sentences.
Below we discuss our findings, starting with the core effects, and then how they were influenced by our individual differences measures. Recall that the early-stage reading measures (FFD, GD, and Regressions Out) are most relevant to understanding initial activation of word representations and that data from the late-stage measures (Regressions In, TRT) reflect the ease with which participants integrated the meanings activated by the French error words into their understanding of the sentences.
Homophone facilitation effects
Analyses of core effects revealed that French interlingual homophone errors were less disruptive to reading than French spelling control errors when initially encountered. Readers exhibited marginally shorter fixations on homophone errors than on spelling control errors for early-stage fixation measures; an effect that reached significance for the high-frequency words. These results are consistent with previous findings of facilitatory interlingual homophone effects in single word reading tasks (e.g., Carrasco-Ortiz et al., Reference Carrasco-Ortiz, Midgley and Frenck-Mestre2012; Friesen et al., Reference Friesen, Jared and Haigh2014; Haigh & Jared, Reference Haigh and Jared2007; Lemhöfer & Dijkstra, Reference Lemhöfer and Dijkstra2004), and provide additional support that readers activate phonological representations that are shared across languages. However, here we demonstrate these effects on initial word processing, in the absence of a response-based task (e.g., lexical decision), suggesting that some phonological activation occurs during initial lexical processing rather than once a word has been identified5.
This facilitatory homophone effect could further reflect activation to semantic representations associated with the unseen English homophone. As our sentence ratings showed, the meanings associated with the English homophones were more plausible continuations of the initial sentence contexts than either French meaning. Activating the meanings associated with the English members of the homophone pairs would, therefore, facilitate reading even in the early measures. Corroborating evidence that these English meanings were indeed quickly activated comes from our finding that fewer regressions were made from low-frequency homophone errors than from spelling controls, because regressions are indicative of anomaly detection. Notably, we found evidence of early phonological activation, even in the absence of a strong biasing context. Most studies provide a biasing context that allows for a “head start” to maximize the likelihood of observing homophone effects (e.g., FitzPatrick & Indefrey, Reference FitzPatrick and Indefrey2014; Newman & Connolly, Reference Newman and Connolly2004; Niznikiewicz & Squires, Reference Niznikiewicz and Squires1996; Savill et al., Reference Savill, Lindell, Booth, West and Thierry2011).
The TRT and Regressions In measures capture participants’ ability to integrate the French error words into the English sentence. For the French homophone to be successfully integrated, its phonological representation must be activated from print, and that phonological representation must, in turn, activate the semantics associated with the English homophone. If TRTs for interlingual homophones and spelling control errors do not differ, it suggests that participants were not activating shared phonology and/or were unable to retrieve the English meaning associated with the shared phonology. Results were more robust for late-stage reading measures than for early-stage ones. Readers found it easier to integrate the French homophones into their understanding of the sentence, as evidenced by shorter TRTs and fewer regressions into the critical region for homophones relative to control words, suggesting that meanings associated with the English members of French interlingual homophones were all eventually activated.
Our late-stage reading results are consistent with response-based tasks like category verification, which report robust phonological effects when top-down information is provided (e.g., Friesen et al., Reference Friesen, Oh and Bialystok2016; Jared & Seidenberg, Reference Jared and Seidenberg1991; van Orden, Reference van Orden1987). In our task, the region after the target word provided some disambiguating information, allowing the reader to understand the sentence only if they activated the English meaning. Similarly, Friesen and Jared (Reference Friesen and Jared2012) reported that bilinguals were slower and less accurate in correctly rejecting homophones (e.g., shoe) as category members (e.g., vegetable) when the unseen homophone mate (e.g., /chou/ cabbage) was a category member. Although numerous studies have found that words in one language activate phonological representations for words in the other language, only a few have demonstrated that these phonological representations were activated strongly enough to activate their corresponding semantic representations from the other language.
Individual differences
Although the core effects analyses revealed that readers were accessing cross-language meaning through shared phonology, individual differences variables provided a more nuanced story of the dynamics of lexical activation. Both language experience and executive control ability influenced lexical activation. Specifically, participant characteristics (e.g., French proficiency, executive control) had a greater influence on the processing of low-frequency words than of high-frequency words, and the influence of these individual difference measures was more robust during late-stage reading than in early-stage reading.
French language proficiency
As noted, the homophone effect for high-frequency words was not influenced by French proficiency; in general, readers spent less time processing homophones than their control words. Presumably for all French users, the phonological representations of these words were quickly and strongly activated. As these words were more familiar, their shared phonological code was readily accessible, leading to activation of the associated English meaning.
Individual differences in French proficiency did influence the processing of low-frequency words; more proficient French users were more likely to exhibit facilitatory homophone effects. The influence of French proficiency began as early as FFD and was fully realized in TRT. Given that less proficient French users had ample time to activate phonological representations, it is likely that the phonological representations that they generated from the low-frequency French interlingual homophones were not accurate enough to activate the meaning associated with the English homophone. Note that low proficiency French users had low scores on the French TOWRE, indicating weaker word reading fluency and decoding skills. In contrast, more proficient French readers would have activated phonological representations from the low-frequency French homophones quickly and strongly, making it more likely that subsequent activation of English semantic representations would be detectable.
The finding that language ability modulated the homophone facilitation effect for low-frequency words is consistent with research in both the monolingual and bilingual literatures. In a monolingual version of our task, Jared and colleagues (Reference Jared, Levy and Rayner1999) reported that reader skill influenced the size of homophone effects. Likewise, Gollan and colleagues (Reference Gollan, Montoya, Cera and Sandoval2008) reported that language experience influenced naming latencies for low-frequency items more than high-frequency items in a picture naming task, such that the difference between monolingual and bilingual naming latencies was much more pronounced for the low-frequency items.
Leading models of bilingual language processing, such as BIA+ (Dijkstra & van Heuven, Reference Dijkstra and van Heuven2002) and the weaker links hypothesis (Gollan et al., Reference Gollan, Montoya, Cera and Sandoval2008), provide frequency-based explanations of lexical processing that can account for our results. These models assume that lexical representations have different baseline activation levels as a function of exposure; high-frequency words have higher baseline activation levels than low-frequency words because they are, by definition, encountered more often. However, there are diminishing returns; once a representation reaches a certain activation level, additional exposures have little impact on its representation or its processing, as is the case with high-frequency words. In contrast, additional encounters with low-frequency words may increase their activation levels and, ultimately, strengthen the connections between orthographic and phonological representations. Accordingly, low-frequency words should be more sensitive to individual differences in French exposure. As expected, our individual difference effects were strongest for low-frequency words.
English language proficiency
Our English composite score was not associated with homophone effects; however, a specific component – English word knowledge – was the most relevant variable. It was only weakly associated with other proficiency measures and did not load well on the English composite. Yet, results revealed as accuracy on the English semantic judgment task increased, processing differences between spelling controls and French homophones also increased. Better English knowledge was associated with more regressions out of spelling controls than out of French homophones, suggesting better English word knowledge enables readers to integrate the homophones into their initial understanding, whereas repair processes were necessary for spelling controls. Strong connections between shared phonological representations and English meanings allow the English meaning to be sufficiently activated from the French homophone.
English word knowledge and word frequency exerted different influences on early versus late fixation measures. In TRT, the relationship between English word knowledge and homophone effects was not influenced by French word frequency. This is likely because the English homophones were all of low frequency (e.g., leer, mare) and, consequently, both French frequency conditions required strong English vocabulary knowledge. However, notably, in Figure 3 there is a hint that the interaction between English word knowledge and word type emerges earlier (i.e., on GD) in the high-frequency condition, but not in the low-frequency condition. If, as we saw from our core effects analysis, high-frequency French homophones initially activate the shared phonology strongly in all readers, then individual differences in the strength of phonology-semantic connections (e.g., moʊ (mow) to “cut grass”) may be detected more readily for these words relative to low-frequency words.
Executive control
Our measure of executive control ability (as assessed by a Simon Arrows task) was sufficiently sensitive to capture individual differences in readers’ attention to critical words. Overall, better executive control was associated with longer initial fixations on French words. That is, individuals who ignored irrelevant information better in the executive control task maintained more initial attention on the anomalous words, perhaps recognizing these words’ importance for their ultimate understanding of the sentence. The ability to monitor comprehension and maintain attention to relevant information is critical while reading for meaning. However, during early-stage reading, executive control ability was not associated with homophone facilitation effects. This finding suggests that domain-general executive control is not being engaged to either inhibit the activation of French spelling-sound correspondences in an English context or inhibit the English meaning when encountering a French homophone. Instead, activation appears to spread across the word recognition system in a language non-selective manner.
It is only when readers are integrating the word meaning into their understanding of the sentence that an effect of executive control ability on homophone processing is observed. Better executive control ability was associated with larger homophone effects in TRT for low-frequency words. This effect can be attributed to participants’ increased efforts to incorporate the French control word into their understanding of the sentences, rather than quicker processing of homophones. Indeed, participants had already retrieved the homophones’ relevant meaning and did not require re-analysis of the sentence. Although this effect may be counterintuitive, recall that participants were instructed to read the sentences for meaning and better executive control ability enables readers to strategically modulate their reading behaviors to meet the demands of the task.
To date, the findings are mixed about whether executive control ability operates within the word recognition system to impact identification. Recall that Pivneva and colleagues (Reference Pivneva, Mercier and Titone2014) reported less homograph interference in GD for individuals with greater executive control. Friesen and Haigh (Reference Friesen and Haigh2018) reported smaller interlingual priming effects for individuals with better ability to suppress the non-target language. However, Prior, Degani, Awawdy, Yassin, and Korem (Reference Prior, Degani, Awawdy, Yassin and Korem2017) found no relationship between the degree of L1 interference in an L2 semantic similarity judgment task and performance on executive control measures of inhibition and task switching. Here, we did not observe an influence of executive control on homophone effects during early-stage reading. However, in our task, there was no value in engaging executive control processes to initially suppress or ignore the English meaning of the French homophone since this meaning facilitated understanding of the sentence. Our results suggest that engaging executive control processes to immediately suppress the non-target meaning does not happen automatically upon encountering the interlingual word. Future studies should design sentences that clearly bias readers against activating the non-target language meaning of a homophone pair. If inhibitory effects of executive control ability are present during early-stage reading, they should be more readily detectable.
Theoretical implications
There are several important theoretical implications that arise from our findings. First, consistent with the architecture and principles of BIA+, the indirect pathway to meaning (orthography-phonology-semantics) can be used to activate cross-language meaning in a language non-selective manner during the initial stages of word recognition. While there have been numerous studies showing that printed words in one language can activate phonological representations corresponding to words in the other language (e.g, Carrasco-Ortiz et al., Reference Carrasco-Ortiz, Midgley and Frenck-Mestre2012; Dijkstra et al., Reference Dijkstra, Grainger and van Heuven1999; Haigh & Jared, Reference Haigh and Jared2007; Lemhöfer & Dijkstra, Reference Lemhöfer and Dijkstra2004), there was little available evidence demonstrating that activation from phonological representations could, in turn, activate associated semantic representation from the other language. Clear support for the use of this pathway comes from evidence that strong French phonological representations (indexed by higher French proficiency) and strong English semantic knowledge (indexed by greater accuracy on the English semantic judgment task) result in larger homophone effects. Second, the differential impact of word frequency and language skill are consistent with the importance of experience highlighted in both BIA+ (Dijkstra & van Heuven, Reference Dijkstra and van Heuven2002) and the weaker links hypothesis (Gollan et al., Reference Gollan, Montoya, Cera and Sandoval2008). Individuals with higher levels of language proficiency were more strongly impacted by homophony.
As seen in Table 5, participants had much shorter fixation durations on the English members of the homophone pairs than on the French words. The original BIA model (Dijkstra & van Heuven, Reference Dijkstra, van Heuven, Grainger and Jacobs1998) had top-down inhibitory connections from the language nodes, and could explain this finding by assuming that when reading English sentences, participants inhibited French lexical representations. The current instantiation of BIA+ does not have these top-down inhibitory connections from the language nodes, and assumes that lexical representations from each language are available for selection based on their current resting activation levels. The model could explain our findings by assuming that English words generally had higher resting activation levels than French words. The specific English homophones were not predictable from the context, as our sentence completion results demonstrate, and, thus, the higher resting activation levels would have to be more general. However, the model also assumes that activated words inhibit one another, and it is unclear what the accumulated impact of this inhibition would be as participants read English sentences.
Pivneva and colleagues (Reference Pivneva, Mercier and Titone2014) raised another important concern, which is that BIA+ does not specify a role for domain-general executive control ability. In their study, they found that greater executive control ability related to less interlingual homograph intereference, indexed by shorter fixation durations during early-stage reading. We too observed that individuals with better executive control modulated their reading behaviors by allocating more time to processing French words during early-stage reading. However, this effect was not specific to interlingual homophones, but rather reflected attention to anomalous words. This finding suggests that executive control impacted general reading behaviors rather than language non-selectivity. The distinction between domain-general executive control processes operating on the language system and inhibition within the codes of the language system is an important one for models of language processing. In their Adaptive Control Hypothesis, Green and Abutalebi (Reference Green and Abutalebi2013) propose that the degree to which control is engaged depends on the bilingual nature of the context, and that systematically varying task demands may shed light on how control is utilized during language processing. Future research should further explore the relative contributions of domain-general control processes and control processes specific to the language system on cross-language activation during natural reading in bilinguals.
Limitations and future directions
Our study used an interlingual homophone error paradigm, in which sentences were in English and on critical trials the French member of the interlingual homophone pair replaced the English mate (Lemhöfer et al., Reference Lemhöfer, Huestegge and Mulder2018, also replaced target language words with words from the bilinguals’ other language in a sentence reading study). The presence of French words may have encouraged our participants to keep both languages active (e.g., Kreiner & Degani, Reference Kreiner and Degani2015; Mercier, Pivneva & Titone, Reference Mercier, Pivneva and Titone2016), even though only 2.6% of the encountered words were in French. This co-activation may have exaggerated the homophone effects. However, we confirmed that the homophone effects did not increase as the experiment progressed (across both reading stages), suggesting that participants were not becoming more strategic. Now that we have found clear evidence for cross-language semantic activation from phonology using this paradigm, the next step would be to make the manipulation subtler and only use words from a single language. An English sentence could contain an interlingual homophone, but have the French meaning fit the sentence (e.g., Kristin made a coleslaw using chopped shoe and carrots). Similarly, a French sentence could contain an interlingual homophone, but have the English meaning fit the sentence (e.g., Michelle a marché dans une flaque d'eau et son chou est complètement mouillé – Michelle walked into a puddle and her cabbage (shoe) is completely wet). Reading times on interlingual homophones would need to be compared to spelling control words. We would hypothesize that homophone effects are most likely to occur when participants are highly fluent in the non-target language.
Conclusion
Our study demonstrates that phonologically-mediated cross-language meaning activation occurs during both early- and late-stage reading. Our focus on individual differences in language proficiency and executive control ability allowed us to gain a better understanding of the dynamics operating during reading for meaning. Greater French proficiency, English semantic knowledge, and executive control ability were all associated with differences in how meaning was accessed. Future models of bilingual language processing would greatly benefit from research treating bilingualism and its constituent components along a continuum rather than dichotomously.
Author ORCIDs
Deanna C. Friesen, 0000-0002-1510-6102
We thank Lorin Alarachi, Naomi Vingron, Paige Palenski, and Vincent Rouillard for their assistance with data collection. Veronica Whitford is now at the Department of Psychology, University of Texas at El Paso. This work was supported by Natural Sciences and Engineering Research Council of Canada Discovery Grants awarded to DJ and to DT.
Appendix A: Critical Stimuli
Appendix B: Core Effects
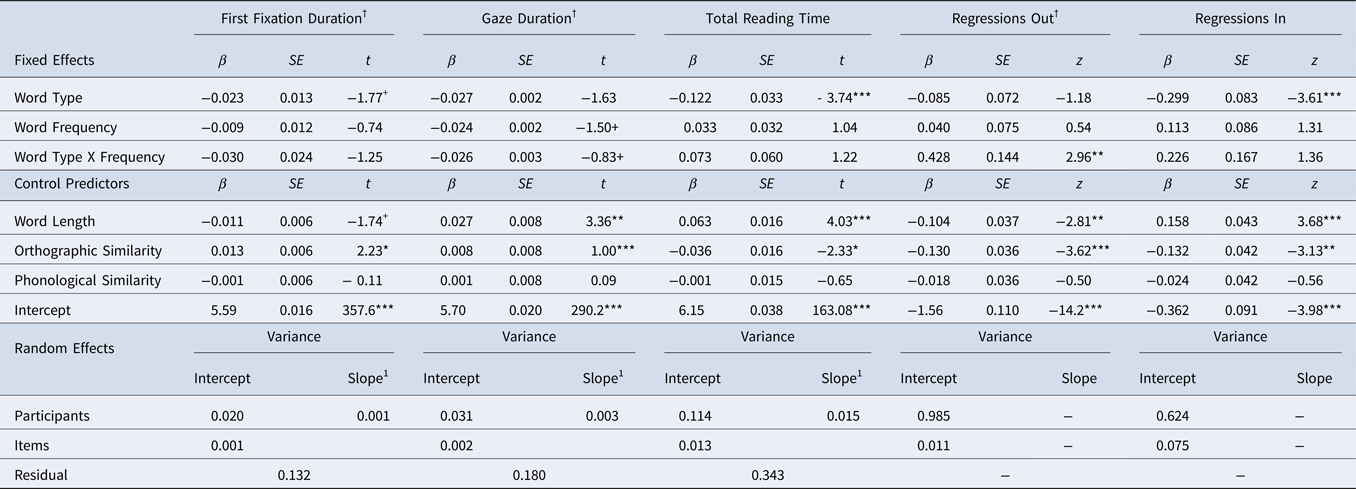
Appendix C: French Proficiency

Appendix D: English Proficiency

Appendix E: English Word Knowledge

Appendix F: Executive Control