Introduction
An important number of cathode materials such as mixed oxides, polyanions, and metallic complexes[Reference Ivanova, Zhecheva, Nihtianova, Mladenov and Stoyanova1–Reference Soltane and Sediri3] have been studied in the scope to find new materials with better morphological, structural, and electrochemical properties to increase the performance of lithium batteries. A practical cathode must exhibit stable framework, relatively high-voltage, good lithium transport, and large theoretical capacity. The framework materials based on the phosphate polyanion have recently been identified as potential electroactive materials for lithium-ion batteries applications.[Reference Jugovic and Uskokovic4–Reference Cheng, Tao, Liang and Chen6]
LiFePO4 is a good candidate because it presents low level of toxicity, safe to handle, low cost, high cycles number, high-energy density as well as a high thermal and structural stability. The LiFePO4 undergoes a complete insertion/extraction process without a significant change in the structure due to the strong P–O bond within the polyanion PO43−, which provides a high stability for lithium ions migration. LiFePO4 also presents a relatively high theoretical capacity (170 mAh/g), which means it has been considered as an excellent candidate to be used in the manufacturing of lithium -ion rechargeable batteries. However, one of its greatest difficulties are: low conductivity and low transportation of Li-ions; resulting a poor C-rate. Many works have been carried out with the purpose of fixing this deficiency. They are focused on improving the synthesis conditions, adopting different methodologies as for example sol–gel,[Reference Jugovic and Uskokovic4, Reference Fu, Liu, Li, Wu, Rahm, Holze and Wu7] hydrothermal,[Reference Jugovic and Uskokovic4, Reference Chen and Whittingham8–Reference Jin and Gu10] solvothermal,[Reference Wang, Zhu, Wang and Wang11] solid-state reaction,[Reference Jugovic and Uskokovic4, Reference Zhou, Chen, Bai, Su, Feng and Guo12] carbothermal reduction,[Reference Jugovic and Uskokovic4, Reference Shengkui, Letong, Jiqiong, Yanwei, Jian, Jiequn and Yanhong13] among others.[Reference Jugovic and Uskokovic4] Another strategy focuses on doping it with different cationic elements like Mn, Co, Ni, V,[Reference Omenya, Chernova, Zhang, Fang, Huang, Cohen, Dobrzynski, Senanayake, Xu and Whittingham14, Reference Hu, Chen, Shih, Wu, Su, Chian, Huang, Hsieh, Chang, Shew and Lee15] among others. Whittingham and co-workers[Reference Omenya, Chernova, Zhang, Fang, Huang, Cohen, Dobrzynski, Senanayake, Xu and Whittingham14] have studied the effect of V-doping in LiFePO4 at different temperatures. The vanadium substitution on the iron site increases the rate of insertion and de-insertion of Li, the open-circuit voltage and the free energy of reaction. For to improve the intrinsic conductivity of LiFePO4 generally its particles are mixed with graphite or using ascorbic acid or citric acid in the synthesis as source of coal[Reference Chen and Whittingham8, Reference Jin and Gu10, Reference Chong, Xun, Song, Ridgway, Liu and Battaglia16, Reference Wang, Liu, Hicks-Garner, Sherman, Soukiazian, Verbrugge, Tataria, Musser and Finamore17] or adding graphite nanotubes; and also have been used composites formed with Li4P2O7 or CuO, TiO2, ZnO.[Reference Ji, Zhou, Tong, Wang, Zhu, Chen and Yuan18–Reference Song, Chen, Wu, Fu, Zhou, Chen and Wang20] Another way to increase the yield of the cathode is improving the capacity rate using nanoparticles of active material because with small particles increase the Li-ion diffusion during the charge/discharge process and decrease the internal impedance of the battery.
In this work, we showed the yttrium doping effect on nanoparticles of LiFePO4 synthesized by a hydrothermal method on the electrochemical behavior of Li-ion battery.
Experimental
The synthesis of LiFeYxPO4 (0.01%≤ x ≤ 5% w/w) nanoparticles was carried out using a Parr bomb where a hydrothermal reaction between FeSO4·7H2O, H3PO4, LiOH·H2O occur according to the methodology proposed by Wang et al.[Reference Wang, Zhu, Wang and Wang11] All chemical reagents were analytical degree. Firstly, 15 mmol LiOH·H2O was dissolved in 15 mL EG (ethylene glycol) under stirring at 70 °C, followed by adding 5.5 mmol H3PO4 in 10 mL EG. Secondly, 5 mmol FeSO4·7H2O was dissolved in 2.5 mL water and 12.5 mL EG. Then FeSO4 solution was added drop wise into a LiOH–H3PO4 mixed solution. After stirring for 30 min, the mixture was transferred into a 50 mL Teflon-lined stainless steel autoclave, followed by heat treatment at 180 °C for 10 h. The precursor precipitate was washed with water and ethanol, dried at 70 °C. The same working protocol was applied to obtain the doped species [LiFe1−xYxPO4 doped (d-LFP)], but in the in this case, the precursor's mixture contained the following quantity of Y2O3: 0.01%; 0.1%; 0.2%; 1.0%; 2.0%; 5.0% y 10.0% w/w of the Li: Fe: P precursors total mass. The cathode was formed using 20% of active material (LPF or d-LPF), 70% of super P carbon (conductivity additive) and 10% of polyvinylidene fluoride (PVDF; bonding additive) for a total mass of 1 g. PVDF was prepared using NMP (N-methyl 2-pyrrolidone) vigorously stirred to total dissolution at 80 °C. Then, the super P carbon mixed with active material previously homogenized in an agatha mortar, were added keeping the agitation for 24 h. Then the mix was placed on a GDL 24 BA substrate provided by ion power. Using the technique of Dr. Blade, it was possible to create a thin layer, which can be used as a cathode. Finally, it is cut in a circular form previously dried in vacuum during 12 h to 120 °C using a drying oven.
The structural characterization of the different active materials was carried out at room temperature (RT) using an x-ray diffractometer with Cu Kα radiation. Scanning electron microscopy–energy dispersive x-ray spectroscopy (SEM–EDX) analyses were performed using a Zeiss MA 3 nm scanning electron microscope.
The electrochemical measurements were obtained using charge/discharge curves, which were carried out with a BST8 eight-channel battery analyzer (MTI). For this analysis, 2032 coin cells were used. In every analyzed case, the applied current kept constant at 0.026 mA equivalent to a 20 C rate capacity. A lithium foil was used as counter electrode and as a reference electrode. All the cells have been assembled within a gant-chamber with Ar containing <10% of humidity. Besides, the cells were sealed off using a mechanical press (MTI) and tested before removing them from the chamber.
Results
Characterization analyses
LiFePO4 crystalline phase was identified through x-ray diffraction (XRD) in both undoped (LFP) and doped samples (d-LFP).
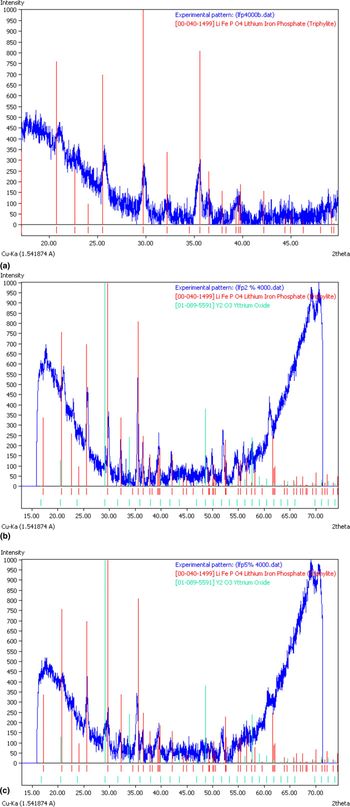
All diffraction patterns show significant background noise. However, it shows the characteristic signals corresponding to the planes of an ordered olivine structure indexed by orthorhomic Pnmb. Figure 1(a) shows the diffractogram pattern obtained for the undoped sample (LFP).
The figures show the diffractogram pattern, XRD, obtained for the sample (LFP). (a) Sample undoped, (b) sample doped with of 2% m/m of yttrium oxide, and (c) sample doped with 5% m/m of yttrium oxide.

The diffraction results of compounds doped (d-LFP) with yttrium 2 and 5 wt.% are shown on Figs. 1(b)and 1(c). It can be observed the typical intense signals of LFP and Yttrium oxide. However, these final signals are not possible to observe when the quantities of yttrium oxide in the initial reaction mixture are less to 0.5% w/w. From these results it can see that both doped and undoped species have the same original orthorhombic structure, because the doping Y3+ ions do not change the LiFePO4 crystalline structure. It is possible that the Y3+ ions can replace the Fe3+ ions in the LiFePO4 crystal lattice. This phenomena was observed by Shengkui et al.[Reference Shengkui, Letong, Jiqiong, Yanwei, Jian, Jiequn and Yanhong13] On the other hand, in every case, the diffraction patterns show intense signals, which are attached to a high crystallinity degree of synthetized materials.
Morphological results
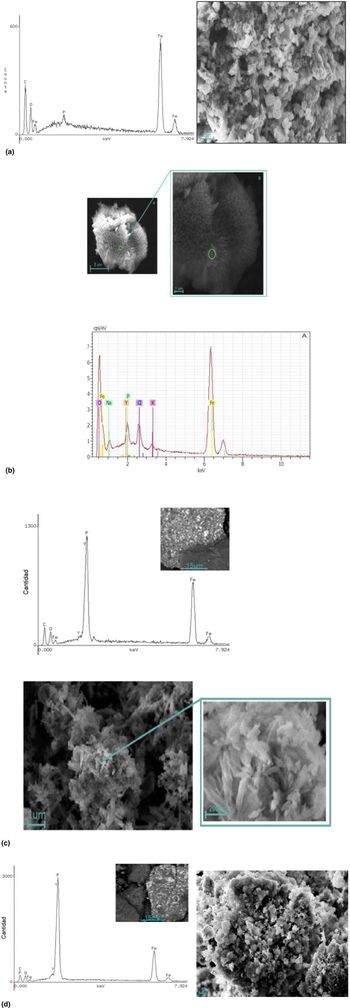
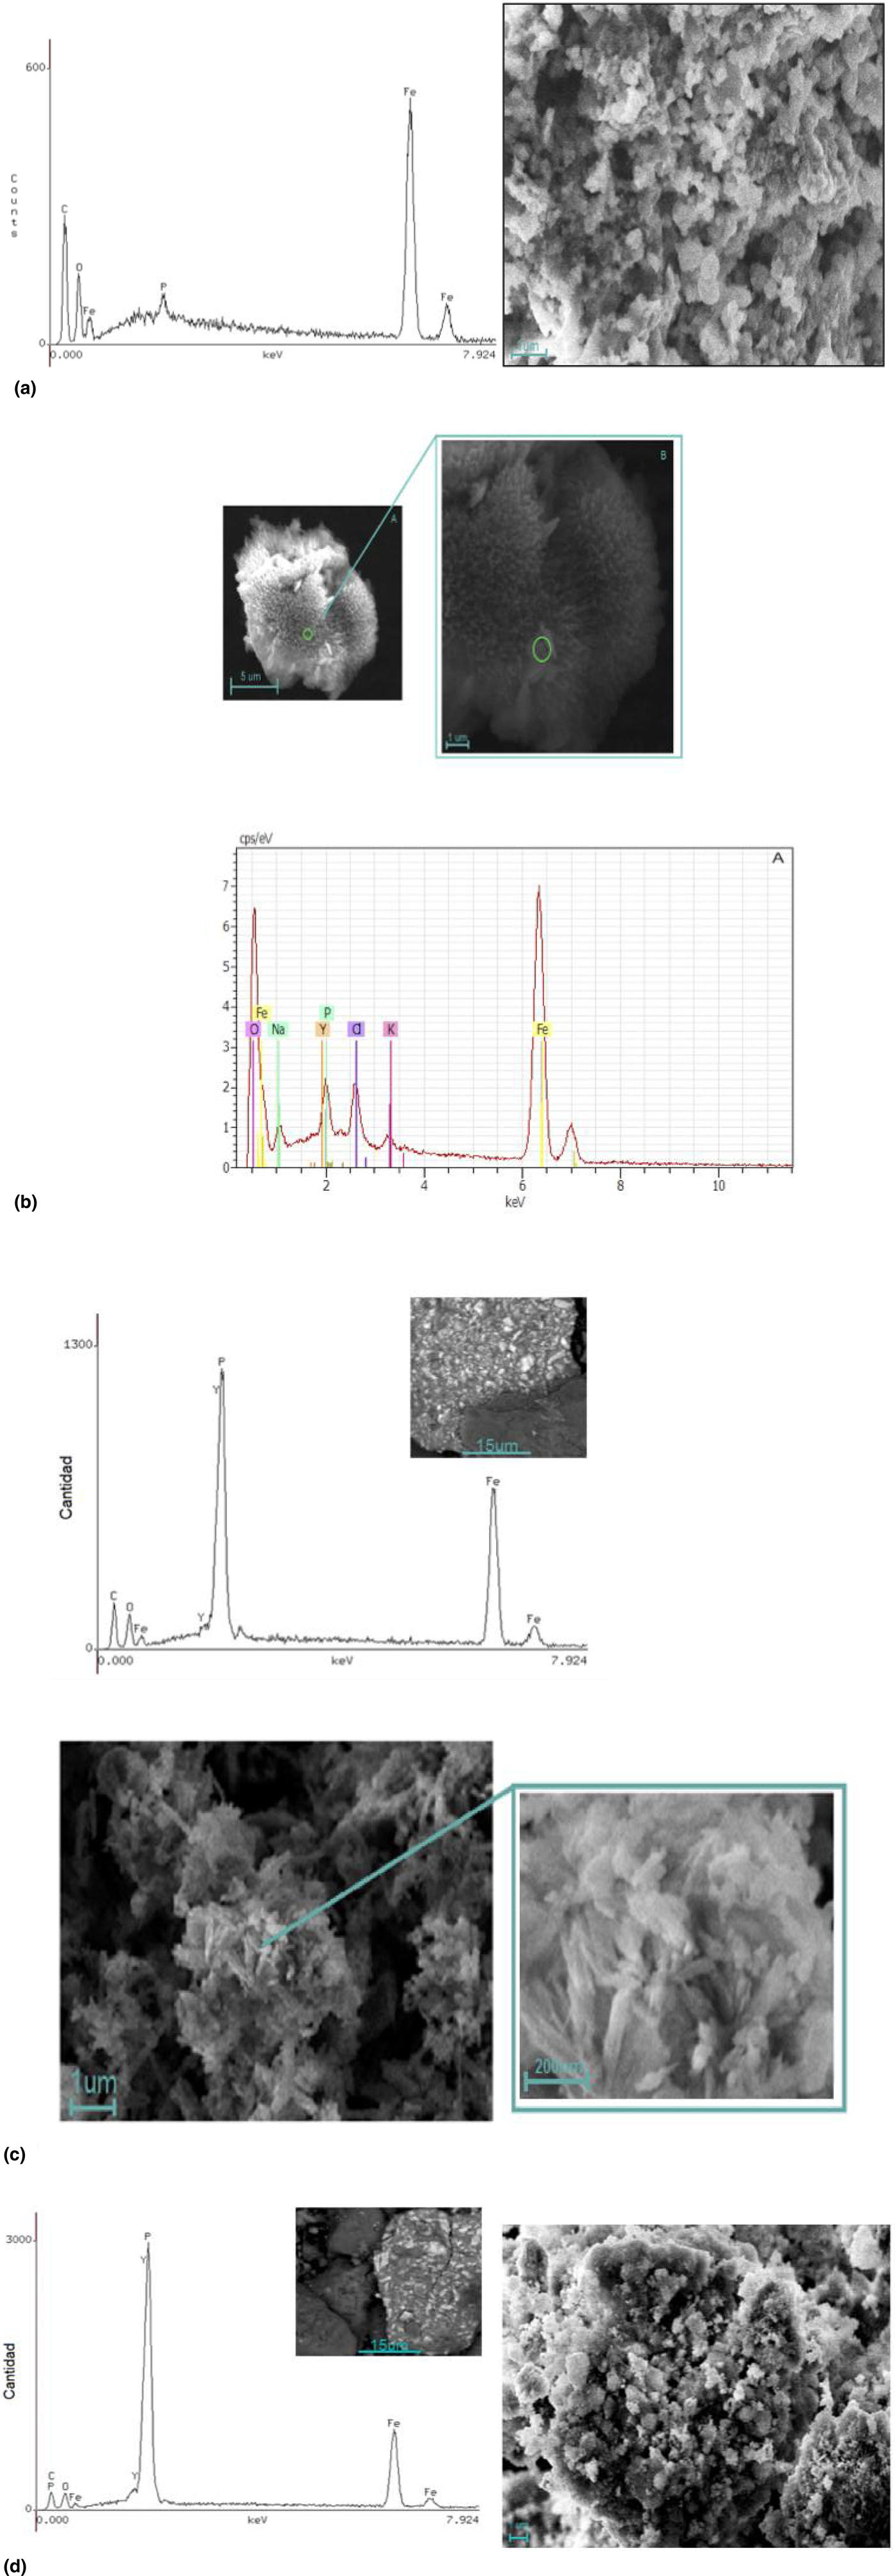
The morphology of the undoped LiFePO4 sample is shown in Fig. 2(a). It can see the presence of semispherical agglomerated particles with irregular sizes. This shape can be changed with the incorporation of increasing amounts of yttrium. In fact, when the Y-doping is 0.01%, the morphology changes from a semispherical form to a new type of broccoli form, which is much more organized and more crystalline [see Fig. 2(b)]. EDX analysis of this sample confirms the presence of yttrium in the particles. Figures. 2(c) and 2(d) show the morphology with its respective EDX, in the case of yttrium oxide doping at 1% and 5%, respectively. It can see the presence of two different types of particles: rectangular particles covered with particles presenting a kind of filamentous growth. Both morphologies seem a sort of coral aggregate. From the EDX analysis for this sample, it is possible to notice a significant increase of yttrium, which can suggest that a type of particles correspond to yttrium oxide.
Figure 2 represents the morphological results obtained by SEM together with the results of energy dispersive x-ray spectroscopy, EDX for samples. (a) Sample undoped, (b) sample doped with 0.01% m/m of yttrium oxide, (c) sample doped with 1% m/m of yttrium oxide, and (d) sample doped with 5% m/m of yttrium oxide.
Electrochemical results
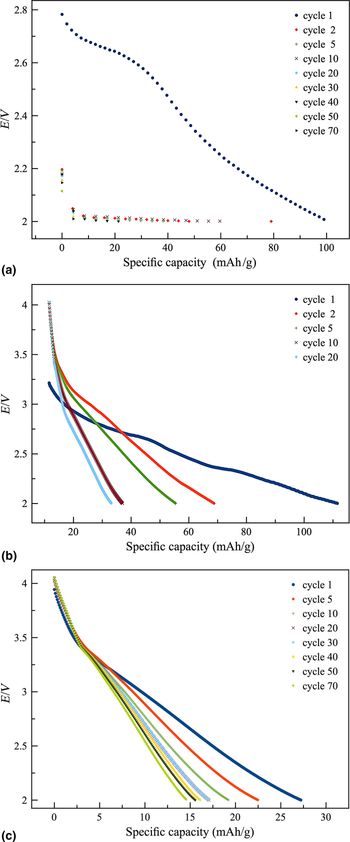
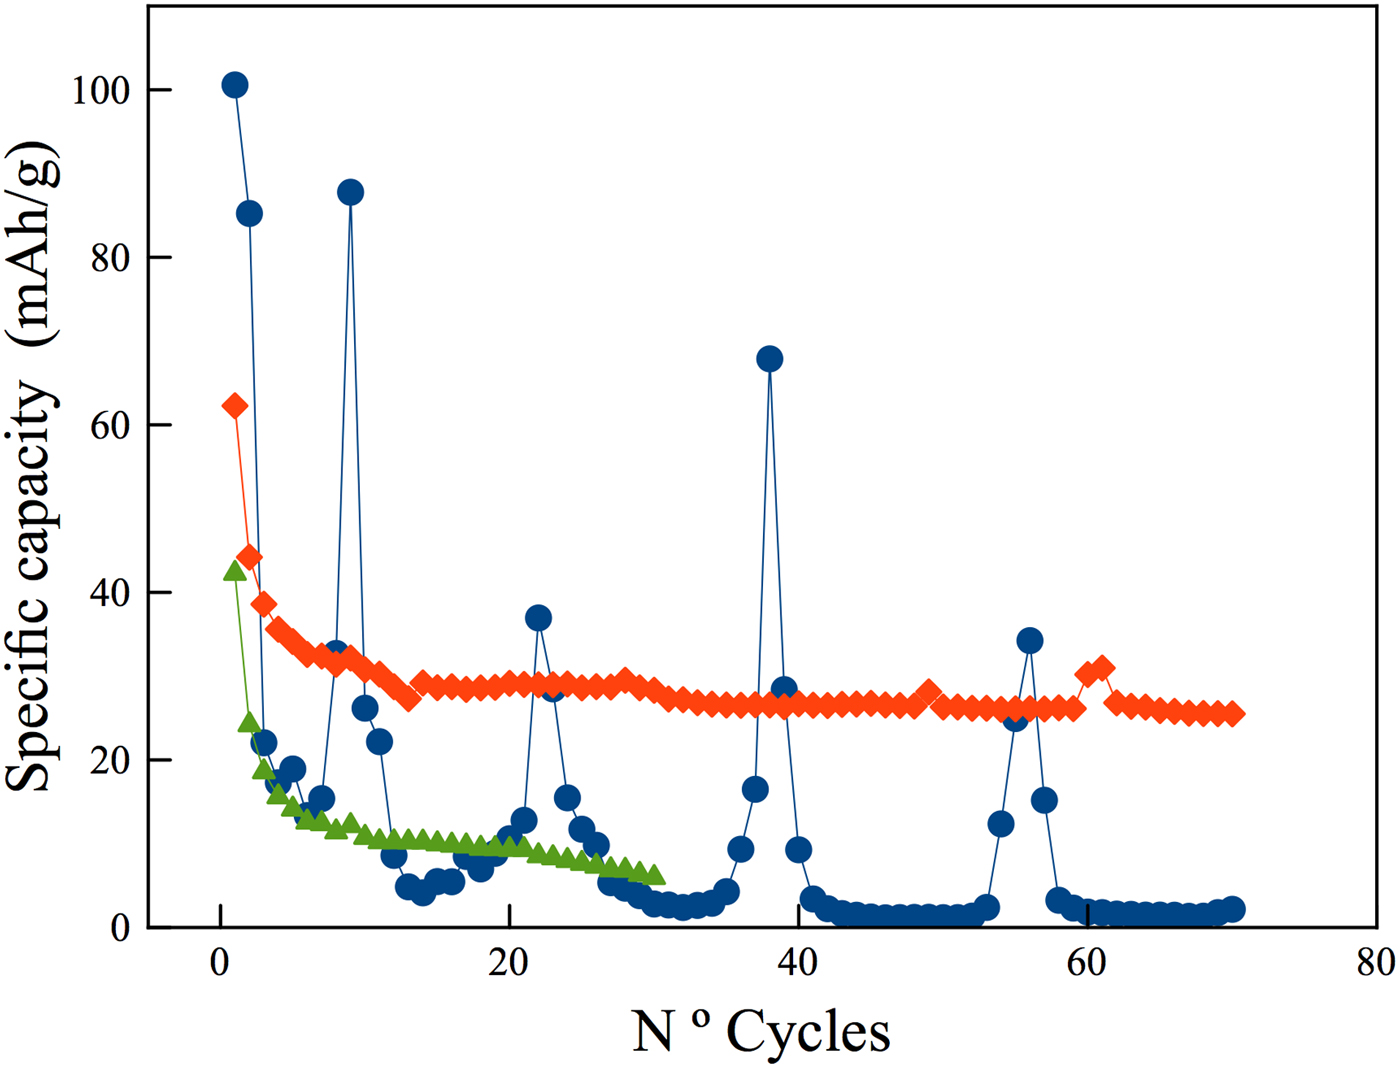
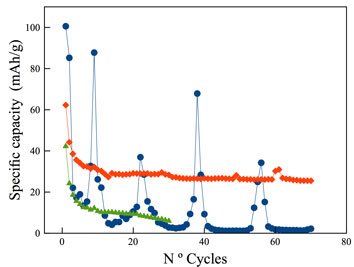
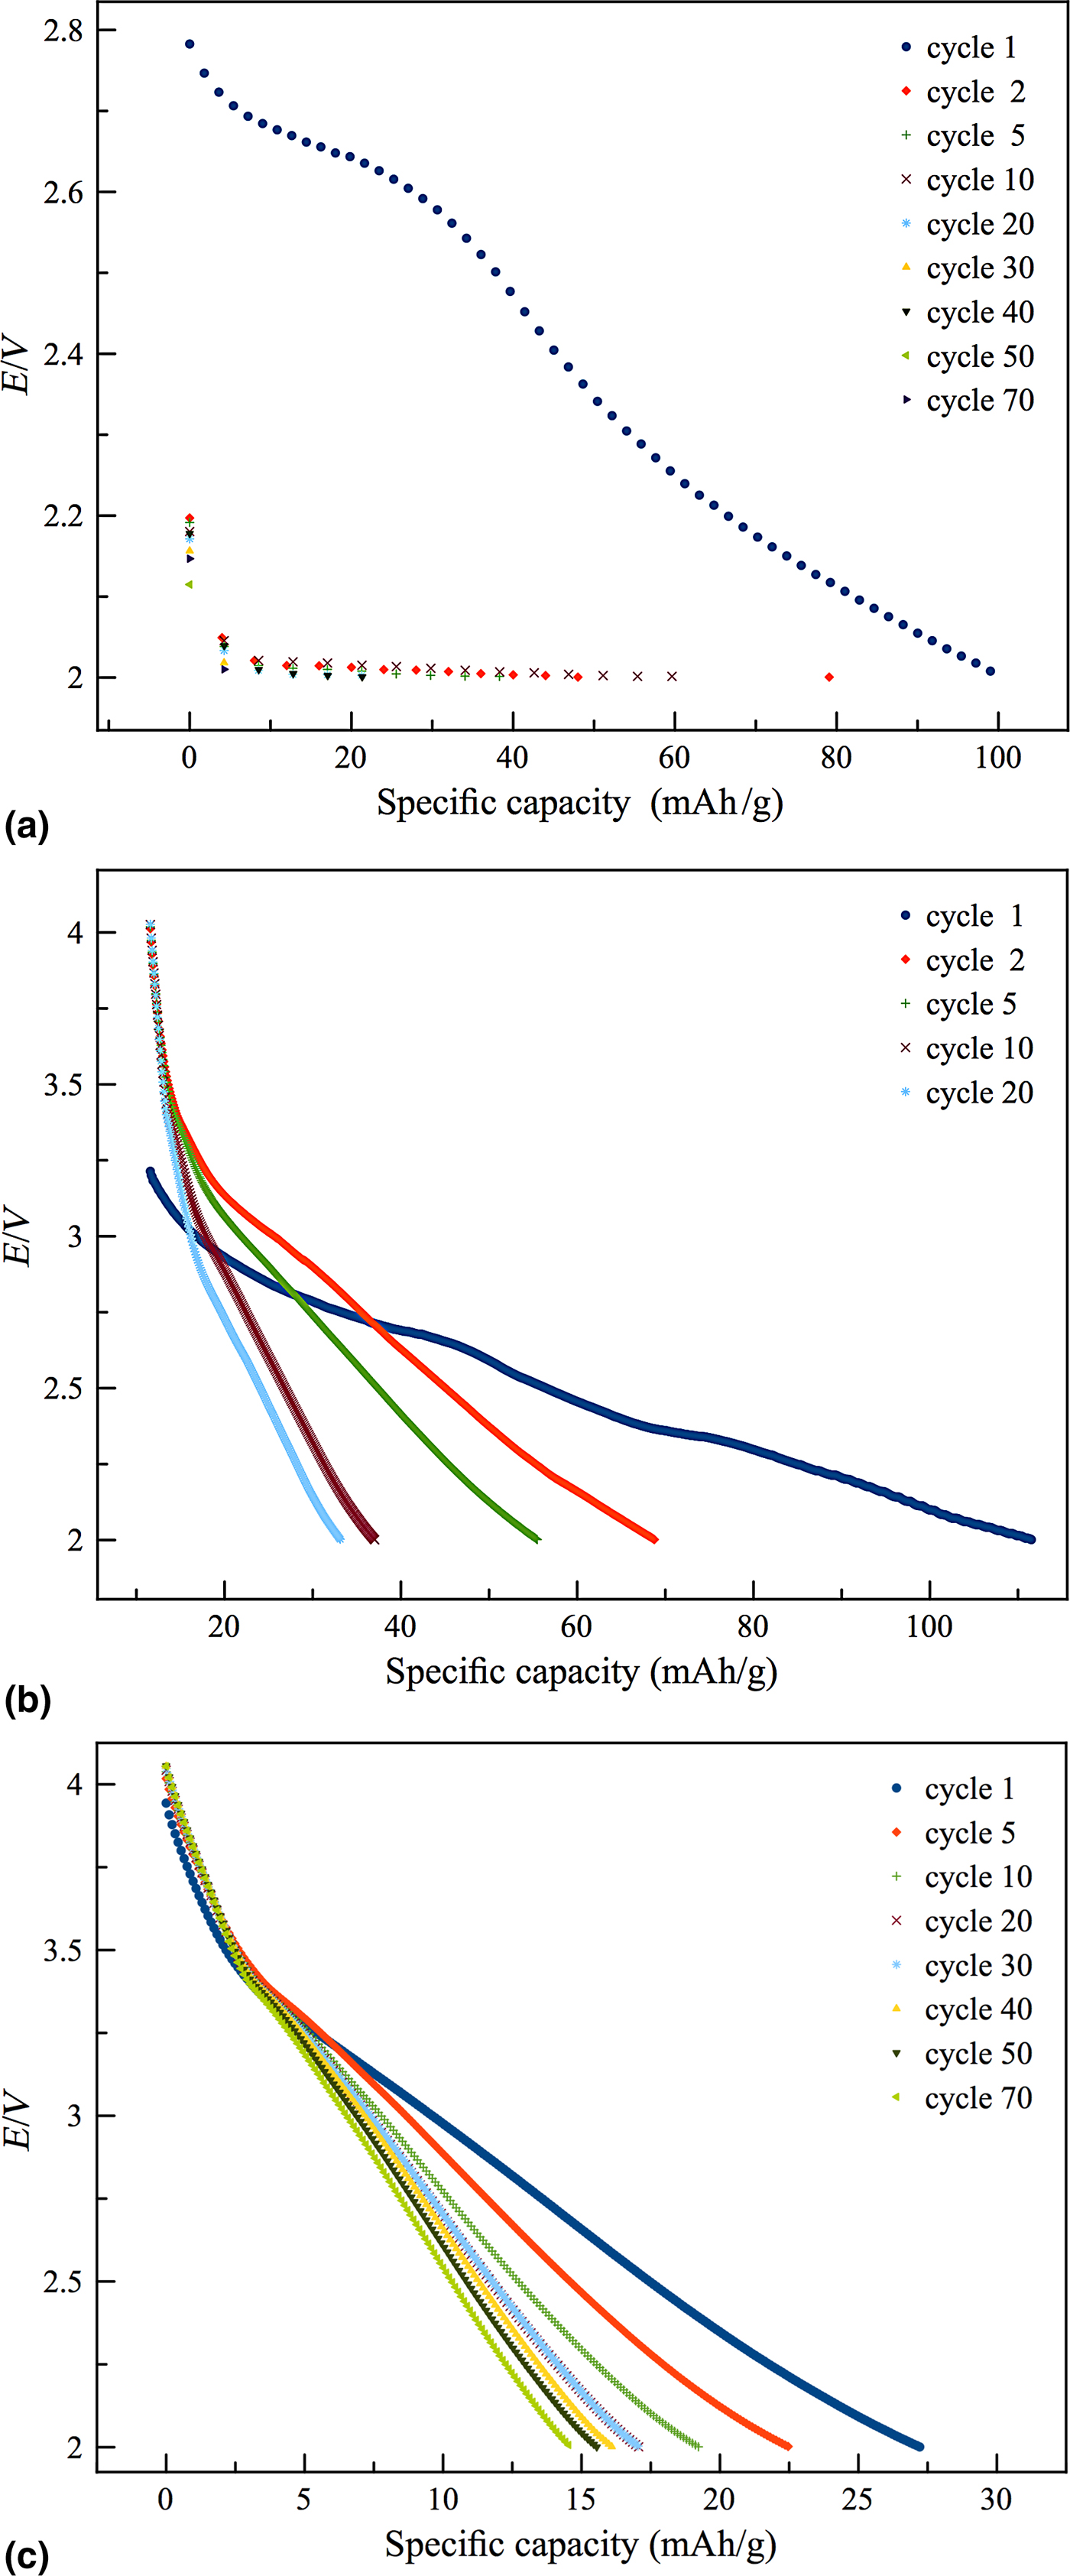
The discharge profiles of LiFePO4 cathode materials at 20 C rate at RT in the voltage range of 2.0–4.2 V are shown in Fig. 3. Figure 3(a) shows the discharge profiles of 70 cycles instead of only the first one, since lithium-ion cells generally have different starting voltage during the first cycles. In fact, for the first cycle the starting voltage is 2.8 V close to open circuit voltage, while in the others cycles, the constant starting voltage remains at 2.2 V. After the second cycle the discharge capacity drops up to 80 mAh/g and so on. It can observe that the capacity decreases until the cycle 10 then increase reaching a value of 60 mAh/g. The capacity loss after 20 cycles is about 80% and after 30 cycles of 90%. However, it is possible to observe a particular increase in the specific capacity value with the number of cycles charge/discharge as is showing in Fig. 4 (blue curve). This behavior can be related with a significant memory effect as it was observed by Sasaki et al.[Reference Sasaki, Ukyo and Novák21] The memory effect is manifested in a reduced working voltage, which is observed in the discharge curves when the batteries undergo repeated shallow-depth discharge for a large number of cycles, the discharge voltage seems to memorize the depth of discharge of the previous cycling. This memory effect that occurs in batteries used in automobiles[Reference Sasaki, Ukyo and Novák21] leads to a reduction of the cell capacity at a fixed cut-off voltage and/or to a wrong estimation of the cell state of charge (SOC). Some studies using Li3V2(PO4)3 doped with Y3+ and Li3V2(PO4)3 undoped, have shown the stabilizing effect of yttrium.[Reference Shengkui, Letong, Jiqiong, Yanwei, Jian, Jiequn and Yanhong13]
Figure 3 shows the discharge profiles of LiFePO4 cathode materials at 20 C rate at RT in the voltage range of 2.0–4.2 V. (a) Discharge profiles of 70 cycles sample undoped, (b) discharge profiles of 20 cycles sample doped with 0.01% m/m of yttrium oxide, and (c) discharge profiles of 70 cycles sample doped with 0.5% m/m of yttrium oxide.
Electrochemical behavior of specific capacity versus the number of cycles for samples: (line blue) sample undoped, (line orange) sample doped with 0.10% m/m of yttrium oxide, and (line green) sample doped with 5% m/m of yttrium oxide.
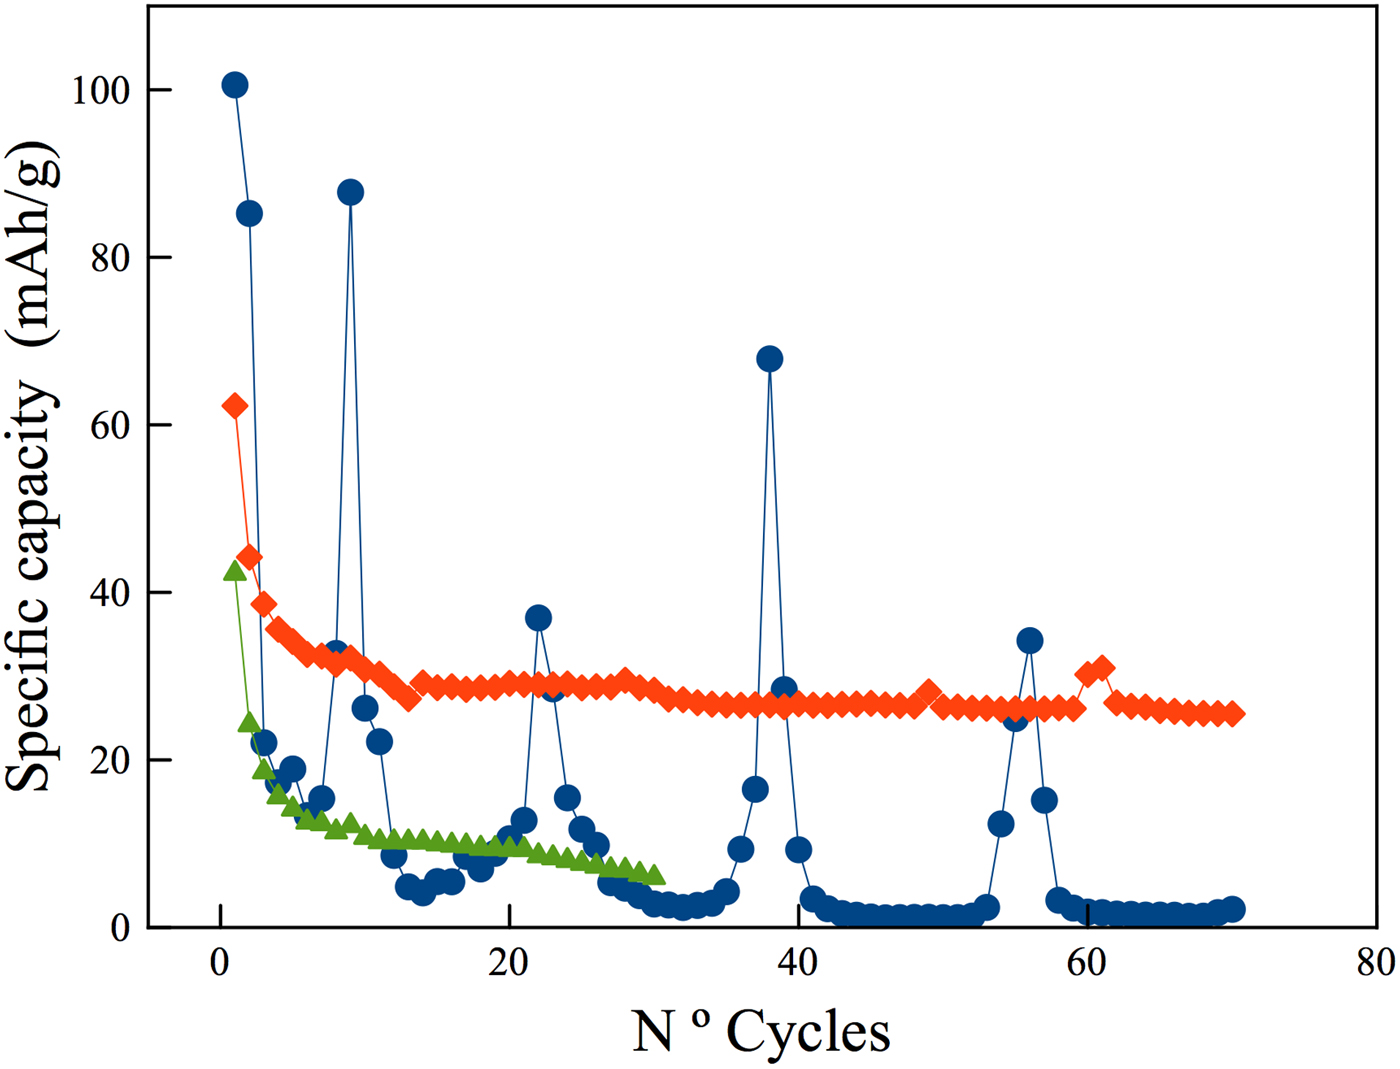
Figure 3(b) shows the effect of 0.01% of yttrium on the LiFePO4 electrochemical behavior. The open-circuit potential increases to 3.25 V indicating a better electrode stability. On the other hand, the electrode capacity increase from 100 to 110.58 mAh/g attaining only 20 cycles and increasing from 2.2 to 4 V the discharge potential. A plateau is observed concerning the behavior of the specific capacity with the cycles number (Fig. 4) showing the effect of Y-doping to stabilized the specific capacity of the battery. The lithium insertion–extraction times increase giving a better cyclic stability behavior. Regarding the capacity values obtained at short discharge times using doped compounds, it is clear the effect of yttrium doping. However, the capacity loss increases with the cyclability: 36.9%, 48%, 66.5%, and 69.9% for 2, 5, 10, and 20 cycles, respectively. A same behavior was observed for LiFe1−xYxPO4 with x = 0.5% and 1%. However in these cases, the discharge capacity significantly decreases. For example, in the first cycle, the doped phosphate sample with x = 0.5, the maximum capacity obtained was 27.5 mAh/g. It was also observed, that the loss of capacity is much lower than the precedent samples: 17% for the cycle number 5–46% for the cycle 70. In the case of x = 0.01%, the discharge potential begins up to 4 V.
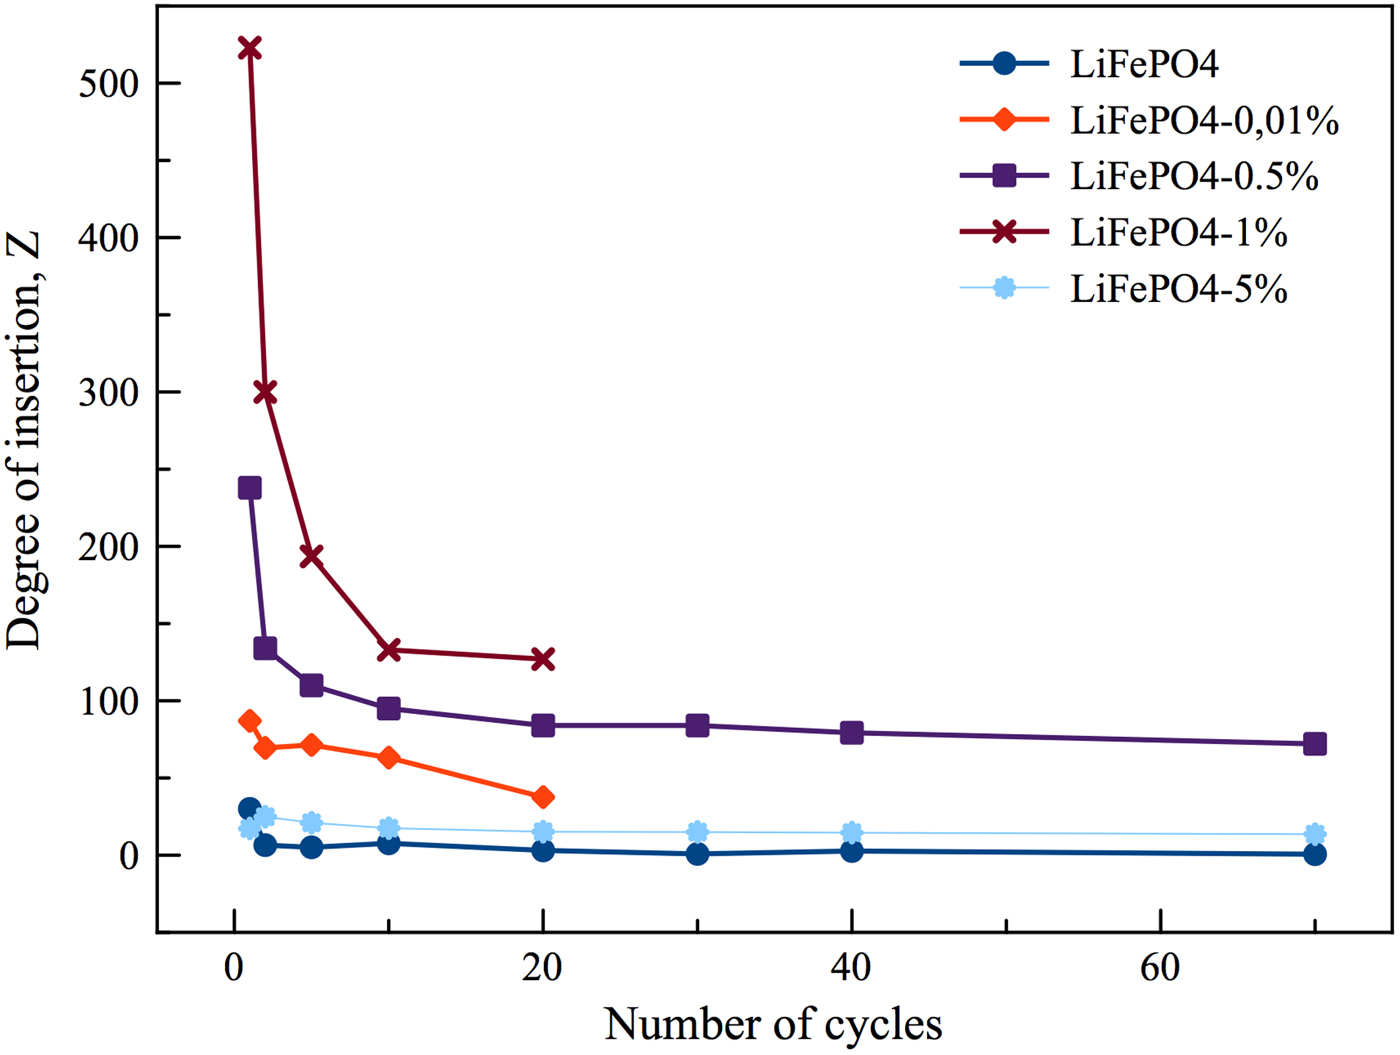
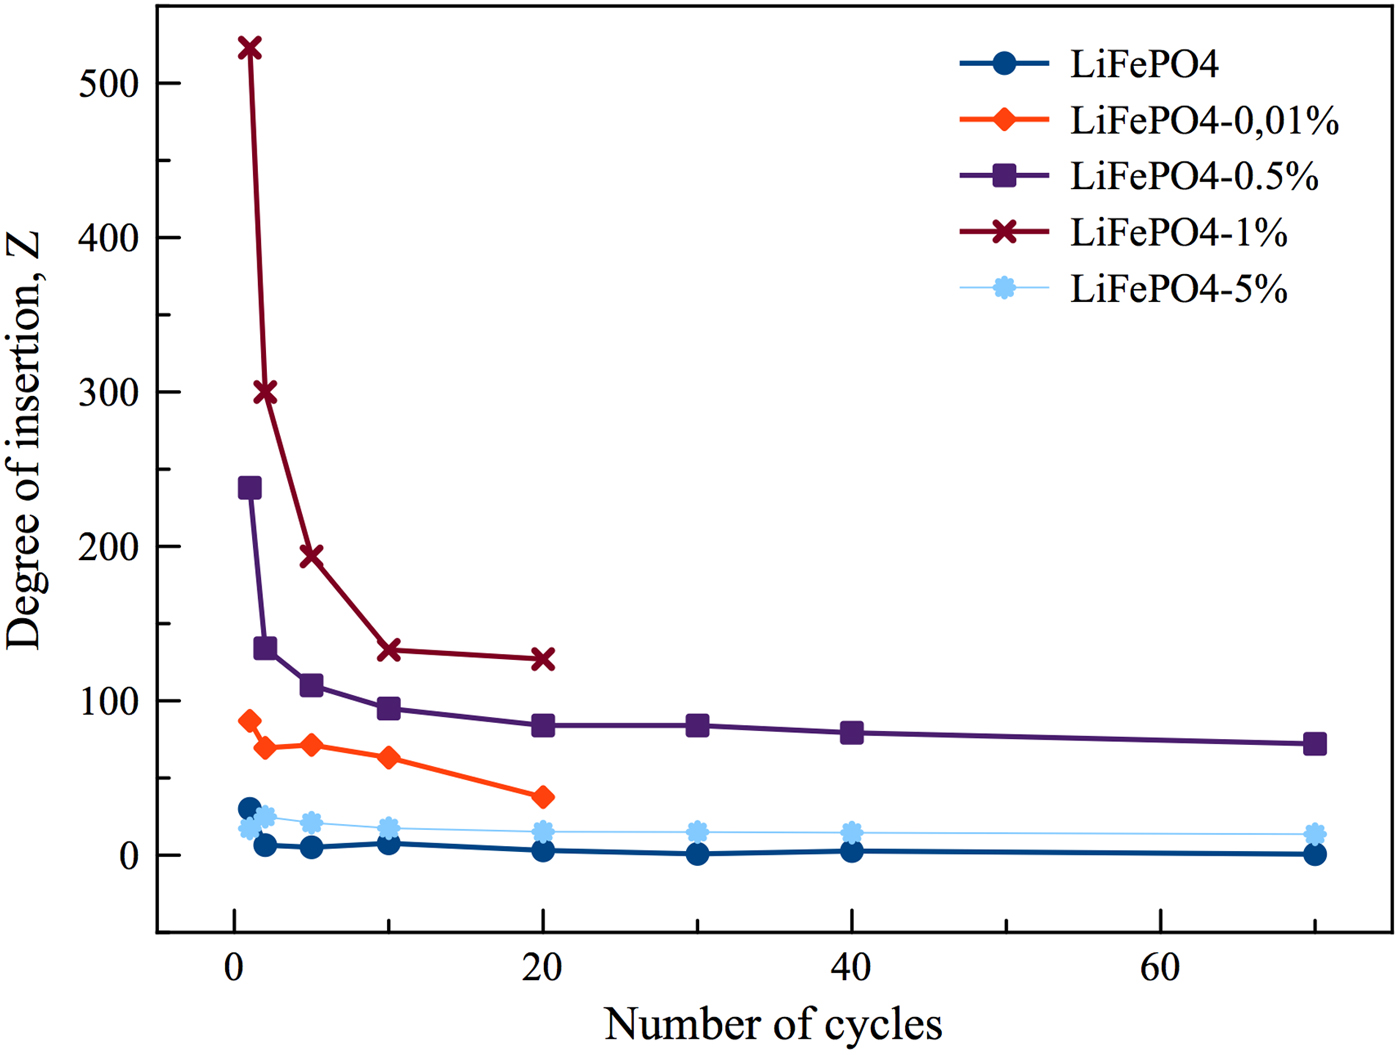
The Li+ insertion degree (z) for each olivine composition was evaluated using expression z(Li) = (I × t × M)/(F × m), where I is the applied current at the time of discharge cycle, M the cathode molar mass, F the Faraday constant = 96,500 C/mol, and m being the active material (in g). The results are assembled in Fig. 5. It can be seen that the Li+ insertion degree in the olivine electrode increases with the doping degree of yttrium in LiFe1−xYxPO4 (x = 1 > 0.5 > 0.01%) and decrease with the cycle's number. It can be seen that the degree of insertion of Li ion decreases markedly from x = 1% to 0.5% and then reaches a plateau. In the case of the samples doped with x = 5%, their behavior is close to that observed with the phosphate without doping. The degree of insertion of lithium ions follows the sequence with the degree of doping x = 1% > 0.5% > 0.01 > 5%, indicating that there is an optimal amount of Y3+ that replaces Fe3+ in the structure, which is in our case x = 1%. It is likely for higher amounts of yttrium that it forms composites or it is interstitially located in the structure.
Graph about the variation of the degree of insertion of lithium as a function of the number of cycles for different samples: (line blue) sample undoped; (line orange) sample doped with 0.01% m/m of yttrium oxide; (line purple) sample doped with 0.5% m/m of yttrium oxide (line brown) sample doped with 1% m/m of yttrium oxide and (line sky blue) sample doped with 5% m/m of yttrium oxide.
In order to elucidate the actual effect of doping, a more detailed manuscript is currently being developed, including Mössbauer spectroscopy for both the synthesized samples and those prepared as cathodic material (Supplementary materials).
Conclusions
LiFe1−xYxPO4 cathode materials were successfully synthesized by hydrothermal method. The XRD analysis showed that LiFeYxPO4 with x = 0.01, 0.5, 1, 5% has the same orthorhombic structure space group Pnmb as the undoped LiFePO4. The electrochemical results show the possibility of structural stability of doped cathode. The lithium insertion degree increases with the yttrium-doping concentration being the optimal value 1% offering favorable properties for Li-ion batteries.
Acknowledgment
The authors thank the support of Conicyt agency (Fondecyt 1131019 project).
Supplementary material
The supplementary material for this article can be found at https://doi.org/10.1557/mrc.2017.71