Is widespread government support for the elderly a relatively recent phenomenon? Some historians contend that before the twentieth century most old people in England who were not able to support themselves were helped by relatives or private charity rather than by public assistance. Townsend (Reference Townsend1981) asserted that the “structured dependency” of the elderly largely is a post-welfare state phenomenon, while Thane (Reference Thane and Jerome1983: 191) maintained that in Victorian England the aged turned to the Poor Law “only in the last resort” when they had no family to assist them or access to private charity. Other historians contend that a large share of the aged received communal assistance throughout the nineteenth century and even earlier. Thomson (Reference Thomson and Bonfield1986: 370) concluded that “during much of the nineteenth century a clear majority of all women aged 70 or more . . . were regular pensioners of the Poor Law” as were “slightly less than one-half of all men aged 70 or more, together with substantial minorities of both men and women in their sixties.”Footnote 1
The literature on the role played by public and private assistance for the aged poor in Victorian England and Wales has grown substantially in recent years. In particular, several papers have reported the number of aged persons living in workhouses and almshouses in localities throughout England, using data from census enumerators’ books. These studies, done at the county or Poor Law union level of aggregation, reveal both the important role played by workhouses in assisting the elderly and also the differences in the use of public and private institutional relief across regions, and even across Poor Law unions within regions.Footnote 2
This paper is a complement to the local studies. It examines the extent of public assistance for the elderly at a higher level of aggregation, using data at the registration division level reported by the Poor Law Board and its successor the Local Government Board (LGB). England was divided into ten registration divisions: London, the South East, South Midlands, East, South West, West Midlands, North Midlands, North West, Yorkshire, and North. Each division (except London) includes multiple counties and both urban and rural areas, although the extent of urbanization varied substantially across divisions.Footnote 3 The data used in this paper cannot discern differences in relief policy across counties (or Poor Law unions) within regions, but it does provide a broad picture of the Poor Law's role in assisting the elderly in late Victorian England. Many contemporary critics focused on differences in relief across very broad regions, and in particular maintained that there were substantial north-south variations in poor relief. The registration division data clearly reveal the extent of these regional differences and how they changed over time.
Neither the Poor Law Board nor the LGB collected statistics on the number of elderly persons in receipt of poor relief before 1890, but data on the number of aged paupers are available for several years between 1890 and 1906. In part one of this paper I use these data, along with published statistics on adult non-able-bodied paupers, to construct estimates of the number of aged persons receiving poor relief from 1861 to 1908, the year the Old Age Pension Act was adopted, for England as a whole and for each registration division. Old age pauperism rates differed substantially across registration divisions and in general were higher in the south than the north. Part two of the paper examines the causes of the north-south differential in old age pauperism rates.
The large number of elderly Poor Law recipients led parliament in 1908 to adopt the Old Age Pension Act. The paper concludes by comparing old age pensioners in 1912 with elderly poor relief recipients six years earlier. The number of pension recipients was substantially larger than the number of poor relief recipients in each registration division, which suggests that the pauperism estimates reported in the paper underestimate, perhaps by a substantial amount, the extent of poverty among the aged. In sum, government support for the elderly is not a post-welfare state phenomenon—many aged individuals required public assistance in the decades leading up to World War I despite increases in the average full-time earnings of prime age workers. The rising tide of Victorian economic growth did not raise old boats.
The Extent of Pauperism among the Aged, 1861–1908
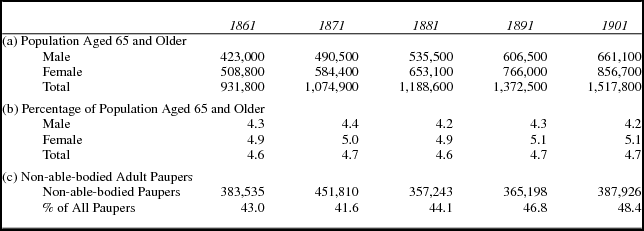
How many people survived to old age in Victorian England? Table 1 shows that in 1861 there were 931,800 persons aged 65 and over in England and Wales, representing 4.6 percent of the population. The number of aged persons increased to nearly 1.2 million in 1881 and more than 1.5 million in 1901. However, the share of the population aged 65 and older remained nearly constant over the four decades, at 4.6 to 4.7 percent. The number of persons aged 70 and older increased from 555,300 in 1861 to 888,100 in 1901; the share of the population 70 and older was 2.8 percent in 1861, 2.6 percent in 1881, and 2.7 percent in 1901. The share of women 65 or 70 and older exceeded that of men in each year.
Number of persons aged 65 and older: England and Wales, 1861–1901

Sources: Population data from Mitchell (Reference Mitchell1988: 15). Data on non-able-bodied paupers from Williams (Reference Williams1981: 204–5).
The life expectancy of the aged remained roughly constant during this period. A 65-year-old male in 1861 had, on average, an additional 10.7 years to live, while a 65-year-old female had an additional 11.6 years to live. Forty years later, in 1901, the life expectancy for a 65-year-old male was 10.6 years, while that for a female was 11.8 years.Footnote 4 While life expectancy of the aged did not change in late Victorian England, their health status might have. If the health of aged persons improved over time, they would have been able to continue working after age 65, and therefore would have been less likely to require public assistance. However, Riley (Reference Riley1997) concluded from an analysis of friendly society sickness benefit claims that the average member's sickness time increased in the last decades of the nineteenth century. Workers lived longer, but “they were sick more of the time” (ibid.: 153). This suggests that the ability of persons to continue working past age 65 or 70 declined after 1870, which increased the likelihood that they would be forced to turn to the Poor Law for assistance. Other historians have disputed both Riley's findings and his interpretation of the data. Macnicol (Reference Macnicol1998: 129–31) concluded that friendly societies’ boundaries between sickness and unemployment were blurred, and that the increased duration of sickness benefit claims “reflected shrinking labour market opportunities” for aged workers, and Harris et al. (Reference Harris2011) examined data from a different friendly society and “found little evidence” that aggregate sickness rates increased in the late nineteenth century. While there is no consensus regarding the trend in workers’ health, it should be kept in mind that the health status of the aged had an important effect on their use of the Poor Law.
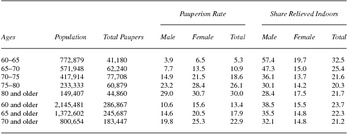
Official statistics on old age paupers were collected by the pauper censuses conducted in 1890, 1891–92, and 1906. The first official estimate of old age pauperism, “Burt's return,” gives the number of male and female paupers and the pauperism rate for five-year groupings from age 60 onward on August 1, 1890 (see table 2).Footnote 5 At that date there were more than 2.1 million persons aged 60 and older in England and Wales (7.4 percent of the population), and nearly 1.4 million persons 65 and older (4.7 percent). Table 2 shows that pauperism increased sharply with age, rising from 5.3 percent for individuals aged 60–65 to 10.9 percent for those 65–70, 18.6 percent for those 70–75, and 30.0 percent for those 80 and older. Overall, 17.9 percent of persons aged 65 and older, and 22.9 percent of persons 70 and older received poor relief on August 1, 1890. For each age group, pauperism rates were higher for females than for males; although a larger share of male paupers were relieved in workhouses.
Old age pauperism, August 1, 1890 (Burt's return): England and Wales

Source: Return . . . of Paupers over Sixty (P.P. 1890–1, LXVIII: 566–67).
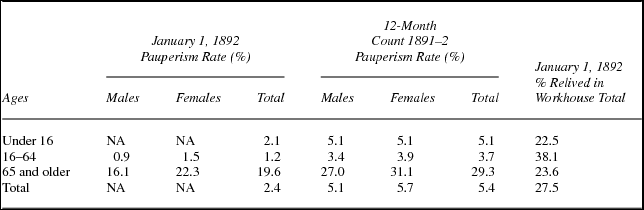
The data in table 2, based on a one-day count of the number of paupers, substantially understates the number of old people who received relief at some point over a 12-month period. The LGB constructed a 12-month count of the number of paupers from March 1891 to March 1892 for three age groups: those under 16, 16–64, and 65 and older.Footnote 6 Table 3a shows a summary of “Ritchie's return,” and compares pauperism rates on January 1, 1892 with rates constructed from the 12-month count. Two results stand out. First, the pauperism rate for persons 65 and older was far greater than the overall pauperism rate or the rate for children or prime age adults. On January 1, 1892, 19.6 percent of persons 65 and older were in receipt of poor relief, as compared to 1.2 percent of persons aged 16–64. Second, the share of persons 65 and older who received relief during the 12-month period was 29.3 percent, an amount 50 percent greater than the share relieved on January 1. Many aged paupers required assistance only for part of the year.
Ritchie's return for 1891–92: England and Wales

Source: Return . . . of Paupers over Sixty-Five (P.P. 1892, LXVIII: 621–31).
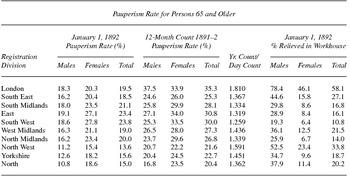
Table 3b reports pauperism rates for persons 65 and older in 1891–92 for each English registration division. The pauperism rate on January 1, 1892 varied from a low of 13.6 percent in the North West to a high of 23.8 percent in the South West; the 12-month pauperism rate ranged from 20.4 percent in the North to 35.3 percent in London. The three northern divisions—North West, Yorkshire, and North—had the lowest pauperism rates by either measure, while the highest rates were in the South West, East, South Midlands, and London.
Ritchie's return for 1891–92: English registration divisions

Source: Return . . . of Paupers over Sixty-Five (P.P. 1892, LXVIII: 621–31).
Table 3 also reports the share of paupers 65 and older relieved in workhouses. The use of the workhouse varied substantially across registration divisions, and was closely related to the extent of urbanization. The share relieved in workhouses was far higher in London than elsewhere, followed by the industrial North West, and was lowest in the more rural South West, North Midlands, East, and South Midlands. For each registration division, the share of old men relieved in workhouses greatly exceeded the share of women relieved indoors.
Some of those included in the 12-month count reported in table 3 received relief for short periods of time.Footnote 7 Whether or not they should be counted when constructing pauperism rates depends on the question that one is addressing. The day count gives a good idea of the number of “permanent” paupers—those who received relief week in and week out. The 12-month count includes those old persons who were living right at the margin. They were able to subsist on their own much of the time, but needed to apply for relief now and then, for instance in winter when they were less likely to find employment. Booth (Reference Booth1899: 213–14) argued that the day count “disguises the extent of pauperisation,” and added that the “wide margin” between the two counts “gives some . . . idea of the mass of poverty which lies continually on the verge of pauperism.” More recently MacKinnon (Reference MacKinnon1984: 122) concluded that “occasional relief could play as important a part in assisting the destitute in a time of crisis as did permanent relief.”
Another census of paupers was conducted on March 31, 1906, the eve of the adoption of the Old Age Pension Act. Table 4 shows the pauperism rates for persons 65 and older for each English registration division on that date. The pauperism rate for England and Wales was 19.9 percent, virtually identical to that for January 1, 1892. Pauperism rates were lowest in the three northern divisions, and highest in the East and London. However, the size of the north/south differential declined from 1892 to 1906, as pauperism rates fell in all southern divisions outside of London, and increased in the Midlands and the three northern divisions. As in 1892, a larger share of old women than old men received poor relief.
Pauper census of March 31, 1906

Source: Parliamentary Papers, Royal Commission on the Poor Laws and Relief of Distress, Appendix Vol. XXV, Statistical Memoranda (1910, LIII), 176–93.
From 1857 to 1912, the Poor Law Board/LGB annually reported statistics on the number of persons receiving poor relief on two days a year: January 1 and July 1. The categories included in the annual returns are, for both indoor and outdoor paupers, adult able-bodied males and females and their children, and non-able-bodied adult males, females, and children, including orphans. Statistics on the number of aged paupers were not reported. However, Booth (Reference Booth1899) determined that is was possible to construct estimates of the number of old age paupers using the published statistics on non-able-bodied paupers. Using the data from Burt's and Richie's returns, he calculated that in 1890–92 75 percent of non-able-bodied paupers were aged 65 or older. He constructed three estimates of the number of paupers aged 65 and older from 1851 to 1891. The first assumed that the ratio of aged paupers to non-able-bodied paupers remained constant at the ratio for 1890–92 (0.75) from the 1850s to 1891.Footnote 8 The second estimate assumed that the number of non-able-bodied paupers aged 16–65 decreased “proportionately to the able-bodied of same ages” (ibid.: 218–19). Finally, the third estimate calculated the number of paupers 65 and older as the mean of the number obtained from the first and second estimates. Booth's second estimate yielded a ratio of paupers 65 and older to non-able-bodied paupers that declined from 0.75 in 1891 to 0.64 in 1861; the third or “mean” estimate yielded a ratio that declined from 0.75 in 1891 to 0.69 in 1861.
More recently, MacKinnon (Reference MacKinnon1984, Reference MacKinnon1988) also maintained that it was possible to estimate the number of old age paupers using data on non-able-bodied paupers. After comparing the number of aged persons receiving relief with the number of non-able-bodied paupers in 1890, 1899, 1900, and 1906, she concluded that “not-able-bodied and old-age pauperism can be used as interchangeable terms. . . . The ratio of paupers over sixty, sixty-five, or seventy to [all] not-able-bodied paupers . . . was nearly constant between 1890 and 1906” (1988: 9). Moreover, “unless there was a substantial (unrecorded) shift in the way the aged were classified before 1906, it seems reasonable” to assume that these ratios held back to 1860 (1984: 103, 105).
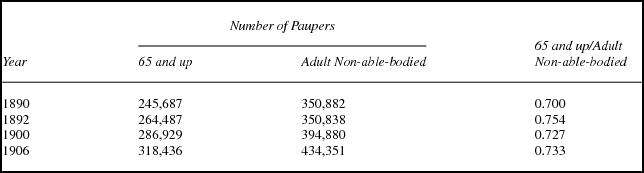
I use the technique employed by Booth and MacKinnon to estimate the annual number of paupers 65 and older from 1861 to 1908. Panel (c) of table 1 shows the number of adult non-able-bodied paupers in England and Wales from 1861 to 1901. Table 5 calculates the ratio of paupers aged 65 and older to adult non-able-bodied paupers in England and Wales for 1890, 1892, 1900, and 1906. The ratio ranged from 0.700 in 1890 to 0.754 in 1892. I use these ratios to construct two estimates of the number of paupers aged 65 and older from 1861 to 1908. The first is obtained by multiplying the number of non-able-bodied paupers on January 1 of each year by 0.725. The second estimate assumes that the ratio of 0.725 holds for 1881–1908, then declines by 0.0075 each year from 1881 to 1871, when it is equal to 0.65, and then remains equal to 0.65 for 1861–71. This estimate represents a compromise between the methods suggested by Booth and MacKinnon. It takes account of the changes that occurred in the makeup of the pauper host in the 1870s as a result of the Crusade Against Outrelief, but assumes that the ratio of aged paupers to non-able-bodied paupers remained constant during the period after the crusade and in the decade preceding it. I prefer this estimate, and report results obtained from it in tables 6 and 8.
Ratio of paupers 65 and older to adult non-able-bodied paupers, 1890–1906

Sources: Data for 1890 from Booth (Reference Booth1899: 217). Data for 1892 from Parliamentary Papers, Return . . . of Paupers over Sixty-Five (1892, LXVIII), 621–31. Data for 1900 and 1906 from MacKinnon (Reference MacKinnon1988: 11).
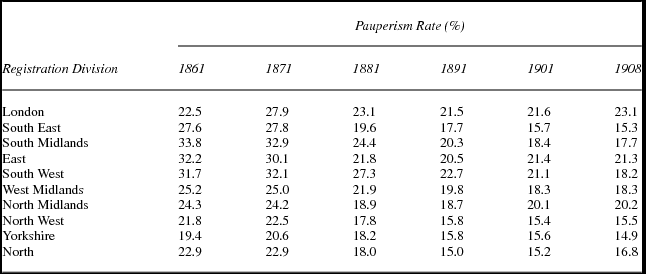
Pauperism rates for persons 65 and older, day count

Sources: Data on the annual number of non-able-bodied paupers for each registration division from the annual Reports of the Poor Law Board (for 1861) and the Local Government Board (for 1871–1908).
Note: Estimated pauperism rates calculated using data on non-able-bodied paupers. See text for the method used to construct the estimates.
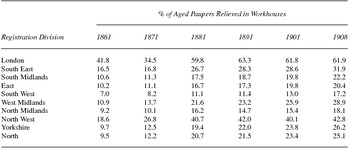
Share of paupers 65 and older relieved in workhouses

Sources: Data on the percentage of non-able-bodied paupers relieved in workhouses for each registration division from the annual Reports of the Poor Law Board (for 1861) and the Local Government Board (for 1871–1908).
Pauperism rates for persons 65 and older, year count

Sources: Data on the annual number of non-able-bodied paupers for each registration division from the annual Reports of the Poor Law Board (for 1861) and the Local Government Board (for 1871–1908).
Note: See text for the method used to construct 12-month pauperism estimates.
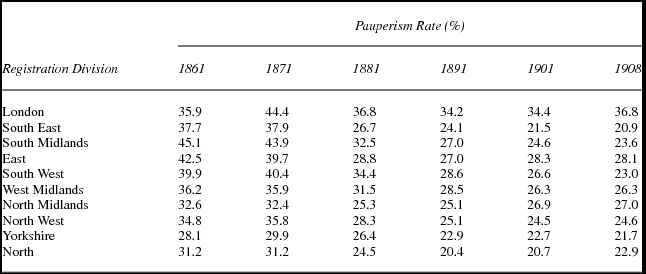
Table 6 shows the estimated pauperism rates for persons aged 65 and older for each English registration division for the census years 1861 to 1901 and 1908 based on the January day counts of non-able-bodied paupers. In 1861, the one-day pauperism rate for England as a whole was 25.4 percent. It exceeded 30 percent in three southern divisions and was below 25 percent in the three northern divisions. After remaining roughly constant from 1861 to 1871, the pauperism rate declined over the following two decades in all divisions. From 1891 to 1908, pauperism declined slightly in some divisions and increased slightly in others. Over the entire period from 1861 to 1908, old age pauperism declined in all divisions except London—the extent of the decline was smallest in the North Midlands and largest in the South Midlands, South West, and South East.
The largest decadal decline in pauperism, for all divisions except Yorkshire, occurred during the 1870s. The divisions most affected were the South Midlands, East, and South East, which witnessed declines in old age pauperism of 8.2 to 8.5 percentage points. The decline in pauperism during the 1870s becomes even larger if it is assumed that the ratio of old age paupers to non-able-bodied paupers remained constant at 0.725 throughout the decade. Under this assumption, the old age pauperism rate declined by between 12.3 percentage points in the South Midlands and 4.7 percentage points in Yorkshire.
Some of the decline in old age pauperism during the 1870s was a result of increases in workers’ wages, and thus in their ability to provide for old age, but a large part was caused by a major change in the administration of the Poor Law, known as the Crusade Against Outrelief. Encouraged by the LGB, in the early 1870s Poor Law unions throughout England curtailed outdoor relief for all types of paupers, but especially for able-bodied males and the elderly. The LGB, along with the newly formed Charity Organization Society, maintained that restricting outdoor relief and offering the poor assistance in workhouses would reduce the relief rolls, because many of those offered indoor relief would refuse it.
The effect of the crusade on the methods used to relieve elderly paupers can be seen in table 7, which shows the share of paupers 65 and older who were relieved in workhouses. This increased in all divisions in the 1870s, although the increase was especially pronounced in the more urban divisions. In London, the share relieved in workhouses increased from 34.5 percent in 1871 to 59.8 percent in 1881, while in the North West it increased from 26.8 percent in 1871 to 40.7 percent in 1881. In contrast, in the more rural East, South West, South Midlands, and North Midlands, fewer than 25 percent of aged paupers were relieved in workhouses throughout the period 1881–1908.
The pauperism rates in table 6 are based on one-day counts of persons on relief. Table 8 presents estimates of the share of persons 65 and older who received poor relief at some point during a year, calculated by multiplying the day-count by the ratio of the 12-month count to the day count for 1891–92 for each registration division (see table 3b). In constructing these estimates, I have assumed that the ratio remained constant from 1861 to 1908.Footnote 9 In 1871, on the eve of the Crusade Against Outrelief, more than one-third of persons 65 and older were in receipt of poor relief at some point during the year in seven registration divisions—the pauperism rate ranged from a high of 44.4 percent in London to a low of 29.9 percent in Yorkshire. In 1908, the share in receipt of poor relief ranged from 36.8 percent in London to 20.9 percent in the South East. For England as a whole, 37.6 percent of persons 65 and older received poor relief in 1871, falling to 25.7 percent in 1908.
The Poor Law was an institution meant exclusively for the working class—few if any members of the middle class applied for poor relief. If one assumes, following MacKinnon, that 70 percent of persons 65 and older were from the working class, in 1871 a majority of aged working-class individuals in southern England received poor relief, either in the form of a permanent pension or occasional assistance. Working-class pauperism rates were somewhat lower in the northern divisions, but exceeded 40 percent throughout England. Pauperism rates declined thereafter, but remained surprisingly high up to the adoption of the Old Age Pension Act, when more than one-third of working-class persons 65 and older were in receipt of poor relief in six of the ten registration divisions. These results are for a 12-month period; the share of persons who received relief at some point after their 65th birthday would have been even larger.
The Stagnation of Old Age Pauperism Rates, 1891–1908
A comparison of tables 3b and 4 shows that from January 1, 1892 to March 31, 1906, old age pauperism rates declined only in the four southern divisions. In the midlands, northern divisions, and London, pauperism rates remained constant or increased slightly. For England and Wales as a whole, the old age pauperism rate was nearly identical on the two dates. Why didn't old age pauperism rates continue to decline after 1892? Booth (Reference Booth1894: 514) concluded that the major reason for declining pauperism among the aged during the 1880s was improvements in manual workers’ living standards. The rate of increase in the “prosperity of the working classes” was substantially slower after 1891 than in the previous two decades. From 1891–92 to 1906–7, real full-time wages of manual workers increased by 13.6 percent, after increasing by 37.9 percent from 1871–72 to 1891–92. The increase in wages was even smaller in key sectors—real wages in the building trades increased by only 8.1 percent from 1891–92 to 1906–7, and real wages in agriculture increased by 7.8 percent (Feinstein Reference Feinstein, Scholliers and Zamagni1995: 260–61, 264–65).Footnote 10
The pressure on living standards was most severe among low-skilled workers. The best available indicator of the effect of the trade cycle on the very poor is the rate of indoor pauperism among adult able-bodied males. Able-bodied workhouse inmates were from the “bottom of the social hierarchy.” While the number of male able-bodied workhouse inmates was small, it was very “responsive to indicators of general economic conditions” (MacKinnon Reference MacKinnon1986: 330–34). MacKinnon calculated the trend in male able-bodied indoor pauperism for three broadly defined regions—the North and Midlands, the South, and London.Footnote 11 Pauperism increased in the early 1890s in each region, then declined somewhat in the late 1890s before increasing again after 1900. For the entire period 1887 to 1908, the share of able-bodied males relieved in workhouses increased by 131 percent in the North and Midlands, 63 percent in London, and 48 percent in the South. The data suggest that employment opportunities for the poorest 10 to 20 percent of the population (those most likely to turn to the Poor Law for assistance in old age) deteriorated during the two decades leading up to World War I. The extent of deterioration was largest in the North and Midlands, although job opportunities for the low-skilled declined throughout England. This, combined with the meager growth in wage rates, provides an explanation for the trend in old age pauperism from 1891 to 1908.
As noted in the preceding text, much of the decline in old age pauperism after 1871 was a result of a change in policy rather than improving economic conditions. MacKinnon estimated that if the Crusade Against Outrelief had not occurred as many as “200,000 more old people would have been on outdoor relief in 1900” (1984: 327–28). While this is almost certainly an upper bound estimate of the impact of the crusade, adding 100,000 to the number of relief recipients 65 and older in 1908 yields an old age pauperism rate of 31.7 percent, only six percentage points lower than the pauperism rate in 1871. The economic growth in late Victorian England did not lead to a sharp reduction in poverty among the aged.
The estimates in tables 2–8 indicate that the Poor Law continued to play a major role in the lives of working-class individuals in late Victorian England despite its increasing stinginess and the increase in workers’ real wages over time. The data clearly show that large-scale government assistance for the elderly is not a product of the welfare state; it existed at the local level throughout the nineteenth century and earlier.
Gender Differences in the Number and Treatment of Paupers
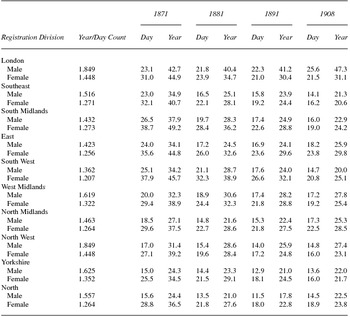
There were substantial differences in male and female pauperism rates and in the methods used to relieve male and female paupers in Victorian England. The day-count and 12-month estimates of pauperism rates for men and women aged 65 and older in each registration division in 1871, 1881, 1891, and 1908 are presented in table 9. The one-day pauperism rates were higher for women than men in all registration divisions except London throughout the period. The gender differences were largest in the more rural regions—the East, South West, and North. The relationship between the 12-month male and female pauperism rates is less clear cut. Column 1 shows that the ratio of the number of paupers who received relief at some point over the 12-month period ending on March 25, 1892 to the day count for January 1, 1892 was larger for old men than for old women in all ten registration divisions. The ratio was largest in London and the industrial North West, and lowest in the rural South West, South Midlands, and East. This suggests that aged women were more likely to be “permanent” paupers who received relief week in and week out, while aged men were more likely to receive relief for only part of each year.Footnote 12 As a result, the differences in male and female 12-month pauperism rates are smaller than the day-count differences, and after 1881 male pauperism rates were higher than female rates in London and the industrial North West.
Pauperism rates for men and women 65 and older, day and year counts

Sources: Data on the annual number of non-able-bodied male and female paupers for each registration division from the annual Reports of the Poor Law Board (for 1861) and the Local Government Board (for 1871–1908).
Note: The ratio of the year count to the day count of aged paupers for London in 1891–92 is far larger than that for any other division, and almost certainly overestimates the extent of London pauperism. In column 1, I set the ratio for London equal to that for the North West.
Table 9 also shows the changes in male and female pauperism rates over time. From 1871 to 1908, the female pauperism rate (both one-day and 12-month) declined by more than the male rate for all ten registration divisions.Footnote 13 For example, in the South Midlands the male one-day pauperism rate declined by 10.5 percentage points from 1871 to 1908 while the female one-day rate declined by 19.6 percentage points; in the North West the male pauperism rate declined by 2.2 percentage points and the female rate declined by 11.1 percentage points. The decline in both male and female pauperism was especially pronounced during the Crusade Against Outrelief in the 1870s.
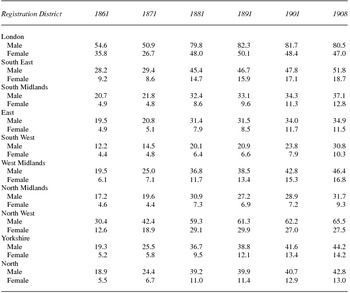
The form of relief offered to the aged differed substantially between men and women. Table 10 shows that far more old men than women were relieved in workhouses throughout the late nineteenth century. In 1871 more than 20 percent of male paupers 65 and older were relieved in workhouses in eight registration divisions, and more than 40 percent of male paupers were relieved indoors in London and the North West. By contrast, eight registration divisions relieved fewer than 10 percent of aged female paupers in workhouses, while London and the Northwest relieved more than 15 percent of their aged female paupers indoors. The male-female differential became even more pronounced following the Crusade Against Outrelief. Excluding London, the share of men 65 and older relieved in workhouses increased by 12.1 percentage points from 1871 to 1881, while the share of old women relieved in workhouses increased by 4.4 percentage points.Footnote 14 According to the pauper census of January 1, 1892, six registration divisions relieved more than one-third of their aged male paupers in workhouses, while only three divisions relieved more than 15 percent of aged female paupers indoors. Despite changes over time in the use of the workhouse, those registration divisions that relieved a relatively large (small) share of males in workhouses also relieved a relatively large (small) share of females in workhouses throughout the period from 1861 to 1908.
Percentage of male and female paupers 65 and older relieved in workhouses

Sources: Data on the percentage of non-able-bodied male and female paupers relieved in workhouses for each registration division from the annual Reports of the Poor Law Board (for 1861) and the Local Government Board (for 1871–1908).
There were several economic reasons for the male-female differential in pauperism rates. Old women were far less likely to be employed than men and were paid lower wages. A “test census” of persons aged 65 and older in 28 representative Poor Law unions conducted by the Departmental Committee on the Aged Deserving Poor found that nearly three-quarters of women 65 and older had weekly incomes from all sources of 10 shillings or less, as compared to 46 percent of men.Footnote 15 Booth's 1892–93 survey of rural districts found that nearly two-thirds of men aged 65–70 and 46 percent of men aged 70–75 had some wage earnings. By comparison, only 41 percent of women aged 65–70 and 19 percent of women aged 70–75 reported any wage earnings. Old women also were less likely to have any savings or benefits from friendly societies (Booth Reference Booth1894: 346–49).
Old women were far more likely to obtain assistance from relatives or friends than old men. The 1899 test census found that 70 percent of women 65 and older with income less than 10 shillings and not in receipt of poor relief received help from children, other relatives, or friends, as compared to 28 percent of old men. These large differentials occurred in urban, rural, and mining districts. Booth's survey found that 27 percent of women and 18 percent of men 65 and older received help from relatives or charity. The male-female differential declined with age—the share of men and women aged 80 and older who received assistance from relatives was very similar: 32 percent and 35 percent.
Why were aged male paupers more likely to be relieved in workhouses than aged female paupers? Local officials denied that they treated old men differently than old women. Some unions claimed to make indoor/outdoor relief decisions based on the character of the applicant, and there is evidence that women were more likely than men to be judged of “good character.” In his testimony before the Royal Commission on the Aged Poor, Booth stated that one reason why so many more old women than men were granted outdoor relief was because “a very large number of [women] are decent respectable people.”Footnote 16
Old people who lived with relatives were able to get by on a small amount of outdoor relief, and there is some evidence that children were more willing to have their aged mothers live with them than their fathers. Anderson (Reference Anderson, Shannas and Sussman1977: 51) maintained that “old people who were able to make some contribution to the family with whom they lived were most likely to be welcomed, while those who imposed a particular strain on the family were most likely to be rejected.” Old women typically were better able to perform useful domestic functions, such as child minding, cooking, and cleaning, than were old men. Crowther (Reference Crowther1981: 234) suggested that children often were willing to assist their mothers but not their fathers because “affectionate ties with the mother were likely to be stronger.” Some contemporaries maintained that old men were more willing to enter workhouses than old women, who “would endure much greater hardships before giving up the struggle for independence” (MacKinnon Reference MacKinnon1984: 110–11). In sum, the male-female differential in workhouse relief was the result of a combination of administrative, economic, and social causes.
During the Crusade Against Outrelief in the 1870s, the female pauperism rate declined by more than that for males, while the share of men relieved in workhouses increased far more than that for women. How can these two results be reconciled? Is this evidence that local Poor Law authorities treated old men and women differently? Suppose that the same share of men and women were offered workhouse relief during the crusade. If old men were more likely to accept indoor relief while women were more likely to refuse relief altogether rather than enter a workhouse, we would observe both a greater decline in the share of old women on relief and a greater increase in the share of old men being relieved in workhouses. The same result would be observed if children were willing to assist their mothers, but not their fathers, rather than have them enter a workhouse. It seems reasonable to conclude, along with Thane (Reference Thane1996: 34), that “the change of policy [initiated by the crusade] hit women especially hard since they had greatly outnumbered men as recipients of outdoor relief.” This was one of the (presumably) unintended consequences of the crusade, the sort of effect that economists love to point out.
Explaining Regional Differences in Pauperism Rates
The differences in pauperism rates between northern and southern England existed long before 1861. The first national count of the number of relief recipients, for the period April 1802–April 1803, revealed an overall pauperism rate of 14.7 percent for the four southern registration divisions and 8.3 percent for the three northern divisions.Footnote 17 In the first third of the nineteenth century, the high pauperism rates in the south were a result of the large number of able-bodied males given occasional relief. A sharp decline in the share of able-bodied adults receiving relief began with the adoption of the Poor Law Amendment Act in 1834, and in 1901 fewer than 2 percent of persons under 65 received poor relief in any region. By the late nineteenth century the observed north-south differential was almost totally a result of differences in old age pauperism rates.
Contemporaries and historians have offered three broad explanations for these regional differences in old age pauperism. All agreed that the north-south differential largely was a result of regional differences in wage rates and employment opportunities. Workers in high-wage districts were better able to save for their old age, and those in districts with ample employment opportunities for the aged were able to keep working past age 65. Most contemporaries also agreed that the local administration of the Poor Law played an important role in determining the rate of old age pauperism, and that there were regional differences in relief administration. Finally, some contemporaries and historians maintained that there were distinct regional welfare cultures in the nineteenth century—other things equal, northern workers were more likely to save, and less likely to apply for poor relief, than southern workers. I consider each explanation in turn. However, before examining the reasons for the regional differences in pauperism, it is necessary to briefly discuss how workers coped with the economic insecurity of old age.
Victorian Britain witnessed a movement toward self-help among the working class. Most workers attached a stigma to poor relief, and those who could afford to do so set aside money to provide against sickness, unemployment, and old age. The number of working-class depositors in savings banks increased from about 750,000 in 1851 to 1.9 million in 1871, 4.6 million in 1891, and 7.2 million in 1911; the share of workers with savings accounts increased from slightly more than 40 percent in 1871 to more than 90 percent by 1901. However, the amount of money that workers were able to accumulate was quite small; in 1899 the average balance in a working-class savings account was £4, which was the equivalent of less than 3.5 weeks’ pay for a bricklayer’s laborer or a police constable.Footnote 18
Membership in friendly societies paying sickness benefits also increased sharply in the second half of the nineteenth century, growing from about 2.4 million in 1871 to more than 4.4 million in 1901, by which date close to two-thirds of adult working-class males were eligible for sickness benefits. The number of persons officially eligible for superannuation benefits through a friendly society was far smaller than the number eligible for sickness benefits, although most friendly societies provided their members with unofficial pensions in the form of reduced sickness benefits. According to the Chief Registrar of Friendly Societies, E. W. Brabrook (Reference Brabrook1898: 112–13), the typical “pension” benefit was equal to only one-quarter of sickness benefits—between two shillings six pence and three shillings per week. These benefits, by themselves, were not sufficient to maintain an elderly individual, much less an elderly couple. It also should be stressed that friendly society membership remained outside the sphere of the bottom third of the income distribution—few low-skilled workers could afford the premiums charged by societies offering sickness benefits.Footnote 19
In sum, few aged working-class individuals had the resources to live entirely on their savings or insurance benefits. A majority of men continued to work past age 65; the labor force participation rate for men 65 and older was 73.4 percent in 1881 and 60.6 percent in 1901. However, a large share of those employed worked less than full time, and the numbers employed, and hours worked, decreased as age increased (Johnson Reference Johnson1994: 116–18).
Some of those who were unable to support themselves through earnings, savings, or friendly society benefits turned to private charity, rather than the Poor Law, for assistance. Charitable help took many forms: free coal or blankets in winter, medical assistance, small weekly doles, or accommodation in a privately funded almshouse. The extent of charitable aid varied across locations. There were large differences in the availability of almshouse accommodations across counties and even between localities within counties; available evidence suggests that almshouses were more prevalent in the south than in the north (Goose Reference Goose2014: 47–49; Goose and Basten Reference Goose and Basten2009: 67–68). Other things equal, the demand for poor relief by the elderly would have been smaller in locations where generous private charity existed. It is not possible to measure the extent of charitable assistance for the elderly at the local or national level, but it clearly was substantial.Footnote 20
Regional Differences in Economic Circumstances
Most contemporaries agreed that differences in the availability of employment were a major reason for regional differentials in old age pauperism. Booth (Reference Booth1894) maintained that old workers were better able to find full- or part-time employment in agriculture than in urban areas, based on the responses he received to a questionnaire on the condition of the local aged population sent to clergy throughout England and Wales. Many of the responses for urban districts noted the absence of work for the aged. In Dewsbury, “men after 60 find work very scarce; mills do not employ them unless skilled,” while in Birmingham “the chances of the aged getting casual labour are restricted by the competition of those between 45 and 60.”Footnote 21
The responses from rural unions were more mixed, but many reported that work for healthy old people was plentiful. Several unions reported that “field work is available for men as long as they are able to do it.” In many agricultural districts jobs existed for the old because of the outmigration of younger workers—one union reported that “labourers are scarce, and the industrious, though aged, are not lightly parted with” (ibid.: 150–77, 262–309). Booth concluded that in rural districts “old men keep their vigour longer, and even when feeble or ailing can still obtain and do some agricultural work.” By contrast, in towns old men “break down at an earlier age,” and are the victims of “increased competition for such work as . . . [they] are able to perform.” In sum, the “effective working life is ten years longer in the country than in the town, or, speaking generally, is as seventy to sixty” (ibid.: 321–22).
J. A. Spender (Reference Spender1892: 23–46) found that for many urban trades a worker's wage declined sharply after age 55, and even earlier for dock workers, building trades’ laborers, and other low-skilled workers employed in heavy labor. Wages of agricultural workers, while lower than those of urban low-skilled workers, often did not decline until workers reached the age of 65. However, there were fewer opportunities for casual employment in rural areas than in towns, and the condition of farm laborers over 65 “is generally one of desperate poverty” (ibid.: 41–43).
Historians disagree as to the relative availability of jobs in rural and urban districts. Thane (Reference Thane2000: 275) contends that “old men could work longest in agriculture,” and Macnicol (Reference Macnicol1998: 49–50) concludes that agricultural districts provided older workers with “a myriad of casual or light employment opportunities” that enabled them to continue working past age 65. Conversely, Hunt (Reference Hunt1989: 418) maintains that employment for the aged generally was more plentiful in urban than in rural districts, so that “there were more opportunities for old men and women to earn at least part of their own maintenance” in towns. Johnson (Reference Johnson1994: 114, 120) argues that the occupational data reported in the decennial censuses of 1881 to 1911 do not support the notion “that it was becoming increasingly difficult for [urban] workers to obtain a position after the age of 50.” He also found evidence, however, that many urban workers in old age switched from jobs in high-paying sectors to jobs in low-paying sectors.Footnote 22
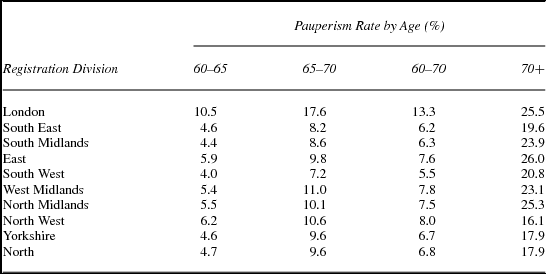
Some idea of the age at which employment rates for old people began to decline can be obtained by examining pauperism rates by age. Table 11 reports pauperism rates for men aged 60–65, 65–70, and 70 and older on March 31, 1906 for each registration division. The pauperism rate for men 70 and older was higher in London and the other four southern divisions than in the three northern divisions. This was not the case, however, for men under age 70. The pauperism rate for men aged 60–65 and 65–70 was lower in the South Midlands and South West, both relatively rural divisions, than in the North West, Yorkshire, or North. The rural-urban differences were even more pronounced at the county level. The pauperism rate for men aged 60 to 70 was 6.2 percent in the rural agricultural county of Suffolk, as compared to 8.3 percent in the urban/industrial county of Lancashire. For men in their 70s or older, the relationship was reversed—the pauperism rate was 27.6 percent in Suffolk and 16.0 percent in Lancashire.
Male pauperism by age, March 31, 1906

Source: Parliamentary Papers, Royal Commission on the Poor Laws and Relief of Distress, Appendix Vol. XXV, Statistical Memoranda (1910, LIII), 176–93.
The data suggest that job opportunities for men in their 60s were relatively good in agriculture, but that employment declined sharply after age 70. The fact that pauperism rates for men in their 60s were higher in industrial/urban districts offers some support for the notion that urban workers lost their jobs at a younger age than rural workers. However, the relatively low pauperism rates for men in their 70s suggest that urban areas offered more opportunities for the aged to find casual employment. The exceptionally high pauperism rate for London men supports the widely held idea that the London labor market suffered from chronic oversupply.
Booth (Reference Booth1894: 16–19) grouped Poor Law unions into six industrial categories, and calculated pauperism rates for persons 65 and older in 1891–92 for a sample of unions in each category.Footnote 23 For England as a whole, old age pauperism was lowest in residential unions, highest in seaports, and similar across manufacturing, mining, and agricultural unions. For each industrial category, pauperism rates were lower in the North than in the Midlands, East, or South. The north-south differential was especially large in purely agricultural districts, where the old age pauperism rate in the North (15.5 percent) was less than half that in the East (34 percent) or South (32.5 percent). The regional differences in pauperism rates within industrial categories were larger than the differences across industrial categories.
The differences within industrial categories were caused to some extent by regional wage differentials. Wages in agriculture and the building trades generally are considered to be representative of rural and urban wage rates (Bowley Reference Bowley1900: 59, 63; Hunt Reference Hunt1973: 4–5). Weekly wage rates for agricultural laborers and bricklayers’ laborers varied substantially across registration divisions. In agriculture, wages were highest in the three northern divisions and lowest in the South Midlands, East, and South West.Footnote 24 Nominal wage rates in the building trades were highest in London, followed by the northern and midlands divisions, and were lowest in the South Midlands, East, and South West. The higher wage rates in northern districts enabled workers to save more and to join friendly societies, and enabled those who continued to work after age 65 to be better able to get by without applying for poor relief. In addition, higher wages enabled children of the aged who lived near their parents to offer them more financial assistance.
Regional differences in economic circumstances effected pauperism rates in one other way. Children were more likely to assist their aged parents if they lived near them. Other things equal, old people in districts with low outmigration rates would be more likely to have children living nearby, and therefore more likely to receive help from their children, than those in districts with high outmigration rates. Outmigration rates were especially high in the low-wage, and rural, South Midlands, East, and Southwest.Footnote 25 As a result, a larger share of old people in the south than in the high-wage and more urban north had no children to whom they could turn for assistance, and were forced to apply for poor relief when they could no longer support themselves.
Booth (Reference Booth1894: 339–52) analyzed the sources of maintenance for the elderly in rural districts in 1892–93, based on a survey of 9,125 persons aged 65 and over (4,450 males and 4,675 females) living in 262 rural parishes located throughout the country. For England and Wales as a whole, nearly half of the elderly had some wage earnings, although Booth stressed that these earnings often were quite meager. Slightly more than a third had savings, and 55 percent maintained themselves entirely through earnings and savings. Some 22 percent of the elderly received outdoor poor relief, although only 5 percent relied entirely on the Poor Law. The importance of the various sources of maintenance differed across regions. The two extremes were, not surprisingly, the high-wage north and the low-wage east. In the north, 45.8 percent of the elderly had some savings, 63.3 percent maintained themselves entirely through earnings and savings, and only 13.4 percent received outdoor relief. By contrast, in the east only 26.1 percent of the elderly had savings, 49.4 percent maintained themselves through earnings and savings, and 28.6 percent received outdoor relief.Footnote 26
In sum, most aged individuals had income from one or more sources, including wages, savings, friendly society or trade union benefits, or help from children, other relatives, or friends. For many, however, income from these sources was less than they needed to subsist, and they were forced to turn to the Poor Law for help.
Regional Differences in Relief Administration
Regional differentials in pauperism rates were not the result of economic forces alone—the local administration of poor relief also played an important role. The most important difference across unions in relief administration was the use of the workhouse. Some unions offered workhouse relief to virtually all aged paupers, while others gave outdoor relief to those aged persons who were able to maintain themselves at home. Between these two extremes there was a continuum of policies. In many unions officials attempted to determine the character of relief applicants, and offered outdoor relief to those deemed to be “deserving” and workhouse relief to those deemed “undeserving.”
All agreed that the aged attached a stigma to indoor relief and that, other things equal, the offer of the workhouse lowered pauperism rates. One person who testified before the Royal Commission on the Aged Poor commented that “there is the strongest objection on the part of those who have a home at all, or can find a home among any of their relatives, to enter the workhouse.” The poor's objections to the workhouse were not necessarily those portrayed by early and mid-Victorian writers such as Charles Dickens—by the 1860s workhouses had “ceased to threaten cold, hunger, and mistreatment” (Crowther Reference Crowther1981: 246). Sir Hugh Owen testified that “the great majority” of aged paupers in workhouses were “better fed, better housed, and better provided for than they ever were before.” The poor objected to the discipline of the workhouse and to their loss of freedom—a witness before the Royal Commission stated that the poor “look upon the workhouse as a kind of prison.” Moreover, the acceptance of workhouse relief threatened “social disgrace” both for the pauper who accepted it and for his or her family.Footnote 27
Can differences in relief administration explain the regional differentials in old age pauperism rates? Outside of London there was a negative relationship between the use of workhouses and the pauperism rate—the share of aged paupers relieved in workhouses was higher in northern than in southern divisions. The deterrent effect of workhouse relief has been empirically estimated for paupers of all ages in 1868–69 by MacKinnon (Reference MacKinnon1987) and for persons aged 65 and older in 1891–92 by Boyer and Schmidle (Reference Boyer and Schmidle2009). MacKinnon found that for nine of ten registration divisions—the North West being the exception—increased use of the workhouse led to a reduction in the number of paupers. The magnitude of the deterrent effect was large—a 10 percent increase in the share relieved indoors led to a 2.5 to 6.0 percent decline in the pauperism rate (MacKinnon Reference MacKinnon1987: 621).
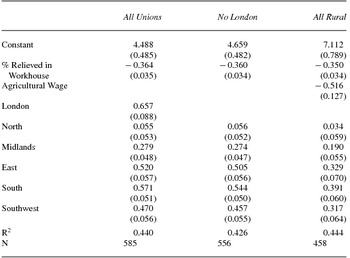
Boyer and Schmidle estimated regression equations to explain the variations in old age pauperism rates across all 585 English Poor Law unions. Their independent variables included the percentage of paupers relieved in workhouses, a series of dummy variables for the industrial character of the union, and a series of regional dummies; for a subset of rural unions, the weekly wage paid to agricultural laborers also was included.Footnote 28 Table 12 reports the estimated coefficients for the most relevant variables from three regressions—one including all 585 unions, one excluding the 29 London unions, and one for a subset of rural and semirural unions. The workhouse had a large deterrent effect in each regression—a 10 percent increase in the share of paupers relieved in workhouses led to a 3.5 to 3.6 percent decline in old age pauperism. The coefficients on the dummy variables for industrial character were small and are not reported in the table. Following Booth, the unions were divided geographically into seven regions. The Industrial North is the excluded region in the regressions. Other things equal, pauperism rates in the East, South, and South West were significantly higher than in the North or Industrial North; pauperism rates in the Midlands were above those in the northern regions but below those in the south.
Regressions to explain old age pauperism in 1891–92

Note: Dependent variable is the share of persons aged 65 and older in receipt of poor relief. Standard errors are in parentheses.
Column 3 gives regression results for a subset of rural unions for which agricultural laborers’ wage data are available. The agricultural wage had a strong effect on pauperism—a 10 percent increase in the wage led to a 5.2 percent decline in the old age pauperism rate. Including farm wages reduces the magnitude of the coefficients on the regional dummies somewhat, but they remain significantly different from zero. In other words, the north-south differentials in old age pauperism rates remain even when differences in relief administration, wage rates, and the industrial nature of unions are taken into account. The regional dummies might be serving as proxies for differences in the availability of work outside of agriculture that were not picked up by the “industrial character” dummies. Job opportunities within agriculture also differed across regions—winter employment for the aged must have been especially scarce in the grain-producing South and East (Goose Reference Goose2005: 363–67, 371–76). By contrast, the dummy variables might be picking up noneconomic differences across regions.
Regional Welfare Customs
Some Victorian commentators and historians have offered another explanation for the north-south differentials in pauperism. Booth (Reference Booth1894: 24) concluded that the low pauperism rates in the north were “undoubtedly due to the character of the people,” and other contemporaries agreed. Northerners were deemed to be more likely to have savings accounts and be members of friendly societies than southerners, and to attach a greater stigma to applying for poor relief (Rose Reference Rose and Donajgrodzki1977). More recently, King (Reference King2000: 267–69) has argued that there were “very substantial . . . differences in entitlement, relief generosity, and relief sentiment” between northern and southern England. Not only were southerners more likely than northerners to apply for poor relief, but local relief administrators were more willing to offer them assistance.
What caused these regional differences in welfare customs, and when did they begin? King (ibid.: 268) maintains that the differences date back to the early eighteenth century if not before—the stingy north and west had “a complex religious history and arguably the most distinctive and potentially puritanical cultures,” and also had more developed systems of private charity. Billinge (Reference Billinge, Baker and Billinge2004) suggests that distinct regional cultures began to develop in the second half of the eighteenth century, largely as a result of the uneven geographic nature of the Industrial Revolution.
Distinct regional attitudes toward welfare might have emerged during the heyday of the Old Poor Law from 1795 to 1834. Regional differences in the role of poor relief grew in the late eighteenth century, when the deteriorating economic environment for southern farmworkers led to a sharp increase in the demand for public assistance in the grain-producing south and east. The relief of able-bodied laborers and their families was so widespread during the first third of the nineteenth century that the stigma associated with receiving poor relief must have declined. Southerners became accustomed to being on relief, and many came to believe that they had a right to public assistance during hard times.Footnote 29
The elderly in Victorian England had grown up under the Old Poor Law—many of those raised in the south and east had lived in families that received child allowances from the parish. The customs established before 1834 might have continued to influence the behavior of the aged poor into the 1890s—the shadow cast by Speenhamland was quite long. However, regional differences in attitudes toward welfare should have declined in the last decade of the nineteenth century, as the number of individuals who remembered the period before 1834 fell. This would help to explain the convergence in old age pauperism rates after 1891.Footnote 30
The Adoption of the Old Age Pension Act
The 1895 Report of the Royal Commission on the Aged Poor predicted that old age pauperism rates would continue to decline as a result of the “remarkable growth of thrift” of the working class. However, it soon became clear that this assessment was overly optimistic, and just four years later the Select Committee on Aged Deserving Poor concluded that, despite “the remarkable development of habits of thrift . . . among the working classes in recent times,” large numbers of poor elderly individuals “whose conduct and whose whole career has been blameless, industrious, and deserving, find themselves from no fault of their own . . . with nothing but the workhouse or inadequate out-door relief, as the refuge for their declining years.”Footnote 31
The continued high levels of elderly pauperism put mounting pressure on the government to adopt a national pension scheme, and in 1908 Parliament passed the Old Age Pension Act, which provided a weekly pension of five shillings to individuals aged 70 and older (10 shillings to couples) with incomes below £21 per annum (about eight shillings per week). Smaller pensions were paid to those with annual incomes as high as £31 10 shillings (or £31.5, as 10 shillings is one half of a pound (£)). Individuals who had received poor relief after January 1, 1908 initially were not eligible for a pension, although this clause was abolished in 1911.Footnote 32
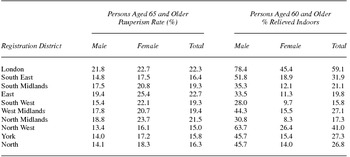
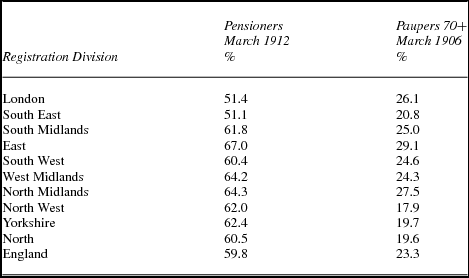
The number of pension recipients was substantially greater than the number of old age paupers. Table 13 shows the share of persons aged 70 and older in receipt of old age pensions on the last Friday in March 1912, along with the share in receipt of poor relief on March 31, 1906, for each registration division. For England as a whole, 59.8 percent of persons 70 and older received a pension in March 1912, more than two-and-a-half times the percentage of persons of the same age who were poor relief recipients on March 31, 1906. Nearly 94 percent of pensioners received the maximum pension of five shillings per week.Footnote 33
Old age pensioners, March 1912

Sources: Data on the number of old age pensioners in March 1912 from Parliamentary Papers, Old Age Pensioners and Aged Pauperism (1913, LV), 4–6. Data on paupers in March 1906 from Parliamentary Papers, Royal Commission on the Poor Laws and Relief of Distress, Appendix Vol. XXV, Statistical Memoranda (1910, LIII), 176–93.
Why was the number of old age pensioners so large? Some of those who received pensions had previously relied on friends, relatives, or private charity, rather than the Poor Law, to supplement their meager incomes. Moreover, the eligibility standards for pensions and poor relief were different—some (immeasurable) share of individuals who were eligible for pensions would not have been deemed destitute enough to grant poor relief. Still, the data suggest that the Poor Law statistics underestimate, perhaps by a substantial amount, the extent of poverty among the aged. In the first decade of the twentieth century a large number of old people lived on quite low incomes without applying for poor relief. The fact that they did so is evidence that the working class attached a stigma to the receipt of poor relief, especially in a workhouse. Commenting on the unexpectedly large number of pensioners, Lloyd George stated in 1909: “what strikes you is their horror of the Poor Law . . . this pension act has disclosed the presence amongst us of over 600,000 people, the vast majority of whom were living in circumstances of great poverty, yet disclaimed the charity of the public” (Thane Reference Thane2000: 227–28).
The authors of the 1908 Act went to some length to ensure that old age pensions were not associated with the Poor Law—pensions were collected from the local Post Office rather than from Poor Law authorities. There was no stigma attached to receiving a pension. Indeed, they were “immensely popular”—old people spending their pension allowance at a shop in Salford “would bless the name of Lloyd George as if he were a saint from heaven” (Roberts Reference Roberts1990: 84).
The north-south differential found in the pauperism data does not exist in the pension data—the share of old age pensioners in the North West and Yorkshire was slightly larger than that for the South Midlands and South West, and substantially larger than that for London and the South East. What might explain this surprising result? Perhaps the northern divisions contained relatively large numbers of aged individuals with incomes too high for them to obtain poor relief but low enough that they were eligible for pensions. The result also might be evidence of remaining north-south differences in attitudes toward the Poor Law. That is, as late as 1906 the definition of destitution used by local relief administrators might have been stricter in the north than in the south, or aged northerners might have attached a greater stigma to applying for poor relief than did aged southerners.
Conclusion
This paper presents newly constructed estimates of old age pauperism rates for each of England's ten registration divisions from 1861 to 1908. During the 1860s more than 35 percent of persons 65 and older in England were in receipt of poor relief. The number of aged paupers declined thereafter as a result of the Crusade Against Outrelief and improvements in living standards. Still, in 1908 one-quarter of the population, and more than one-third of working-class individuals, 65 and older received poor relief some time during the year. The share who received relief at some point after they turned 65 was even higher. Old age pauperism rates were higher in southern than in northern registration divisions throughout the second half of the nineteenth century, but it must be stressed that even in the north as late as 1908 nearly one in three elderly working-class individuals received poor relief each year. The results support Thomson's (Reference Thomson and Bonfield1986: 367) conclusion that “a marked willingness to redistribute resources to the aged through communal rather than familial institutions has been evident in Britain for a long time.” Large-scale government support for the elderly existed long before the welfare state.
The data presented here give some idea of the extent of economic insecurity faced by low-skilled workers in Victorian England. Despite the well-documented long-run improvement in workers’ material living standards in the second half of the nineteenth century, a large share of working-class households still required assistance from the Poor Law in old age. The Poor Law “was a fundamental feature of Victorian society. . . . Recourse to the Poor Law was the standard response to personal and economic crises, and was the normal method of supplementing income in old age” (MacKinnon Reference MacKinnon1984: 348). It is necessary to realize the extent of economic insecurity among the working class in order to understand the Liberal government's adoption of the Old Age Pension Act and other social welfare policies in the decade before World War I.
Official Publications
Great Britain, Board of Trade (1908a) Report of an Enquiry into Working Class Rents, Housing and Retail Prices. London: HMSO.
Great Britain, Board of Trade (1908b) Twelfth Abstract of Labour Statistics. London: HMSO.
Great Britain, Board of Trade (1915) Seventeenth Abstract of Labour Statistics of the United Kingdom. London: HMSO.
Great Britain, Parliamentary Papers (1803–4, XIII) Abstract of Returns Relative to the Expense and Maintenance of the Poor Law.
Great Britain, Parliamentary Papers (1834, XXVII) Report on the Administration and Practical Operation of the Poor Laws.
Great Britain, Parliamentary Papers (1890–1, LXVIII) Return . . . of Paupers over Sixty.
Great Britain, Parliamentary Papers (1892, LXVIII) Return . . . of Paupers over Sixty-Five.
Great Britain, Parliamentary Papers (1895a, XIV) Report of the Royal Commission on the Aged Poor.
Great Britain, Parliamentary Papers (1895b, XIV) Royal Commission on the Aged Poor. Vol. II, Minutes of Evidence.
Great Britain, Parliamentary Papers (1895c, XV) Royal Commission on the Aged Poor. Vol. III, Minutes of Evidence.
Great Britain, Parliamentary Papers (1899, VIII) Report from the Select Committee on Aged Deserving Poor.
Great Britain, Parliamentary Papers (1900, X) Report of the Departmental Committee of the Aged Deserving Poor.
Great Britain, Parliamentary Papers (1910, LIII) Royal Commission on the Poor Laws and Relief of Distress, Appendix Vol. XXV, Statistical Memoranda.
Great Britain, Parliamentary Papers (1913, LV) Old Age Pensioners and Aged Pauperism.