Introduction
Trehalose has been found in various organisms such as bacteria, fungi, yeast, insects, nematodes and plants, but is absent in mammals (Elbein et al., Reference Elbein, Pan, Pastuszak and Carroll2003). In these organisms, trehalose performs diverse functions such as acting as an energy reserve, and protecting proteins and cell membranes from heat, dehydration and oxidative stress. Chemically, trehalose is a non-reducing disaccharide in which two glucose molecules are linked together through α, α − 1, 1-glycosidic bond (Becker et al., Reference Becker, Schlöder, Steele and Wegener1996). Breaking this bond provides access to the glucose molecules, which are the source of energy.
Trehalase is the enzyme that catalyzes the hydrolysis of trehalose into two glucose molecules (Becker et al., Reference Becker, Schlöder, Steele and Wegener1996). Genomic analysis has revealed the presence of two trehalase-like genes in insects, Tre-1 and Tre-2. Tre-1 encodes for soluble trehalase and Tre-2 encodes for membrane-bound trehalase. Although both Tre-1 and Tre-2 are expressed throughout the insect body, including the gut, Tre-1 is predominantly expressed in the cuticle and malpighian tubules, whereas Tre-2 is expressed in the fat body and tracheae (Chen et al., Reference Chen, Tang, Chen, Yao, Huang, Chen, Zhang and Zhang2010). In recent studies using RNA interference (RNAi) for the Lepidopteran Spodoptera exigua, Tre-1 and Tre-2 were found to perform different functions (Chen et al., Reference Chen, Tang, Chen, Yao, Huang, Chen, Zhang and Zhang2010). While Tre-1 catalyzes the trehalose during chitin synthesis in the cuticle, Tre-2 catalyzes trehalose during chitin synthesis in the peritrophic membrane of the midgut (Chen et al., Reference Chen, Tang, Chen, Yao, Huang, Chen, Zhang and Zhang2010). During chitin synthesis, Tre-1 and Tre-2 also affect the expression of chitin synthase genes in cuticle (CHS1) and midgut (CHS2), respectively (Chen et al., Reference Chen, Tang, Chen, Yao, Huang, Chen, Zhang and Zhang2010).
The vital role of trehalase in energy metabolism during flight activities of insects is well demonstrated in the orthopteran Locusta migratoria (van Horst et al., Reference van Horst, van Doorn and Beenakkers1978). L. migratoria, commonly called the migratory locust, is a global polyphagous pest and is well known for its migration over long distances. During initial phases of L. migratoria flight, the chief energy source is trehalose, a major sugar found in the hemolymph. At that time, trehalase enzymatic activity is extremely high in flight muscles so as to hydrolyze trehalose for energy production. In addition to L. migratoria, the role of trehalase in flight activity has been demonstrated in the hemipteran, brown planthopper (Nilaparvata lugens). The macropterous morphs of N. lugens, which migrate over large distances, have a higher activity of soluble trehalase compared to that in brachypterous morphs, which are not active fliers (Gu et al., Reference Gu, Shao, Zhang, Liu and Zhang2009). Thus, the physiological and energetic constraints involved in insect migration are overcome by catalyzing the hydrolysis of trehalose by trehalase.
In plants, trehalose is an integral component to stress responses and may play a role in herbivore defense (Fernandez et al., Reference Fernandez, Béthencourt, Quero, Sangwan and Clément2010; Singh et al., Reference Singh, Louis, Ayre, Reese and Shah2011). Increased amount of trehalose were found in Arabidopsis as a response to green peach aphid (GPA) feeding (Singh et al., Reference Singh, Louis, Ayre, Reese and Shah2011). The increase in trehalose in Arabidopsis influences expression of Phytoalexin Deficient 4, a key GPA defense gene, as well as shifts carbon into starch production, a poorer source of energy for the GPA than sucrose. Trehalase expression in aphids, however, is less understood. Soluble trehalase has been found in the salivary gland transcriptome of the pea aphid, Acyrthosiphon pisum (Mutti, Reference Mutti2006; Carolan et al., Reference Carolan, Caragea, Reardon, Mutti, Dittmer, Pappan, Cui, Castaneto, Poulain, Dossat, Tagu, Reese, Reeck, Wilkinson and Edwards2011). Since aphid saliva has a role in suppression of plant defenses (Will & van Bel, Reference Will and van Bel2008), Mutti (Reference Mutti2006) speculated that trehalase expressed in salivary gland may cause the breakdown plant trehalose and thereby suppress plant defenses. Another possible scenario is that aphid resistant plants may inhibit insect trehalase, and thereby negatively impact energy production of the aphid.
Owing to its importance in various physiological pathways, characterizing trehalase is critical in agricultural pests. The soybean aphid, Aphis glycines Matsumura is a major pest of soybean (Glycine max) throughout most of soybean-growing regions of the U.S. and Canada (Ragsdale et al., Reference Ragsdale, Landis, Brodeur, Heimpel and Desneux2011; Tilmon et al., Reference Tilmon, Hodgson, O'Neal and Ragsdale2011). This pest, a native of Asia, is invasive in North America and was first reported in this region in 2000 (Hartman et al., Reference Hartman, Domier, Wax, Helm, Onstad, Shaw, Solter, Voegtlin, D'Arcy, Gray, Steffey, Isard and Orwick2001). Since 2000, it has spread rapidly and by 2009, A. glycines invaded 30 states in U.S. and three Canadian provinces (Ragsdale et al., Reference Ragsdale, Landis, Brodeur, Heimpel and Desneux2011). Host-plant resistance (HPR) is a safe and effective strategy to manage A. glycines, but it has been hindered by the development of biotypes, i.e., insect populations that are virulent to the previously known resistant sources (Kim et al., Reference Kim, Hill, Hartman, Mian and Diers2008; Hill et al., Reference Hill, Crull, Herman, Voegtlin and Hartman2010). The spread of virulent biotypes of A. glycines is largely influenced by migration as alate (winged) morphs are capable of flying over long distances (Michel et al., Reference Michel, Zhang, Jung, Kang and Mian2009; Reference Michel, Omprakash, Mian and Sudarec2011; Orantes et al. 2012). During the life cycle of A. glycines, three specific movement events occur. The alate morphs of A. glycines migrate from soybean to buckthorn (Rhamnus spp.) during autumn, from buckthorn to soybean during spring and disperse among soybean fields during summer. Given the high energy demands during insect flight, trehalase is likely to have a major role in successful dispersal and migration of A. glycines adults over long distances. Further, on the basis of its putative role in plant–insect interactions, trehalase could be involved in molecular interactions of A. glycines with resistant soybean cultivars.
The current study was intended to help better understand the molecular structure and expression of a soluble trehalase encoding gene in A. glycines. Specifically, in this paper, we report (i) the complete cDNA sequence encoding a full-length soluble trehalase from A. glycines (AyTre-1) and phylogenetic comparisons among other arthropods; (ii) expression analysis of AyTre-1 in alate and apterate morphs of A. glycines; (iii) expression analysis of AyTre-1 in A. glycines fed with resistance and susceptible isolines of soybean; and (iv) expression profile of AyTre-1 in tissues and different developmental stages of A. glycines.
Materials and methods
Sequence retrieval and analysis
To retrieve cDNAs for trehalase in A. glycines, protein sequences of Tribolium casteneum Tre (TcTre1: XP_973919.1 and TcTre2: XP_972610.2) were used as query in a tblastn search of A. glycines transcriptomic database (Short Read Archive accession: SRX016521; Bai et al., Reference Bai, Zhang, Orantes, Jun, Mittapalli, Mian and Michel2010; R. Bansal, unpublished data). We identified five contig sequences displaying significant similarity to the insect trehalases; identity of which was further confirmed by blastx search at NCBI GenBank. However, based on known insect trehalases, only one cDNA sequence (AyTre-1) that displayed significant similarity to a soluble group appeared to be complete (Note: to avoid confusion with the Anopheles gambiae, whose genes are abbreviated as Ag, we provisionally use the Ay abbreviation for A. glycines). The remaining cDNA sequences were only partial fragments that showed match to membrane-bound group of trehalases. The ORF finder tool at National Center for Biotechnology Information (NCBI) was used to identify the open reading frame (ORF) of AyTre-1. The transmembrane helices in the AyTre-1 protein were predicted at TMHMM Server v. 2.0. The putative N-glycosylation sites were predicted by PROSCAN (Bairoch et al., Reference Bairoch, Bucher and Hofmann1997). The signature sequences of the AyTre-1 peptide were identified through ScanProsite (http://prosite.expasy.org/scanprosite/). Multiple alignments of various protein sequences were performed by using ClustalW (Larkin et al., Reference Larkin, Blackshields, Brown, Chenna, McGettigan, McWilliam, Valentin, Wallace, Wilm, Lopez, Thompson, Gibson and Higgins2007; Goujon et al., Reference Goujon, McWilliam, Li, Valentin, Squizzato, Paern and Lopez2010). The AyTre-1 cDNA sequence was deposited in the NCBI GenBank (accession number JQ246351).
Phylogenetic analysis of AyTre-1
The phylogenetic analysis was conducted using MEGA5.05 software (Tamura et al., Reference Tamura, Peterson, Peterson, Stecher, Nei and Kumar2011). To infer the evolutionary history, the Neighbor-Joining method (with pairwise deletion) was used. A bootstrap test was conducted (10 000 replicates) to calculate the percentages of replicate trees in which sequences clustered together. In addition to insects, trehalase sequences of common water flea Daphnia pulex (Crustacea: Arthropoda) were also included in the phylogenetic analysis (a bioinformatics search in the two-spotted spider mite, Tetranychus urticae genome did not reveal the presence of sequences with significant similarity to trehalase). Soluble trehalase from Caenorhabditis elegans (Ce-Tre1) was used as outgroup. In addition, a phylogenetic analysis was constructed using the Maximum-Likelihood method that gave a tree with similar topology as given by the Neighbor-Joining method (data not shown). The accession numbers for sequences used in phylogenetic analysis are as follows: AaTre-2 (XP_001660293.1), AyTre-1 (JQ246351), ApTre-1(XP_001950264.1), ApTre-2 (XP_001949459.1), LmTre-1 (ACP28173.1), AmTre-1 (XP_393963.3), AmTre-2(NP_001106141.1), BmTre-1 (BAA13042.1), BmTre-2 (BAE45249.1), DmTre-2 (ABH06695.1), PhTre-1 (XP_002433202.1), PhTre-2 (XP_002426668.1), SfTre-1 (ABE27189.1), SfTre-2 (ACF94698.1), TcTre-1 (XP_973919.1), TcTre-2 (XP_972610.2), NlTre-1 (ACN85420.1), NlTre-2 (ACV20872.1), DpTre-2A (321454407), DpTre-2B (321451305), and CeTre-1 (NP_491890.2).
Insect culture
Both alate and apterate morphs of A. glycines were obtained from a laboratory colony, referred to as biotype 1 (B1), that originated from insects collected from Urbana (IL, USA) in 2000 (Hill et al., Reference Hill, Li and Hartman2004). At Ohio Agricultural Research and Development Center (OARDC, Wooster, OH, USA), a laboratory population of these insects is maintained on susceptible soybean seedlings (SD01-76R, developed at South Dakota State University) in a rearing room at 23–25 °C and 15:9 (light:dark) photoperiod.
Real-time quantitative PCR (qPCR) for expression analysis of AyTre-1
Comparisons of alate and apterate morphs of A. glycines
qPCR was used to determine the expression of AyTre-1 in alate and apterate morphs of A. glycines. The alate and apterate individuals were collected with the help of an aspirator and a camel hair brush, respectively, from the B1 colony. For RNA extraction and subsequent qPCR analysis, three biological replicates were taken for each morph. Five individuals from each morph were processed for extracting total RNA using TRI reagent (Molecular Research Center Inc., Cincinnati, OH, USA), following the protocol provided by the manufacturer. To remove DNA contamination, total RNA samples were treated with TURBO™ DNase (Applied Biosystems/Ambion, Austin, TX, USA). Using iScript™ cDNA synthesis kit (Bio-Rad Laboratories, Hercules, CA, USA), first-strand cDNA was prepared with 200 ng RNA (DNA free) for all samples. qPCR was performed with iQ SYBR green super mix on a CFX-96 thermocycler system (Bio-Rad, Hercules, CA, USA) (Bansal et al., Reference Bansal, Hulbert, Schemerhorn, Reese, Whitworth, Stuart and Chen2011). AyTre-1-specific PCR primers (Table S1) were designed using Beacon Designer version 7.0 (Palo Alto, CA, USA). Because of its consistent expression, A. glycines-specific EF1α was used as internal control Bansal et al., (2012) (Table S1). Each reaction was carried out with 1 μl of cDNA, 0.5 μM of each primer and 12.5 μl of iQ SYBR green super mix in 25 μl total volume. Each reaction was performed in duplicate (two technical replications for each biological replication) in a 96-well optical-grade PCR plates, sealed with optical sealing tape (Bio-Rad Laboratories, Hercules, CA, USA). The PCR amplifications were performed using the following cycling conditions: one cycle at 95 °C (3 min), followed by 35 cycles of denaturation at 95 °C (30 s), annealing and extension at 55–60 °C, depending on the primer set, for 45 s. Finally, melt curve analyses were carried out by slowly heating the PCR mixtures from 55 to 95 °C (1 °C per cycle of 10 s) with simultaneous measurements of the SYBR Green I signal intensities.
Comparisons of A. glycines on resistance and susceptible soybean
The A. glycines-resistant cultivar of soybean used in current study was developed by a cross between SD01-76R × Dowling × Loda (by Brian Diers, National Soybean Research Center, Urbana, IL, USA). SD01-76R and Dowling were susceptible and resistant parents, respectively. The soybean variety Dowling contains Rag1 (Rag: Resistance to A. glycines), which shows an antibiotic effect to A. glycines (Hill et al., Reference Hill, Li and Hartman2004). Freshly hatched apterate nymphs (60–70 in total) that fed for 12 h separately on resistant and susceptible plants were collected. Collected insect samples were processed for total RNA extraction, DNAse treatment, cDNA preparation, and qPCR as described in the previous section. The first-strand cDNA was prepared with 500 ng RNA (DNA free) in both treatments. TBP (gene encoding for TATA-box-binding protein) was used as an internal control as it shows stable expression in A. glycines fed with resistant and susceptible plants (Bansal et al., 2012) (Table S1).
Comparisons among various tissues and developmental stages of A. glycines
For tissue and developmental expression of AyTre-1, only apterate morphs were used. To obtain selected tissue samples (gut, fat body, integument, and embryo developing inside adults), A. glycines adults (5 days old) were dissected in phosphate buffer saline (pH 8) under a dissection microscope. During dissection, other tissues of A. glycines such as salivary gland and bacteriocytes were discarded. To determine the expression of AyTre-1 in different developmental stages, all four nymphal and adult (whole body) samples were collected from insects feeding on susceptible (SD) soybean plants. Both tissue and developmental stage (whole body) samples were processed for total RNA extraction, DNAse treatment, cDNA preparation, and qPCR as described in the earlier section. The first-strand cDNA was prepared with 150 ng and 500 ng RNA (DNA free) from tissue and developmental stages samples, respectively. Prior to PCR, cDNA preparations from developmental stages were diluted 1.5 times with nuclease-free water. qPCR reactions were performed as explained above.
Statistical analysis of qPCR data
Relative expression levels of AyTre-1 in various A. glycines samples were determined by comparative Ct method (2−∆Ct) (Schmittgen & Livak, Reference Schmittgen and Livak2008). The significance of differences in the AyTre-1 expression was determined by t test.
Results
Characterization of AyTre-1 in A. glycines
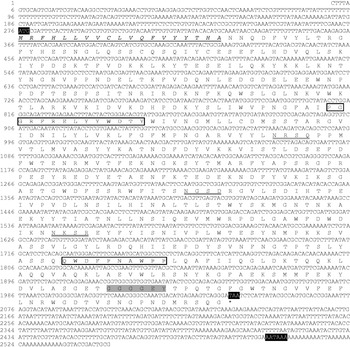
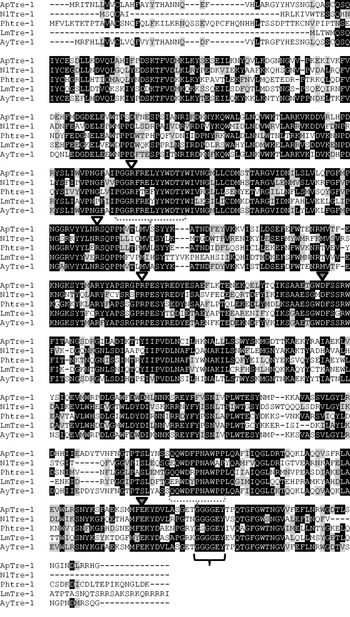
In the cDNA library of A. glycines, we identified a full-length 2550 bp long cDNA encoding for soluble trehalase protein (AyTre-1). AyTre-1 cDNA was predicted to contain an ORF of 1770 bp that encoded for a 589 amino acid residues protein. The nucleotide and deduced amino acid sequences of the AyTre-1 are shown in fig. 1. The sequence included the ATG start codon at positions 276–278, the stop codon TAA at 2043–2045 and one polyadenylation signal, AATAAA, at 2503–2508. Upon blastn search at GenBank, the nucleotide sequence of the ORF region of AyTre-1 gene showed highest similarity (84% identity) to that of A. pisum (ApTre-1, XM_00195022). The predicted molecular mass of putative AyTre-1 protein was 68.39 kDa with pI of 5.78. The AyTre-1 protein belongs to the protein family of glycoside hydrolases (Pfam domain number PF01204). SignalP server predicted a secretion signal peptide of 19 amino acids residues at amino terminal of AyTre-1 protein. In addition, AyTre-1 protein was predicted to contain three N-glycosylation sites. The AyTre-1 protein contained two signature motifs, i.e., PGGRFRELYYWDTY (179–192) and QWDFPNAWPP (484–494), found in trehalase proteins. Residues 549–554 corresponded to a glycine-rich region, another characteristic feature of trehalase proteins. Based on a structure prediction of trehalase in S. exigua (Silva et al., Reference Silva, Terra and Ferreira2010), we found two catalytic (D336, E538) and three essential (R182, R235 and R300) residues for enzymatic activity of AyTre-1 (fig. 2, supplementary fig. 1). Multiple sequence alignment of soluble trehalases in different hemimetabolous insects showed a high level of conservation in amino acid residues except in 5′ and 3′ regions (fig. 2). Full-length AyTre-1 protein showed highest similarity to that of A. pisum (ApTre-1, XP_001950264, 84% identity), followed by N. lugens (NlTre-1, ACN85420, 54% identity), L. migratoria (LmTre-1, ACP28173, 51% identity), and P. humanus (PhTre-1, XP_002433202, 50% identity).
Nucleotide and deduced amino acid sequences of AyTre-1 cDNA from A. glycines . The start codon (ATG), stop codon (TAA), and putative polyadenylation signal (AATAAA) are highlighted in black. The secretion signal peptide predicted by SignalP is indicated by amino acid residues that are italicized and underlined. Two signature sequences of the trehalase peptide identified by ScanProsite are boxed. The three putative N-glycosylation sites predicted by PROSCAN are double-underlined. The highly conserved glycine-rich region is highlighted in gray. The sequences were deposited in the GenBank with accession number JQ246351.

Alignment of amino acids residues of soluble trehalase in different hemimetabolous insects. The conserved and similar amino acid residues are labeled in black and gray backgrounds, respectively. Gray dotted and black brackets below the amino acid residues represent the signature sequences and glycine-rich regions of trehalase peptides, respectively. Based on Silva et al. (Reference Silva, Terra and Ferreira2010), catalytic and essential residues required for soluble trehalase activity are indicated by gray and white arrowheads, respectively. The following soluble trehalase sequences were used in the alignment: ApTre-1 (XP_003247517.1), AyTre-1 (JQ246351), PhTre-1 (XP_002433202.1), LsTre-1 (ADR73029.1), and NlTre-1 (AEL88648.1).

Phylogenetic analysis of arthropod trehalases
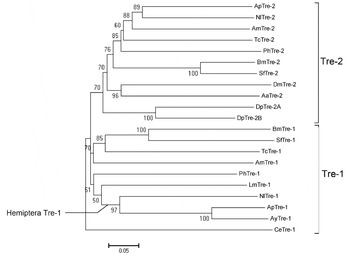
On the basis of amino acid sequence alignment of known arthropod trehalases, phylogenetic analysis was performed using MEGA5.05 (fig. 3). In the phylogenetic tree, various trehalases were grouped into two large clusters belonging to (i) soluble trehalases (Tre-1) and (ii) membrane bound trehalase (Tre-2). All hemipteran Tre-1 (AyTre-1, ApTre-1, and NlTre-1) formed a distinct subcluster as a high bootstrap value of 97% confirmed a common lineage for them. Soluble trehalase from A. glycines, AyTre-1 was grouped along with that of A. pisum (ApTre-1), the only other aphid with known sequence for a soluble trehalase. Both the putative trehalase sequences identified from genome of D. pulex were grouped with membrane bound trehalases (Tre-2).
Phylogeny of arthropod trehalase proteins. A phylogenetic tree constructed from amino acid sequences of arthropod trehalases. The evolutionary history was inferred using the Neighbor-Joining method with pairwise deletion option. The percentages of replicate trees in which the sequences clustered together in the bootstrap test (10 000 replicates) are shown (only above 50%) next to the branches. The tree is drawn to scale, with branch lengths in the same units as those of the evolutionary distances used to infer the phylogenetic tree. The scale bar represents 0.1 expected substitutions per amino acid position. The phylogenetic analysis was conducted in MEGA5.05. Trehalase were from Aedes aegypti (Aa), A. pisum (Ap), A. glycines (Ay), Apis mellifera (Am), C. elegans (Ce), Drosophila melanogaster (Dm), D. pulex (Dp), L. migratoria (Lm) N. lugens (Nl), Pediculus humanus (Ph), S. frugiperda (Sf), and Tribolium castaneum (Tc). The accession numbers for protein sequences used in phylogenetic analysis are mentioned in the Materials and Methods section.

Expression patterns of AyTre-1 in A. glycines
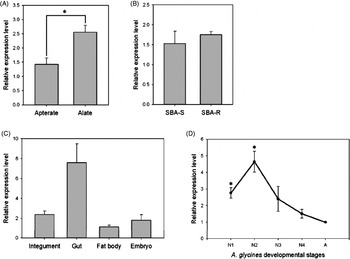
Transcript levels of AyTre-1 in apterate and alate morphs of adult A. glycines were determined by qPCR. In alate morphs, the expression of AyTre-1 was significantly higher (1.9-fold) compared with that in apterate aphids (t = − 3.40, P < 0.05) (fig. 4a). qPCR analysis revealed no significant difference of AyTre-1 expression in A. glycines fed with resistant and susceptible isolines of soybean (t = − 0.68, P = 0.53) (fig. 4b). AyTre-1 was expressed in all major tissues, i.e., integument, gut, fat body, and developing embryos (fig. 4c). Although not significantly different, the gut had the highest expression, nearly 7-fold higher as compared with fat body (t = 3.39, P = 0.07), the tissue with lowest expression of AyTre-1. Analysis in different developmental stages of A. glycines revealed that AyTre-1 is expressed in all stages (fig. 4d). However, early stages, i.e., first (t = − 5.65, P < 0.05) and second (t = − 5.78, P < 0.05) nymphal instars had significantly higher expression of AyTre-1 compared to that in adult stage.
Relative expression level of AyTre-1 as determined by qPCR in: (a) alate and apterate morphs of A. glycines. The mean (±SE) expression level is represented for three biological replicates (n = 3). Asterisk (*) indicates the significant difference at P value < 0.05 (t test) (b) A. glycines nymphs fed with susceptible (SBA-S) and resistant (SBA-R) plants. The mean (±SE) expression level is represented for three biological replicates (n = 3) (P = 0.46). (c) Different A. glycines tissues. The mean (±SE) expression level is represented for two biological replicates (n = 2). (d) Different developmental stages of A. glycines, i.e., N1, 1st instar nymph; N2, 2nd instar nymph; N3, 3rd instar nymph; N4, 4th instar nymph; A, adult. The mean (±SE) expression level is represented for two biological replicates (n = 2). Asterisk (*) indicates the significant difference of AyTre-1 with respect to the adult stage at P value < 0.05 (t test). EF1α was used as an internal reference gene in all except for expression studies of A. glycines fed with resistant and susceptible plants where TBP was reference gene (see the Materials and Methods section for details). In all cases, the relative expression was calculated based on the value of the lowest expression which was ascribed an arbitrary value of 1.

Discussion
Characterization of soluble trehalase in A. glycines
In the transcriptome database of A. glycines, we identified a single transcript encoding for a protein similar to soluble trehalase in insects. Based on bioinformatics, comparative genomics, phylogenetics and homology modeling (S. Fig. 1) analyses, the putative soybean aphid trehalase was confirmed to be a part of the soluble trehalase group, Tre-1. In the currently available transcriptomic resources for A. glycines, we also recovered partial fragments that significantly matched to membrane-bound trehalase (Tre-2). Nonetheless, soluble trehalase seems to be more important for migration in aphids (Neubauer et al., Reference Neubauer, Ishaaya, Aharonson and Raccah1980) and most relevant to the distinctive migratory behavior of the soybean aphid.
Potential role of AyTre-1 in flight activity of A. glycines
Insect flight is a highly demanding energetic behavior. Therefore, the increased trehalase expression during flight activity typical of alate morphs for insects showing wing polymorphism (Gu et al., Reference Gu, Shao, Zhang, Liu and Zhang2009) seems to be plausible as it can lead to an increased enzymatic activity to turn over trehalose into glucose. In our study, though the enhanced expression of AyTre-1 in alate morphs was statistically significant (fig. 4a), the expression difference (1.9-fold) between two morphs was not considerable enough to be conclusive. Additional studies on AyTre-1 at transcript and protein levels are required to confirm the proposed role of soluble trehalose in migration of A. glycines and among the Aphididae in general. For example, Brisson et al. (Reference Brisson, Davis and Stern2007) reported a lower expression of trehalase in alate morphs compared with that in apterate morphs using a cDNA microarray. Comparing the current study with Brisson et al. (Reference Brisson, Davis and Stern2007) suggests that difference between the two studies is related to age of aphids and state of flight activity. In our study, we used alate aphids of undetermined age but in active flight, whereas Brisson et al. (Reference Brisson, Davis and Stern2007) used fourth-instar nymph and adult (both on 2nd day) stages of A. pisum having only wing buds, but not the fully functional wings. It is therefore possible that in these early A. pisum individuals, the energy provided in trehalose was not yet required, thus the lack of trehalase expression. In addition, Neubauer et al. (Reference Neubauer, Ishaaya, Aharonson and Raccah1980) detected a 50% increase in soluble trehalase from Aphis citricola alates when compared with apterate. However, one major constraint for such comparison studies is the lack of a method for consistent wing induction in A. glycines, which makes age standardization difficult. Further standardization and refining of protocols to consistently induce wings in A. glycines would accelerate studies requiring the use of alate morphs.
AyTre-1 in A. glycines–soybean interaction
No difference in AyTre-1 expression was found among aphids feeding on susceptible and resistant plants (fig. 4b). The exact mechanism of Rag1-based resistance is unknown, but our data indicate that it does not appear to impact expression of insect trehalase. If indeed trehalose production in soybean is increased upon aphid feeding in soybean similar to GPA feeding on Arabidopsis, it may serve to activate plant defense pathways, but a counteractive response in A. glycines, i.e., increased trehalase to breakdown plant trehalose, seems to be lacking.
Tissue-specific expression of AyTre-1
Our results on expression of AyTre-1 in A. glycines gut are in agreement with earlier findings on expression of Tre-1 in S. exigua, Spodoptera frugiperda, and Bombyx mori (Mitsumasu et al., Reference Mitsumasu, Azuma, Niimi, Yamashita and Yaginuma2005; Silva et al., Reference Silva, Ribeiro, Terra and Ferreira2009; Chen et al., Reference Chen, Tang, Chen, Yao, Huang, Chen, Zhang and Zhang2010), but the role of soluble trehalase in insect gut is yet to be fully determined. In insects, the trehalose present in hemolymph can be diffused into gut and may ultimately be lost by excretion. According to Wyatt (Reference Wyatt1967), to prevent the loss of trehalose, soluble trehalase catalyzes the conversion of gut trehalose into glucose, which can readily be absorbed back into hemolymph, proposing that the major function of soluble trehalase in insect gut is to avert the loss of trehalose in hemolymph. According to Terra & Ferreira (Reference Terra and Ferreira1981), however, soluble trehalase acts as a digestive enzyme in insect gut, based on results obtained by measuring the digestive enzymes activity in the larval gut of the Dipteran Rhynchosciara americana. The trehalase activity in the midgut was found to be positively correlated with the presence of food as it decreased during starvation and increased after feeding. During these measurements, hemolymph trehalose content remained constant throughout starvation and successive feeding. Alternatively, the non-existence of trehalose and occurrence of sucrose and maltose as major disaccharides in insect diet would suggest a lack of trehalase activity for digestion.
We observed similar expression of AyTre-1 in other tissues. Surprisingly, we did not see increases in AyTre-1 in the integument or embryo despite its role in chitin synthesis pathway. Additional work using young nymphs may better indicate the role of AyTre-1, but tissue-specific dissection is difficult with soybean aphid nymphs due to their small size. The fat body is known to produce trehalase; however, Chen et al. (Reference Chen, Tang, Chen, Yao, Huang, Chen, Zhang and Zhang2010) reported that this expression is mediated by Tre-2 in S. exigua. Although we did not determine AyTre-2 expression, the low expression of AyTre-1 in the fat body opens the possibility that a similar Tre-2-based expression occurs in A. glycines. Future studies on functional characterization of trehalase across many insect orders may better reveal its functional role in specific tissues.
AyTre-1 as a target for A. glycines management
Owing to its critical role in energy metabolism and chitin-synthesis pathway of insects, trehalase enzyme and its encoding gene seem to be ideal target for pest control (Ujita et al., Reference Ujita, Yamanaka, Maeno, Yoshida, Ohshio, Ueno, Banno, Fujii and Okumura2011). Various chemical compounds such as validoxylamine (Kameda et al., Reference Kameda, Asano, Yamaguchi and Matsui1987), trehazolin (Ando et al., Reference Ando, Satake, Itoi, Sato, Nakajima, Takahashi, Haruyama, Ohkuma, Kinoshita and Enokita1991; Nakayama et al., Reference Nakayama, Amachi, Murao, Sakai, Shin, Kenny, Zagorski, Iwashita, Komura and Nomoto1991) and calystegin B4 (Asano et al., Reference Asano, Kato, Kizu, Matsui, Watson and Nash1996) are potent inhibitors of trehalase activity in insects. Inhibition of trehalase activity results in hypoglycaemia and, ultimately, the death of treated insects (Wegener et al., Reference Wegener, Tschiedel, Schlöder and Ando2003). As plants also contain trehalase, the insect specificity of trehalase inhibitors is critical for their use as insecticides. Recently, insect-specific trehalase inhibitors have been reported (Cardona et al., Reference Cardona, Goti, Parmeggiani, Parenti, Forcella, Fusi, Cipolla, Roberts, Davies and Gloster2010; Bini et al., Reference Bini, Cardona, Forcella, Parmeggiani, Parenti, Nicotra and Cipolla2012), but further research is needed before their potential to control A. glycines in field populations can be recognized. Another possible approach is to target the trehalase gene at transcriptional level through RNAi. This approach has been successful in S. exigua, as RNAi-mediated knockdown of soluble trehalase encoding gene proved lethal to the insect (Chen et al., Reference Chen, Tang, Chen, Yao, Huang, Chen, Zhang and Zhang2010). Future studies to target AyTre-1 in A. glycines through RNAi can be designed on the basis of information obtained in the current study. Previous RNAi studies in aphids are promising as A. pisum has shown a robust response to RNAi-mediated knockdown (Mutti et al., Reference Mutti, Park, Reese and Reeck2006). For a long-term strategy, this approach could prove effective for A. glycines management in the field and provide another target for novel aphid control.
The supplementary material for this article can be found at http://www.journals.cambridge.org/BER
Acknowledgements
We thank Lucinda Wallace for her assistance with soybean aphid colony rearing and help during manuscript writing. This work was supported through funds provided by the Department of Entomology, OARDC, The Ohio State University; The Ohio Soybean Council, and the North-Central Soybean Research Program.