


Political knowledge has been described as a “cornerstone construct in research on political behavior” (Mondak Reference Mondak2001, 238), influencing everything from turnout and vote choice to a person's level of tolerance and the organization of his or her political beliefs. But what determines who is informed? As one might imagine, there are a variety of explanations. Some focus on formal education (Delli Carpini and Keeter Reference Delli Carpini and Keeter1996), cognitive ability (Luskin Reference Luskin1990), or partisan motivation (Jerit and Barabas Reference Jerit and Barabas2012; Parker-Stephen Reference Parker-Stephen2013). Other accounts consider the supply of information (Iyengar et al. Reference Iyengar, Hahn, Bonfadelli and Marr2009; Jerit, Barabas, and Bolsen Reference Jerit, Barabas and Bolsen2006; Nicholson Reference Nicholson2003) or institutional variations in the media system (Curran et al. Reference Curran, Iyengar, Lund and Salovaara-Moring2009). Collectively, past research points to an array of factors influencing public awareness. Yet, this received wisdom is based on studies relying on a range of knowledge items. Scholars often use the five-item knowledge battery recommended by Delli Carpini and Keeter (Reference Delli Carpini and Keeter1996; for examples, see Hayes Reference Hayes2008; Mutz Reference Mutz2002; or Nyhan and Reifler Reference Nyhan and Reifler2010). It is not unusual, though, for researchers to construct knowledge scales from whole cloth, using items that are specific to a particular study (e.g., Prior and Lupia Reference Prior and Lupia2008; Shaker Reference Shaker2012).
There have been criticisms of the use of factual questions as an indicator of what people know about politics (e.g., Graber Reference Graber2001), but most of the discussion has focused on issues of measurement. In particular, past work had demonstrated that aspects of the interview context, such as question format, respondent incentives, and survey protocol, have powerful effects on observed levels of knowledge (e.g., Gibson and Caldiera Reference Gibson and Caldiera2009; Miller and Orr Reference Miller and Orr2008; Mondak Reference Mondak2001; Prior and Lupia Reference Prior and Lupia2008). These efforts have resulted in valuable insights regarding optimal methods for measuring political knowledge (Boudreau and Lupia Reference Boudreau, Lupia, Druckman, Green, Kuklinski and Lupia2013). Notwithstanding these advances, there remains a remarkable amount of diversity in the kinds of questions researchers use to operationalize this concept.
The present study provides a framework for understanding how the content or type of question affects observed levels of knowledge. Integrating different strands of research on public opinion, we argue that there are two theoretically relevant dimensions when it comes to understanding the variation in knowledge, dimensions that yield four distinct types of knowledge questions. Returning to several classic findings in the study of political knowledge, we consider whether the mechanisms for becoming informed—in particular, ability, opportunity, and motivation—operate differently across the four types of questions. In the case of education and media coverage, the effect of these two factors varies considerably across question type; in the case of gender, the tendency of women to seek out group-relevant information is more powerful than previously realized. Our four-part typology helps clarify the conventional wisdom regarding the antecedents of knowledge, and it suggests several lines of research regarding the use of knowledge as an explanatory variable.
POLITICAL KNOWLEDGE QUESTIONS VARY BY TIME AND TOPIC
In this study, we adopt Delli Carpini and Keeter's (Reference Delli Carpini and Keeter1996, 10) definition of political knowledge as “the range of factual information about politics that is stored in long-term memory.” As elaborated by the authors in their classic book, the factors related to knowledge are linked, in one way or another, to ability (the possession of adequate cognitive skills), opportunity (the availability of information and how it is packaged), or motivation (the desire to learn).Footnote 1 Informed by the ability-opportunity-motivation framework, subsequent researchers have explained variation in knowledge by focusing on individual-level characteristics (e.g., education) and environmental/contextual factors (e.g., media coverage). This has been a fruitful path, and the field can point to several influential articles and books on the topic of political knowledge (e.g., Althaus Reference Althaus2003; Delli Carpini and Keeter Reference Delli Carpini and Keeter1996; Dow Reference Dow2009; Nicholson Reference Nicholson2003; Prior Reference Prior2007).Footnote 2
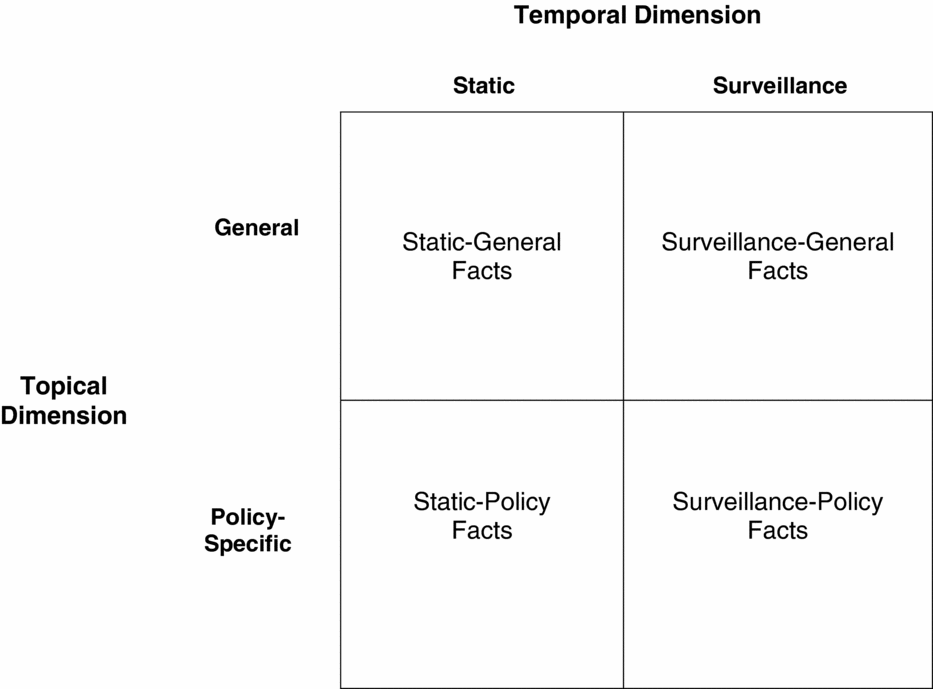
Aside from individual, environmental, and procedural determinants, two question-level characteristics influence how and whether a particular fact is learned. The first factor has to do with how recently the fact came into being (the “temporal dimension”). The second characteristic pertains to the type of fact—in particular, whether the question has to do with public policy concerns or the institutions and people/players of government (the “topical dimension”). Figure 1 illustrates that the two dimensions can be crossed to yield four theoretically relevant types of knowledge questions.
The Temporal-Topical Framework and Four Types of Knowledge Questions

The temporal (i.e., horizontal) distinction pertains to the recency of the fact. Knowledge questions may be about recent developments, or they may pertain to events transpiring months, years, or even decades ago. This temporal variation is reflected in the existing literature as researchers have focused either on civic facts that seldom change (e.g., Delli Carpini and Keeter's [Reference Delli Carpini and Keeter1996] recommended five-item knowledge index), or on questions about recent events (e.g., Barabas and Jerit Reference Barabas and Jerit2009; Jerit, Barabas, and Bolsen Reference Jerit, Barabas and Bolsen2006).Footnote 3 In his book, The Good Citizen, Michael Schudson (Reference Schudson1998) makes the case for the importance of recent, rather than older, facts. Schudson argues that citizens can “participate intelligently in governmental affairs” by scanning, rather than studying, the information environment (1998, 310; also see Graber and Holyk Reference Graber, Holyk, Semetko and Scammell2012). This model of citizenship places a premium on learning about important political developments as they happen.Footnote 4 At the other end of the spectrum, facts with greater longevity (such as the definition of judicial review or the meaning of the First Amendment) are important for the reasons outlined by Delli Carpini and Keeter (Reference Delli Carpini and Keeter1996, 64–5): namely, that these facts pertain to the rules of the game and knowledge of them is crucial for taking part in the political world (but see Lupia Reference Lupia2006).
Our interest lies in how the temporal dimension relates to knowledge acquisition. While there are various routes to learning facts that have been in circulation for a long time (e.g., the education system, discussion with friends and family, politically tinged movies or television programs), the primary way people learn about recent developments is from the mass media (Zaller Reference Zaller2003). All else held constant, levels of knowledge for recent facts should be lower relative to facts that were established years or decades ago because there have been fewer opportunities for people to acquire such facts. It should, in other words, be harder to learn recent facts unless they are covered widely in the mass media.
Turning to the remainder of Figure 1, the topical (i.e., vertical) dimension pertains to the subject of the question—in particular, whether the question has to do with public policy concerns (“policy-specific”) or whether the question asks about the institutions and people/players of government (“general”). Delli Carpini and Keeter (Reference Delli Carpini and Keeter1996, 69) make an impassioned case for the importance of general political knowledge: “Whether as a spectator or a player, to be a part of a game one must understand the rules. This is as true for the game of politics as it is for the game of baseball.” Regarding the people and players of politics, many scholars believe that in a representative democracy, citizens need basic information about who their representatives are and where those representatives stand on issues of the day. After all, in making political decisions, people often look to the positions taken by public figures (see Johnson's [Reference Johnson, Borgida, Federico and Sullivan2009] treatment of operative knowledge for a related discussion).
At the other end of the spectrum is policy-specific knowledge, a concept that has come to be associated with Martin Gilens's (Reference Gilens2001) influential article in the American Political Science Review. Gilens argues that studies based on general knowledge offer a useful, but incomplete, account of the role of information and policy preferences. The problem, Gilens observes, is that “many people who are fully informed in terms of general political knowledge are nonetheless ignorant of policy-specific information that would alter their political judgments” (2001, 380). On this view, policy-specific knowledge is distinct from general knowledge.
Moreover, this difference has implications for the acquisition of information. Policy-specific knowledge is more domain-specific than general knowledge, so the former may be hard to acquire for all but the most motivated citizens, such as specialized issue publics (Iyengar Reference Iyengar, Ferejohn and Kuklinski1990) or program recipients (e.g., Barabas Reference Barabas2009; Campbell Reference Campbell2002). Thus, as a result of differences in the motivation to acquire particular facts, the distribution of knowledge in society may vary depending upon whether a scholar is examining general political knowledge questions or policy-specific knowledge questions. In the next section, the analytic potential of the temporal-topical framework is illustrated with specific hypotheses about how question-level factors influence observed levels of knowledge.
REVISITING WHAT WE KNOW ABOUT POLITICAL KNOWLEDGE
We examine whether factors believed to affect knowledge through ability (e.g., level of education), opportunity (e.g., the amount of news coverage), or motivation (e.g., self- or group-interest) operate differently according to the type of knowledge being assessed.
Education
Decades of research have shown that individual-level characteristics are among the most powerful predictors of a person's level of political knowledge. Among the proverbial “usual suspects,” education reigns supreme. Of all the variables Delli Carpini and Keeter (Reference Delli Carpini and Keeter1996, 188) examined, education was the “strongest single predictor of political knowledge.” The reason for this powerful effect, the authors go on to explain, lies in education's relation to all three elements of the ability-opportunity-motivation triad:
[education] promotes the opportunity to learn about politics by transmitting specific information and influencing career paths and social networks; it increases the motivation by socializing students to the political world and stimulating their interest in it; and it develops the cognitive ability necessary for effective learning. (p. 190)
According to Delli and Carpini's empirical analysis, the influence of education is evident both in its direct effect on political knowledge as well as in its indirect effect, through political engagement and structural factors such as occupation and income (Delli Carpini and Keeter Reference Delli Carpini and Keeter1996, 188). The robust effect for education has been documented in scores of other studies. As far as explanatory variables go, education is the “800-pound gorilla” in research on political knowledge.
Nevertheless, the information transmitted in primary and secondary schools does not relate uniformly to subjects in the temporal-topical space. Indeed, Delli Carpini and Keeter (Reference Delli Carpini and Keeter1996, 190) observe that schools “teach particular aspects of politics, most notably the institutions and processes of government.” It is noteworthy that although dozens of studies have documented the association between education and political knowledge, the empirical analyses often focus on questions at the top of Figure 1's vertical dimension—namely, items measuring general political knowledge (e.g., Bennett Reference Bennett1988, Reference Bennett1989; Bennett and Bennett Reference Bennett and Bennett1993; Elo and Rapeli Reference Elo and Rapeli2010; Lambert et al. Reference Lambert, Curtis, Kay and Brown1988; Mondak Reference Mondak2000). There is emerging evidence that education is associated with greater levels of policy-specific knowledge (e.g., Jerit, Barabas, and Bolsen Reference Jerit, Barabas and Bolsen2006 or Barabas and Jerit Reference Barabas and Jerit2009), but the evidentiary basis for this claim is sparse.
Moreover, the logic of the ability-opportunity-motivation framework suggests that although the relationship between years of formal education and political knowledge may be evident across all four quadrants, the strength of that association will vary. For questions having to do with general political knowledge, the relationship should be strong because these topics comprise the curriculum of primary and secondary schools (Delli Carpini and Keeter Reference Delli Carpini and Keeter1996, 190). By contrast, policy-specific knowledge may exhibit a weaker relationship with education if particular issue publics (e.g., the elderly, African-Americans) are motivated to seek out information despite being otherwise disadvantaged in terms of level of education or the gains reaped from formal schooling (e.g., Dow Reference Dow2009).
Thus, we expect that level of education will have a stronger (and more positive) relationship to general measures of political knowledge than it does to policy-specific knowledge (Hypothesis 1). Given our typology, we subdivide H1 into two subhypotheses. The general statement of H1 implies that the positive effect for education will be stronger on surveillance-general facts compared with surveillance-policy facts (H1a), and that the positive effect for education will be stronger on static-general facts compared with static-policy facts (H1b). The subhypotheses correspond to the right and left portions of Figure 1, respectively.
The Mass Media
Numerous studies have shown that as political information becomes more available (e.g., in news stories and on television), levels of knowledge also increase. In one well-known study, Delli Carpini, Keeter, and Kennamer (Reference Delli Carpini, Keeter and Kennamer1994) examine whether geographical proximity to the Virginia state capitol influences political knowledge. The assumption, borne out by media content analysis, is that the availability of information is greater the closer one lives to the statehouse. Consistent with that expectation, Delli Carpini, Keeter, and Kennamer (Reference Delli Carpini, Keeter and Kennamer1994) find that people living close to the capitol are more knowledgeable about state politics than those living farther away. Others study media coverage patterns in the days or weeks prior to public opinion polls (e.g., Althaus Reference Althaus2003; Jerit, Barabas, and Bolsen Reference Jerit, Barabas and Bolsen2006; Price and Czilli Reference Price and Czilli1996). The central finding is that the level of political knowledge increases as information about particular topics becomes more plentiful. Media coverage is important because it influences the opportunity to become informed.
A distinctive feature of the existing literature is that scholars often rely on questions asking about events occurring in the recent past. This choice makes sense from a research design perspective. If one wants to estimate the causal effect of the mass media on knowledge (Barabas and Jerit Reference Barabas and Jerit2009), it is helpful to examine questions for which knowledge of the correct answer depends on exposure to information in the mass media rather than some other route (e.g., the education system). However, this research tells us little about the effect of the mass media on awareness of older, more established facts. If the causal mechanism has to do with the opportunity to acquire information, this effect should manifest most strongly on topics for which the mass media is the primary way of learning that information (e.g., late breaking events). Indeed, null results may be expected for questions falling into particular quadrants (comparatively “old” static facts).
We hypothesize that the effect of the mass media on knowledge varies along the temporal dimension of Figure 1. More specifically, we expect to observe a positive relationship between the amount of media coverage and surveillance facts, but little or no relationship between the level of media coverage and static facts (Hypothesis 2). The general form of this expectation is invariant to the topical dimension of Figure 1, so we offer two subhypotheses: the positive effect of the mass media on knowledge should be stronger for surveillance-general facts than for static-general facts (H2a) and the positive effect of the mass media on knowledge should be stronger for surveillance-policy facts than for static-policy facts (H2b).
Gender
Another notable pattern in the study of political knowledge is the tendency for women to know less than men, or what scholars have labeled the “gender gap” in political knowledge (e.g., Dolan Reference Dolan2011; Dow Reference Dow2009; Lizotte and Sidman Reference Lizotte and Sidman2009; Sanbonmatsu Reference Sanbonmatsu2003; Stolle and Gidengil Reference Stolle and Gidengil2010; Verba, Burns, and Schlozman Reference Verba, Burns and Schlozman1997). The size of gender gap varies, but differences in the level of knowledge between men and women are “consistent and relatively longstanding” (Dolan Reference Dolan2011, 97), leading Dow (Reference Dow2009, 117) to describe this pattern as “one of the most robust findings in the study of political behavior.” Although there are many explanations for this phenomenon, a recurring argument has to do with the male-centered focus of most traditional knowledge questions (e.g., Dolan Reference Dolan2011; Stolle and Gidengil Reference Stolle and Gidengil2010). When questions focus on topics that are of direct relevance to women as a group—either because they ask about female politicians or policies that concern women—the gender gap disappears and sometimes even reverses, with women having higher levels of knowledge than do men.Footnote 5 Existing research points to motivation as the key mechanism: women have higher levels of knowledge on “gendered” (i.e., gender-relevant) questions as a result of the instrumental benefits of learning particular facts (Dolan Reference Dolan2011, 98).Footnote 6
There is considerable support for the claim that female respondents are more attentive to topics having special relevance to women as a group—irrespective of whether those topics pertain to public policy (e.g., Hansen Reference Hansen1997; Stolle and Gidengil Reference Stolle and Gidengil2010) or female officeholders (e.g., Burns, Schlozman, and Verba Reference Burns, Kay and Verba2001; Dolan Reference Dolan2011; Koch Reference Koch1997).Footnote 7 Both previous empirical work and the logic of the motivational argument suggest that the reversal of the gender gap should be a robust pattern because gendered questions can—and do—occur in all the quadrants of Figure 1. Yet, this claim has not been tested empirically across the range of theoretically relevant knowledge questions. Accordingly, we hypothesize that the reversal of the gender gap in political knowledge will withstand differences in question type (Hypothesis 3). In other words, the knowledge gap between men and women will be smaller for gendered questions compared with nongendered questions in each of the four cells of Figure 1.
DATA AND METHODS
The objective of our analysis is to examine whether well-established findings in this literature are contingent upon question type using the temporal-topical framework as our guide. Testing our hypotheses requires measures of the four types of knowledge questions described above. Because no single data source contains everything we need, we created an original dataset, combining the responses of tens of thousands of individuals who answered knowledge questions across dozens of recent surveys. These surveys were augmented with media content data and other explanatory variables.
The Dependent Variable: Knowledge
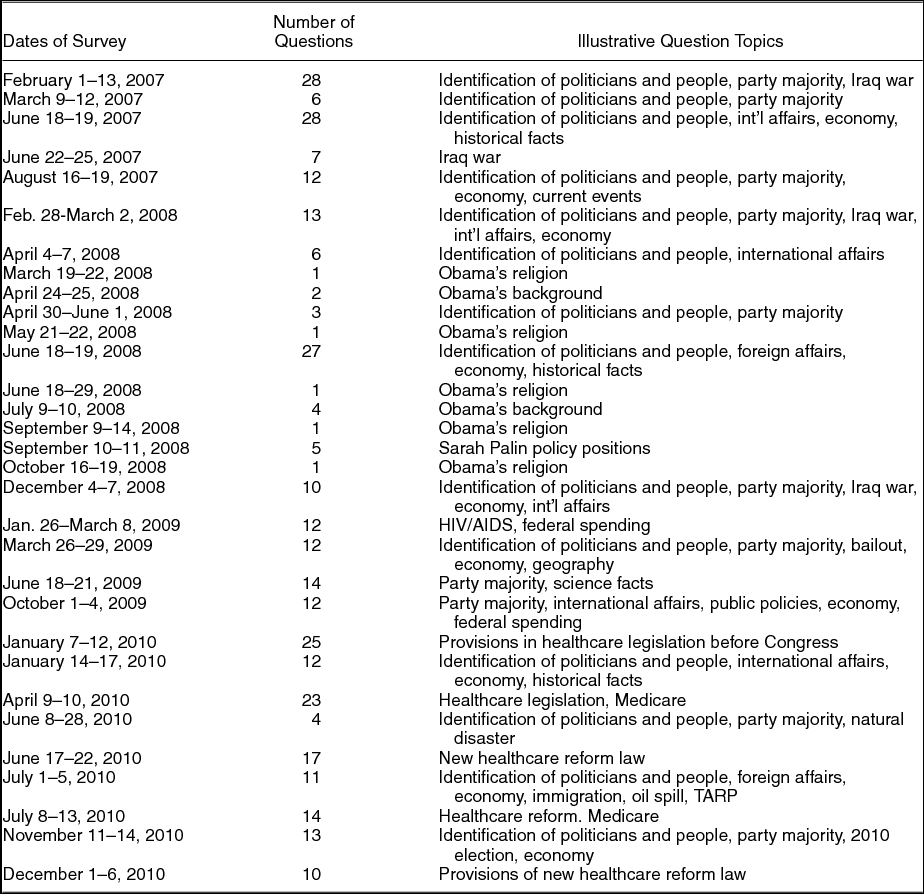
We identified knowledge questions by searching the archives of the Pew Research Center and the Roper Center for Public Opinion Research for surveys containing one or more knowledge items during the latter part of the first decade of the 2000s. The choice of the time period was a function of the media content data we accessed (discussed below). In total, we found 31 publically available surveys administered between 2007 and 2010, containing 335 knowledge questions (see the Appendix for more details). This time domain covers Republican and Democratic presidencies as well as changes in partisan control of Congress.
The surveys asked about a variety of facts, some of which were current (e.g., the unemployment rate or the amount of the national debt). Others were dated (e.g., the name of the vice president in 2007, a fact established years before the survey, or the date Iraq became an independent nation). Still others asked about details of public policy, such as the following question on health care reform legislation, asked in April of 2010: “. . .to the best of your knowledge, would you say the law will or will not. . .prohibit insurance companies from setting lifetime limits on the total amount they will spend on a person's health care” (the correct answer to which was “yes”). There also were widely used (and recommended per Delli Carpini and Keeter [Reference Delli Carpini and Keeter1993]) questions about people and players in American politics, such as the name of the Chief Justice of the Supreme Court or the Speaker of the House of Representatives. All the surveys were nationally representative telephone surveys of the U.S. administered by Princeton Survey Research Associates International, Opinion Research Corporation, or affiliates of each.Footnote 8
Independent Variables: Question- and Environmental-Level Indicators
Each knowledge question was coded for the two question-level characteristics appearing in Figure 1 (surveillance vs. static and policy-specific vs. general). For the temporal dimension, several operationalizations of recency were considered, but they all were based upon the notion of when the fact was established. For example, if a question asked about whether the Senate acted on legislation, we used the date of passage since that is when the fact became established. If a question asked who occupied a political office, we cited the date when the person formally took office. If the survey item was about the level of unemployment or the crime rate, we relied on the date of the last published government report on the subject. As one might imagine, scoring our sample of more than 300 survey questions produced a considerable range, from virtually the day before the survey to events that occurred hundreds of years ago (e.g., provisions established by the U.S. Constitution or the separation of the Sunni and Shia branches of Islam). The median event took place about six months prior to the survey, but a simple average or median split did not capture the essence of surveillance. Thus, surveillance facts were treated as those in which the correct answer was established 100 days prior to the survey; all other questions were coded as static. Approximately 43 percent of the questions were coded as surveillance facts; the remaining 57 percent were coded as static.Footnote 9
With respect to the topical dimension, two experts judged whether the content of a question was policy-relevant.Footnote 10 Positive (i.e., = 1) coding occurred for references to domestic policies, actions by Congress, or foreign policy topics. Questions having to do with the institutions of government or “people and players” were coded as 0. Of the questions analyzed here, 59 percent were coded as policy-specific (with the remainder coded as general).Footnote 11
To make some of these coding decisions more concrete, we provide examples of each question type. Beginning with the surveillance-general category (the top-right part of Figure 1), the typical item asked about elected officials who had been in the news recently, such as the following question from a December 2008 survey: “To what cabinet position has Barack Obama recently nominated Hillary Clinton?” The answer (U.S. Secretary of State) was established days before the survey went into the field. Static-general facts (top-left part of Figure 1) include the now-familiar civics questions asking about features of the government (e.g., the filibuster) or foreign leaders (e.g., prime minister of Great Britain, president of Russia).Footnote 12
Moving onto the topical dimension, the following item (from a February 2007 survey) is an example of a surveillance-policy question: “As part of his new strategy in Iraq, does Bush plan to increase or decrease the number of U.S. military forces in Iraq, or doesn't he plan to change the number of troops there?” The correct answer (“increase”) had been established one month earlier in a national address by the president. Finally, the following question from a July 2010 survey is representative of the static-policy facts we analyzed: “Do you happen to know if children born to illegal immigrants in the U.S. are automatically U.S. citizens, or are they NOT automatically U.S. citizens?” The answer (“yes, they are citizens”) was established by the opening lines of 14th Amendment to the U.S. Constitution and has implications for a variety of policies (e.g., welfare, immigration).
We also created several question-level variables corresponding to the details of survey administration because previous work has documented the importance of survey protocol (e.g., Mondak Reference Mondak2001). The measures include a variable representing the number of answer choices for each question.Footnote 13 Additionally, there were separate dummy indicators for open-ended items, questions with randomized response options, and questions whose preamble encouraged a “don't know” response (1 = open-ended /randomized answer choices/don't know encouraged; 0 = otherwise).Footnote 14 Finally, to test our hypotheses regarding the gender gap, knowledge questions were categorized according to whether the topic was of special relevance to women (1 = gendered).Footnote 15
In order to examine the effect of the mass media on knowledge, we characterized the information environment for each of the topics in our dataset. With over 300 knowledge questions, this task was a challenge. In the past, scholars have examined a small number of national or regional outlets (e.g., Druckman Reference Druckman2005; Dunaway, Branton, and Abrajano Reference Dunaway, Branton and Abrajano2010; Jerit, Barabas, and Bolsen Reference Jerit, Barabas and Bolsen2006). Here we take advantage of a comprehensive media content analysis conducted by the Pew Charitable Trusts’ Project for Media Excellence.
Beginning in 2007, the Pew Research Center launched its News Coverage Index (NCI) project. NCI data has been available 2007 and we include it through 2010 (due to the lag in survey and media availability). The NCI project samples segments from different news broadcasts and sectors, and codes stories for their subject matter, source, and date. Since 2007, the NCI has sampled more than 100 different news outlets.Footnote 16 The index provides a broad snapshot of which stories are being reported in the media at a given time and by whom. For our purposes, we are interested in the total number of stories pertaining to the people, events, and facts asked about in the knowledge questions we have selected to analyze.
The media coverage variable is the NCI count of stories concerning a given knowledge question extending six weeks back in time. Thus, for a question asking which office Hillary Clinton holds in the beginning of June 2010, we counted NCI stories having to do with Hillary Clinton from roughly the middle of April until the field date of the survey. The six-week cutoff, though somewhat arbitrary, ensures that potential learning effects of current coverage are not misidentified due to less relevant levels of coverage in the past. Story counts for separate outlets were highly correlated, so an aggregated media measure representing the total number of stories across all sectors was used in the analysis. We also logged the media terms because some cases received extraordinarily high levels of news coverage. Despite the breadth of the sources in the NCI database, we sacrifice some of the precision that comes with the manual content analysis of a small number of sources. We believe the advantages of having a more comprehensive set of outlets outweighs the disadvantages of a coarser set of media data.Footnote 17
Individual-Level Indicators
All of the surveys in this study included standard demographic variables. Education was put on a common scale ranging from 1 (8th grade completion or less) to 7 (postgraduate schooling). Income was scaled so that 1 = less than $10,000 in household income, while 9 = income greater than $150,000 per year. Age appeared in four categories, from 1 (age 18–29), 2 (age 30–49), 3 (50–64), and 4 (age 65 and older). Gender and race were coded as binary indicators (1 = female or 1 = black, 0 = otherwise). We also employed partisanship dummy indicators for Democrats ( = 1) or Republicans ( = 1), with any other designation (e.g., independents or nonidentifiers) in the baseline condition. Missing demographic responses (i.e., refusal or don't know responses) were recovered via multiple imputation and averaged to avoid the loss of cases due to listwise deletion (King et al. Reference King, Honaker, Joseph and Scheve2001).
EMPIRICAL RESULTS
In this study, the unit of analysis is a person's response to a knowledge question. Several features of our data are important to highlight. First, some individuals appear in the data multiple times because they answer several questions in the same survey. To the extent that the same person answers different knowledge questions similarly, there is clustering at the individual level. Second, particular questions might be more or less difficult for the respondents in a survey, which results in clustering at the question level. Below we describe how we use random effects (i.e., a “hierarchical” or “multilevel” model) to account for this heterogeneity across individuals and questions, along with other details about our empirical approach.
The probability that individual i answers question j correctly is represented as function of individual-level and question-level characteristics:
 \begin{eqnarray*}
&&{\rm Pr(}y_{ij} = 1{\rm )}{\rm = }{\rm logit}^{ - 1} (\alpha_i + \eta_j ^{cons} + \eta_j ^{edu} Education_i \\
&&\quad +\, \eta_j ^{fem} Female_i + \beta _{inc} Income_i +\beta _{age} Age_i \\
&&\quad + \beta _{black} Black_i + \beta _{dem} Democrat_i + \beta _{rep} Republican_i ),
\end{eqnarray*}
where the βj 's represent fixed effects, α i signifies an individual-level random intercept (which can be interpreted as the variation in individuals’ political knowledge), and the η j 's represent question-level random effects, which allow the intercept, the effect of education, and the effect of gender to vary across questions. We model the variation in the random effects as a function of dichotomous indicators corresponding to the horizontal and vertical dimensions of Figure 1 (Surveillancej and Policy Specificj , respectively) and other question-level variables described below.
To test the claim that the effect of education will be greater for general rather than policy-specific knowledge questions, we model the mean
 $\hat{\eta}_j ^{edu}$
of the random coefficient for Educationi
as a function of Surveillancej
× Policy
Specific
j
(including all constitutive terms). Similarly, to explore whether the effect of gender varies by question type, we model the mean
 $\hat{\eta}_j ^{\it fem}$
of the random coefficient for Femalei
as a function of the interaction Genderedj
× Surveillancej
× Policy
Specific
j
(including all constitutive terms). Last, to test our hypothesis about the effect of the mass media, we model the mean of the question-level random intercept
 $\hat{\eta}_j ^{cons}$
as a function of the three-way interaction log (Mediaj
) × Surveillancej
× Policy
Specific
j
(including all constitutive terms), as well as a range of variables that influence the probability of answering a question correctly (e.g., Open
Endedj
, Randomizedj
, Answer
Choicesj
, DK
Protocolj
).Footnote
18
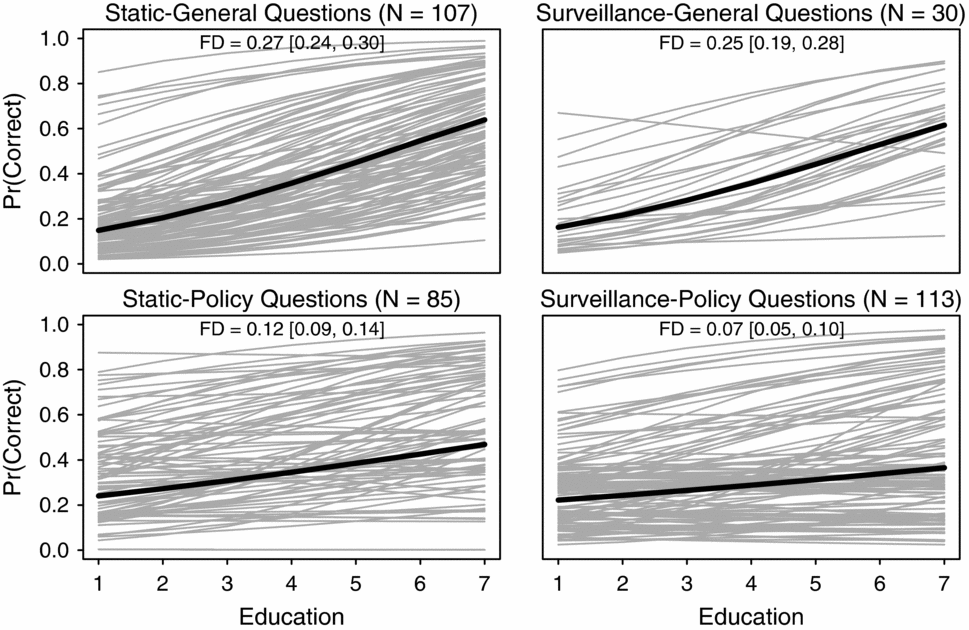
In the interpretation of coefficients, our primary quantity of interest is the first difference (FD), which represents how the probability of a correct answer changes as an explanatory variable moves from one substantively meaningful value to another (King, Tomz, and Wittenberg Reference King, Tomz and Wittenberg2000). For example, as an “average” respondent moves from a high school degree to a college degree, we estimate that the probability of giving the correct answer to an “average” static-general question increases by .27 (90% C.I. = .24 to .30). This quantity of interest is easy to interpret, but it can be difficult to compare effects across the quadrants of the temporal-topical space due to ceiling and floor effects.Footnote 19 We confirmed that our substantive conclusions hold when we examine odds ratios, which are constant across intercept shifts in logistic regression models (and thus account for ceiling and floor effects).
The Effect of Education
According to Hypothesis 1, the effect of education will vary along the topical (or vertical) dimension. Thus, education will have a stronger positive relationship to general measures of political knowledge than to policy-specific knowledge.Footnote 20 Below, we disaggregate the analyses and compare surveillance-general facts versus surveillance-policy facts (H1a) and static-general facts versus static-policy facts (H1b).Footnote 21 Figure 2 shows the results. The gray lines represent individual questions and the thick black line denotes the average pattern across questions.
The Relationship between Education and Knowledge across the Four Quadrants of the Temporal-Topical Space

Beginning with the comparison between the two quadrants on the right, the effect of increasing one's level of education is larger for general facts rather than for policy facts. As an “average” respondent changes from having a high school diploma to a college degree, the probability of giving the correct answer to a surveillance-general knowledge question (top-right quadrant) increases from .28 to .53 for a first difference of .25 (C.I. = .19 to .28). The corresponding first difference for a surveillance-policy question (bottom-right quadrant) is .07 (C.I. = .05 to .10). The difference between these two first differences (i.e., .25 minus .07) is statistically significant (p = .00), as predicted by H1a.Footnote 22
There also is support for H1b. The probability of giving the correct answer to a static-general knowledge question increases from .28 to .55 for a first difference of .27 (C.I. = .24 to .30). The corresponding first difference for a static-policy question is only .12 (C.I. = .09 to .14). In a comparison of these first differences, education has a significantly larger effect for static-general facts than it does for static-policy facts (consistent with H1b, p = .00). The contrast implied by H1b is particularly relevant because static-general and static-policy were the most commonly used questions in our survey of the literature analyzing the predictors of political knowledge. Sometimes researchers used static-general and static-policy items together; in other instances, they used one type of question or the other. Figure 2 suggests that combining the questions would blunt the impact of education, while using one or the other would result in dramatically different conclusions, with effects ranging from substantial to modest.
To further illustrate the variable effect of education, consider the comparison between static-general facts and surveillance-policy facts in Figure 2. The first difference declines by more than a third across these two quadrants (FD of .27 vs. .07; p = .00). Even people who have the most years of formal education remain ignorant of certain policy facts, as shown in a predicted percent-correct that barely reaches the 30 percent mark in the lower right quadrant (also see Gilens Reference Gilens2001). Level of education is positively related to knowledge in all four quadrants, but there are statistically significant differences in the strength of that relationship, precisely in the manner we expect.Footnote 23
Learning from Media Coverage
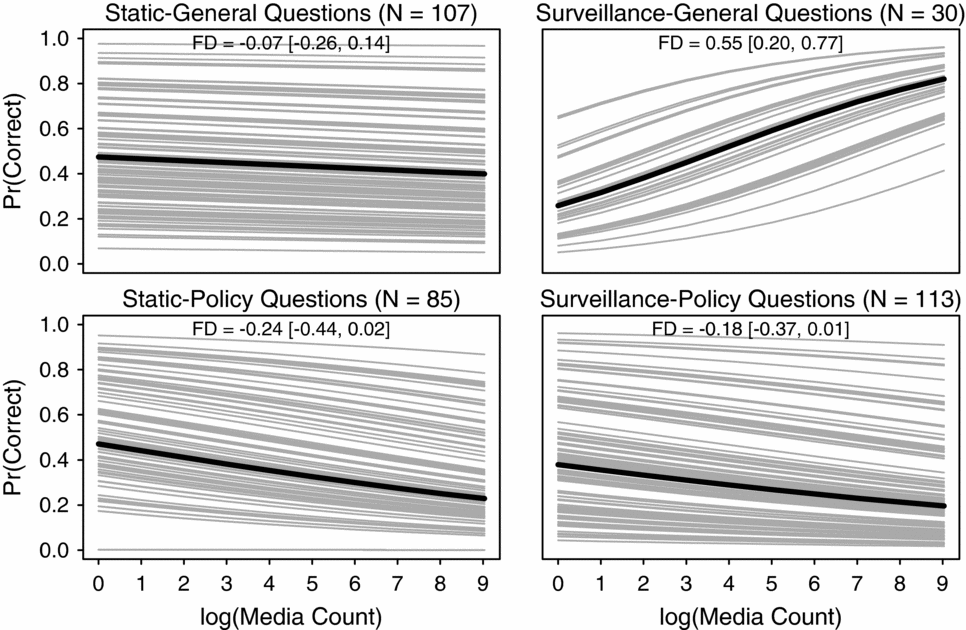
The second hypothesis states that the positive relationship between news coverage and knowledge established by previous studies will be largely confined to surveillance facts. In other words, we expect to observe a positive relationship between the amount of media coverage and surveillance facts, but little or no relationship between level of media coverage and static facts. Once again, we disaggregate H2 into two subhypotheses, one concerning the comparison between surveillance-general facts and static-general facts (H2a), and another concerning the comparison between surveillance-policy and static-policy facts (H2b). We compare low media coverage (log(count of stories + 1) = 0) to high media coverage (log(count of stories + 1) = 9), which corresponds to the minimum and maximum in our data. The results are shown in Figure 3.
The Relationship between Media Coverage and Knowledge across the Four Quadrants of the Temporal-Topical Space

Beginning with surveillance-general facts (top right quadrant), as the typical respondent changes from an information environment with low to high media coverage, the probability of giving the correct answer to a surveillance-general knowledge question increases from .26 to .83 for a first difference of .55 (C.I. = .20 to .77). This represents a substantively large effect. In contrast, the corresponding first difference for static-general knowledge questions is −.07 (C.I. = −.26 to .14). The positive effect of media coverage on knowledge (as represented by the FD) is greater for surveillance-general questions than for static-general questions (p = .00).
The bottom quadrants of Figure 3 relate to H2b, and here the evidence is less supportive. Contrary to our expectations, the effect of the mass media on surveillance-policy facts is not significant (the first difference is −.18 with a confidence interval that crosses zero). This result was unexpected, but it may be related to the difficulty of linking the media data with surveillance-policy questions, which often pertain to specific legislative provisions.Footnote 24 In the bottom left quadrant, the effect of the mass media on static-policy facts is insignificant, as expected (FD = −.24; C.I. = −.44 to .02). H3b predicts that the effect of the mass media will be larger for surveillance-policy facts than for static policy facts, but there is no significant difference in the first differences (p = .38). Notwithstanding this unexpected result, the patterns in Figure 3 illustrate the peril of disregarding differences across styles of political knowledge questions. Were one to do that in these data, there would have been an estimate of little to no effect for the mass media on political knowledge.
The Gender Gap
Our third hypothesis pertains to the reversal of the gender gap on knowledge questions that have special relevance to women (what previous scholars refer to as “gendered” topics). We predict that this reversal will obtain across the temporal-topical space, with a smaller knowledge gap between men and women for gendered as opposed to nongendered items on all four types of questions.
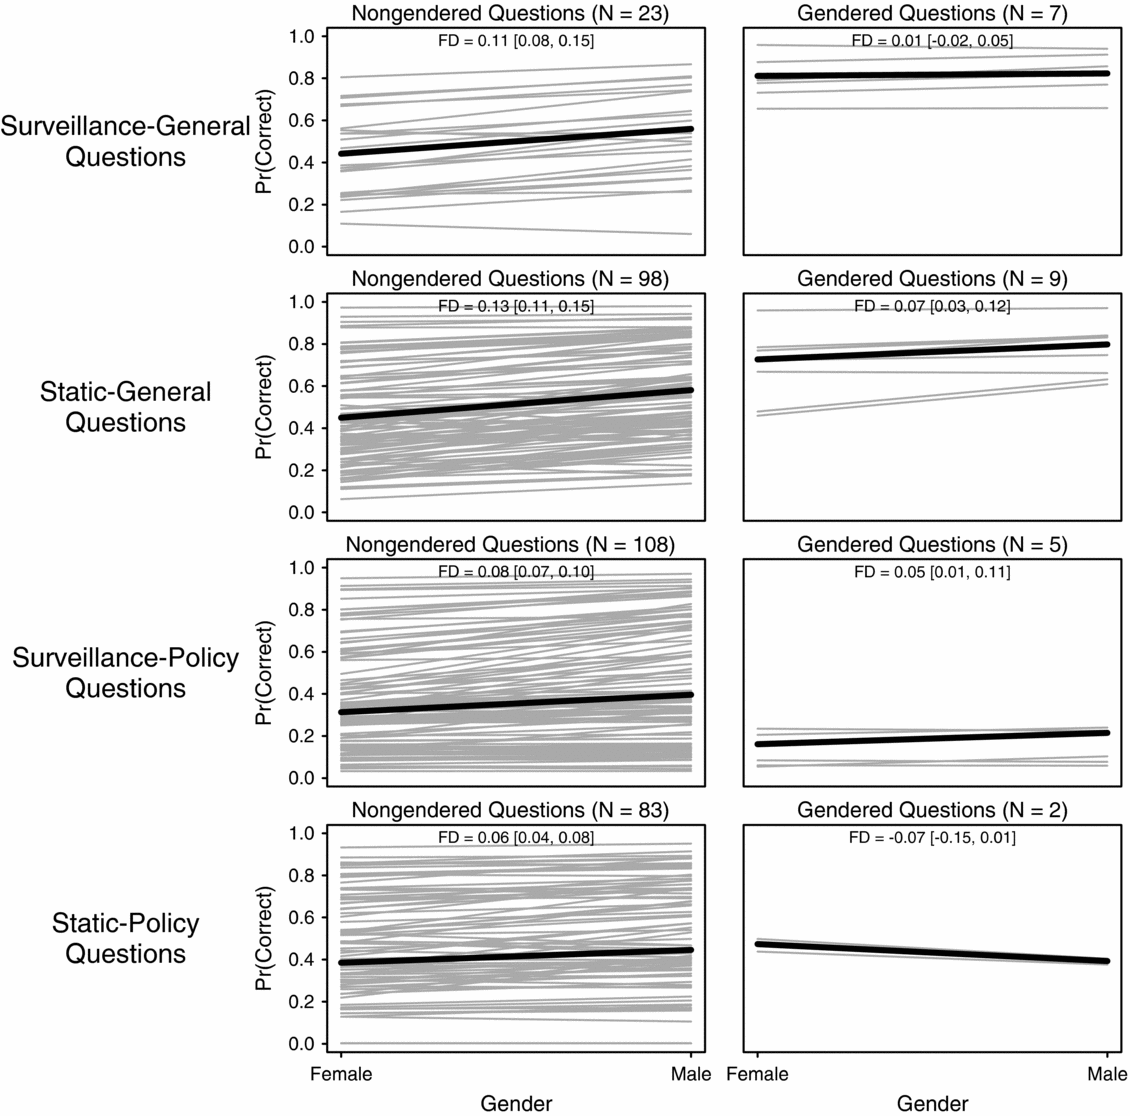
We motivate our analysis in this section by establishing that the oft-noted difference in levels of knowledge between men and women appear in our data. This is not a foregone conclusion, given the relative lack of attention to differences in the types of knowledge questions. Consistent with previous research, however, men report significantly higher levels of knowledge than do women for the four types of knowledge questions. This gap ranges from 6 to 13 percentage points (all p = .00; shown in the left-most graphs of Figure 4). Across the four theoretically relevant types of knowledge items, these disparities shrink when the topic of the question is gender-relevant.
The Relationship between Respondent Gender and Knowledge across the Four Quadrants of the Temporal-Topical Space for Gendered and Nongendered Questions

To facilitate the presentation of results, we show the results across four sets of panels. The first set of panels displays the probability of giving a correct answer to surveillance-general questions that are gendered and nongendered. Beginning with the nongendered questions (left), there is a substantial knowledge gap, with men doing “better” than women by about 11 percentage points (FD = .11; C.I. = .08 to .15). By contrast, there is a much smaller knowledge gap between the genders on gendered questions, about 1 percentage point (FD = .01; C.I. = −.02 to .05).Footnote 25 When we compare the first differences, the gap in knowledge between men and women is smaller for gendered questions than for nongendered questions, consistent with our expectations (p = .00). The second set of panels shows a similar comparison for static-general questions. On nongendered topics (left), men are more likely than women to give the correct answer by about 13 percentages points (FD = .13; C.I. = .11 to .15). The gap is smaller for gendered questions (7 percentage points), though the male-female difference remains statistically significant (FD = .07; C.I. = .03 to .12). As expected, however, the difference between these two first differences is statistically significant (p = .02). So far, the patterns are consistent with Hypothesis 3.
Moving onto the third set of panels in Figure 4, there is a modest gender gap among nongendered questions of about 8 percentage points (FD = .08; C.I. = .07 to .10), and a slightly smaller gender gap among gendered questions (FD = .05; C.I. = .01 to .11). We observe the expected pattern in which male-female differences in knowledge become smaller for gendered rather than nongendered questions, but the difference between the first differences is not statistically significant for surveillance-policy questions (p = .17). The fourth set of panels shows the analogous results for static-policy questions. On nongendered topics, men are more likely to give the correct answer by about 6 percentages points (FD = .06; C.I. = .04 to .08). On gendered items the gap reverses, with women more likely to give the correct answer by 7 percentage points (FD = −.07; C.I. = −.15 to .01). The difference between first differences in the fourth panel is statistically significant (p = .00).
DISCUSSION
Taken together, our analyses demonstrate the utility of the temporal-topical framework. Oftentimes, findings related to the effect of particular independent variables are depicted as general patterns. Our analyses suggest otherwise. Education—widely considered one of the most important predictors of political knowledge—does not confer the same benefits across different types of questions. Likewise, the salubrious effect of the mass media on knowledge seems largely confined to recent facts—and most reliably to recent general (i.e., people and player) facts. At the same time, the reversal of the gender gap is more robust than previously realized. Previous scholars have argued for the inclusion of gender relevant items in traditional knowledge batteries (e.g., Dolan Reference Dolan2011, 104). That work rests on a stronger empirical foundation because we have established that differences in knowledge between men and women become smaller when the topic is gender relevant—irrespective of the variation across types of knowledge questions.
However, for many researchers political knowledge serves as an independent, rather than the dependent, variable. Here we briefly consider the implications of our findings for the literature on “information effects” (e.g., Althaus Reference Althaus2003) and the construction of knowledge scales (which are used as an indicator of political sophistication/awareness in scores of studies). The first body of work documents differences between the collective policy preferences of actual (i.e., surveyed) opinion and a hypothetical “fully informed” public, where the latter represent people with the highest scores on knowledge questions from the American National Election Studies (ANES). The knowledge measures consist of static-general questions (e.g., the constitutional powers of federal branches) and static-policy items (e.g., which party is more conservative).Footnote 26 Across dozens of policy questions, fully informed opinion looks different than surveyed opinion: It tends to be less approving of Congress and the President, more progressive on gay rights, and more interventionist in foreign affairs—just to cite a few examples (Althaus Reference Althaus2003, 129). The key question is whether these conclusions would change if a researcher had measures corresponding to the four theoretically relevant types of knowledge items.
Our inquiry is restricted to a small subset of our surveys that had measures of all four types of knowledge as well as opinion items. Notwithstanding the limited scope of the analyses, there is some evidence that the four styles of knowledge relate to policy preferences in different ways. For example, in a survey administered in February of 2007, we explored the relationship between political knowledge and presidential approval. The relationship between a 25-item political knowledge scale and presidential approval is not significant (coeff = −.03; s.e. = .05), in contrast to the pattern observed by Althaus (Reference Althaus2003). However, when one examines subscales corresponding to each style of knowledge, the picture changes. Higher levels of static-general knowledge display the expected negative and significant relationship (coeff = −.67; s.e. = .24), while the scale for surveillance-general knowledge displays the opposite pattern (coeff = .63; s.e. = .23).Footnote 27 In this survey, the surveillance-general items tap respondents’ knowledge of the 2006 midterm election in which the Democrats took control of the House and elected Nancy Pelosi as the first female Speaker of the House. Apparently, respondents were more approving of the president if they were aware of the sweeping victories recently enjoyed by the Democratic Party in Congress.
There were several other instances in which the coefficient on the overall scale was signed differently than the coefficient on the indicator for a particular style of knowledge, and this was most likely to happen for questions pertaining to surveillance facts. In particular, on questions having to do with the Iraq War and evaluations of the Supreme Court, knowledge of recent events relates to attitudes in a way different from that of knowledge of static facts.Footnote 28 Thus, the four styles of knowledge questions are not interchangeable. Althaus (Reference Althaus2003, 286) encourages public opinion researchers to include knowledge questions along with the standard set of demographic items in all opinion surveys (so as to be able to identify information effects). We concur and note the importance of including a variety of questions, ideally from all four quadrants of Figure 1.
This recommendation relates to the practice of combining multiple knowledge questions into a scale (e.g., Zaller Reference Zaller1992).Footnote 29 The knowledge items most commonly used by scholars (e.g., those appearing on the ANES or the Delli Carpini and Keeter “recommended five”) are static-general, and to a lesser degree, static-policy questions. This pattern is important because the use of particular survey protocols—especially “don't know” encouragements and open-ended questions—is not uniformly distributed across the temporal-topical space. In our data, for example, roughly a third of the questions employ some form of don't know encouragement (see note 14). But this protocol is concentrated almost entirely among static questions. Nearly half (48 percent) of all don't know encouragements occur on static general questions, while a quarter (24 percent) appear on static policy questions. A similar pattern occurs for open-ended questions, with 75 percent occurring on static questions. There is growing evidence that open-ended questions and don't know encouragements weaken the validity of knowledge scales by increasing the likelihood of coding errors and introducing extraneous factors, such as the propensity to guess (e.g., De Bell Reference DeBell2013; Gibson and Caldiera Reference Gibson and Caldiera2009; Mondak Reference Mondak2001; Pietryka and McIntosh Reference Pietryka and MacIntosh2013). Thus, the most commonly used questions lend themselves to specific question-asking protocols that have been shown by other researchers to be problematic. Increasing the representation of surveillance questions in knowledge scales is a potential solution.Footnote 30
CONCLUSION
Political knowledge lies at the heart of research on public opinion and political behavior. And yet, for decades, scholars have operationalized this concept in different ways and with little attention to the variation in the types of knowledge questions. The present study provides a framework for theorizing about how question characteristics influence observed levels of knowledge. Our analyses reveal that several classic findings regarding the antecedents of knowledge are conditional upon the type of question being asked. In the case of education and media coverage, this conditionality occurs because the mechanisms for becoming informed (namely, ability and opportunity) operate differently across types of knowledge questions. In the case of gender, the influence of group-based motivation is more important than previously realized. In particular, the shrinking of the knowledge gap between men and women on gender-relevant topics is invariant to differences across questions. Thus, the impact of key predictors may be different from what we currently believe. Yet, the temporal-topical framework affirms rather than denies the importance of this concept by bringing into sharper focus the mechanisms underlying the acquisition of political knowledge.
Additionally, our typology may reshape scholarly thinking about the relevance of knowledge among some critics. For example, Lupia (Reference Lupia2006, 219) observes that “Most political knowledge questions are not derived from a replicable or transparent logic about how their answers bear on a voter's ability to make decisions of a particular quality in the voting booth.” Developing such a rationale may come more naturally when thinking about analytical types (e.g., surveillance-general facts) rather than the overarching concept (e.g., political knowledge). Above all, the temporal-topical framework provides a more differentiated conceptualization of political knowledge, which may create interesting possibilities for future research and, ideally, a better understanding of the causes and consequences of this important political resource.
APPENDIX
Below we provide information about the survey field periods and report model estimates corresponding to the figures in the article. Additional information about the model and auxiliary analyses appear in a Supplemental Appendix available upon request.
Survey Field Dates and Survey Topics
Table A-1 lists the field dates for the surveys used in our study and provides examples of illustrative question topics from those surveys. All surveys are publicly available from the Roper Center for Public Opinion Research or the Pew Research Center.
Surveys and Question Topics

Model Estimates
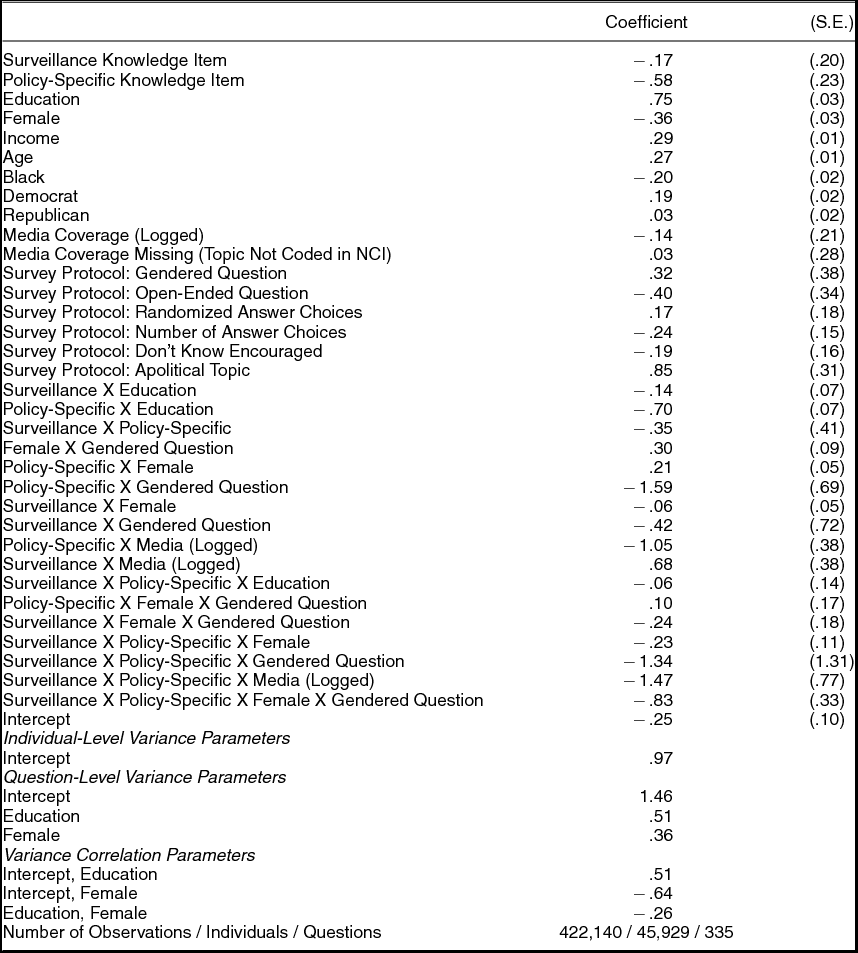
Table A-2 presents the coefficients and standard errors from the statistical model that was used to generate Figures 2–4. We estimated a hierarchical model using the “blme” package (and the bglmer function) in the R statistical software program.
Output for Hierarchical Statistical Model




Comments
No Comments have been published for this article.