I. INTRODUCTION
Recently, there is a great demand for novel high-dielectric constant (high-k) materials for improved gate, embedded and charge-storage capacitor applications.Reference Nalwa1–Reference George and Sebastian5 Although there is an impressive industry for capacitors made of inorganic materials, these materials often suffer from low-dielectric breakdown strength and poor flexibility. To overcome these limitations, polymeric matrixes with inorganic ferroelectric ceramic fillers have been tried.Reference Adikarya, Chana, Choya, Sundaravelb and Wilsonb6 The use of all-organic materials offers an alternative approach to overcoming these limitations.Reference Zhang, Ke, Huang, Zhao, Yu and Chan7–Reference Huang, Zhang and Su9 For instance, a polymer matrix embedded with Cu-phthalocyanine oligomer showed an impressive dielectric response as well as good stability and flexibility.Reference Huang and Zhang10
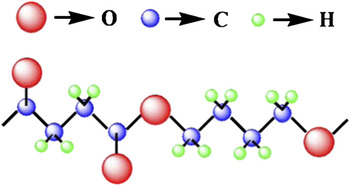
The polymer matrixes most commonly used in the preparation of high-k composites are polyimide, epoxy, and ferroelectric polymers, which include poly(vinylidene fluoride) (PVDF) and its copolymers. Because of the growing global concern on pollution control, “green” dielectrics which are biodegradable have attracted more and more attention.Reference Ke, Huang, Ren and Wang11 Poly(butylene succinate) (PBS) is a kind of biodegradable synthetic aliphatic polyester and can be decomposed by microbes without affecting the environment and ecosystem. Its chemical structure is shown in Fig. 1. It is frequently used in packing film and bags, and it has excellent mechanical, thermal, and processing properties which are similar to those of polyethylene.
Chemical structure of Poly(butylene succinate) (PBS).

PBS usually has α or β crystal polymorphs, where the β form can be found only when the material is under strain.Reference Ichikawa, Suzuki, Washiyama, Moteki, Noguchi and Okuyama12 The relationship between the dielectric behavior and crystal structure of pure PBS has been reported by Tai.Reference Tai13 However, more detailed studies are needed, and suitable nanofillers should be added into PBS to enhance its dielectric constant for practical applications as biodegradable capacitor material. Additionally, the macroscopic polarization mechanism is crucial for high-k composites and should be further studied. Herein, we report a systematic study on novel high-k all-organic nanocomposite films by using biodegradable PBS as the polymer matrix. Dielectric responses of these composites are investigated using a broadband dielectric spectroscopy method. A percolation theory and a self-consistent effective medium theory (SC-EMT) were used to model the dielectric properties of the nanocomposites, which showed good agreement between the theory and the experimental data.
II. MATERIALS AND METHODS
A. Materials
The biodegradable polymer PBS was supplied by the Technical Institute of Physics and Chemistry, Chinese Academy of Sciences. Aniline, hydrochloric acid, ammonium persulfate [(NH4)2S2O8], and dimethylacetamide (DMAC) were purchased from Beijing Reagent Co. (Beijing, China). All chemicals were of analytical grade and used as received.
B. Synthesis
Polyaniline (PANI) was chosen as the filler. PANI powders were first fabricated by conventional chemical oxidation using protonic acid as a dopant. The synthesized PANI powders were then dispersed into the organic solvent (DMAC) with ultrasonication and mixed with PBS solution under magnetic stirring. The PANI/PBS composite films with different volume fraction v of the fillers (v = 0, 3, 6, 12.5, 17.5, and 21%) were obtained by compressing molding under 10 MPa at 423 K for 4 min. The average thickness of these composite films was about 200 μm.
C. Instrumentation
PANI, PBS, and PANI/PBS composite films were characterized by Fourier transform infrared spectroscopy (FTIR; 16 PC, Perkin Elmer, Waltham, MA). The morphology of the sample was examined by scanning electron microscope (SEM; JSE-6301F, JEOL, Tokyo, Japan). For dielectric measurements, top and bottom electrodes were made by coating silver paint on both sides of the composite films. The temperature and frequency dependences of the dielectric constant were measured under a frequency response analyzer (LCR meter, Agilent 4294A, Santa Clara, CA) over a broad frequency range (1 Hz–10 MHz).
III. RESULTS AND DISCUSSIONS
A. Sample characterization
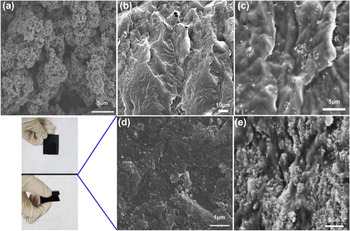
The morphologies of synthesized PANI powders and PANI/PBS composite films are presented in Fig. 2. It can be seen that the PANI powders are regular spheres with a diameter around 250 nm. They are agglomerated together owing to the high surface reactivity of nanosized PANI particles. As can be seen from Fig. 2(c), the PANI particles are homogeneously dispersed in the PBS matrix when the volume fraction of PANI is lower than the 17.5% at which the composite film is still flexible. Usually, it is hard to achieve a uniform dispersion of nanofillers via simple melt blending technology because of the poor compatibility between the fillers and the matrixes.Reference Shih, Chen and Jeng14 In the present work, we took two steps to synthesize the PANI/PBS composite films: (i) the fillers were first dispersed in an organic solution by ultrasonic treatment and fiercely stirred with the matrix material; and (ii) the organic solution was removed to form the composite films by compressing molding several times. However, when the volume fraction of PANI is higher than the 17.5%, the nanosized PANI particles agglomerate attributed to the high loading.
Scanning electron microscope images of (a) polyaniline (PANI), (b) PBS and PANI/PBS composite films at (c) v = 12.5%, (d) v = 17.5%, and (e) v = 21.5%. The photographs in this figure are PANI/PBS composite film with v = 17.5%.

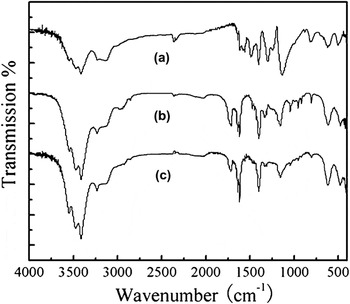
The FTIR spectra of the PANI filler, PBS host, and PANI/PBS composite film with v = 17.5% are presented in Fig. 3. In the PANI spectrum, the characteristic peaks at 1560 and 1490 cm−1 belong to the stretching vibrations of quinoid and benzenoid rings, respectively.Reference Zhang, Wei and Wan15 The bands corresponding to the vibration mode of N=Q=N ring and the stretching mode of C–N bond appear at 1140 and 1300 cm−1, respectively, indicating that the doped PANI is obtained.Reference Huang and Wan16 The PBS spectrum is characterized by free lateral carbonyl group. Since no chemical modification was used when preparing the PANI/PBS composite film, only characteristic peaks corresponding to the functional groups of PANI and PBS could be observed in the PANI/PBS composite film.
Fourier Transform Infrared Spectroscopy image of (a) PANI fillers, (b) PBS film, and (c) PANI/PBS (v = 17.5%) composite film.

B. Dielectric behavior in pure PBS
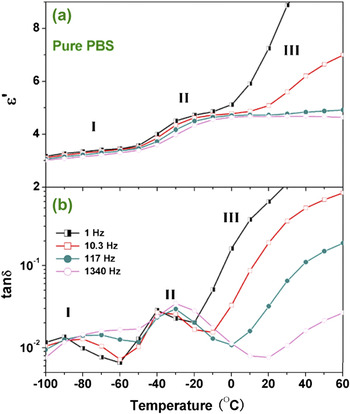
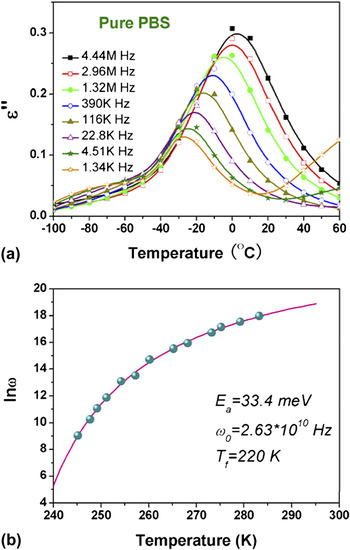
Depending on the structure, polymer molecules may show different kinds of molecular motions which lead to different types of relaxations. The temperature dependences of the real part of dielectric constant (ε′) and the dielectric loss (tanδ) of the pure PBS samples at selected frequencies are shown in Fig. 4. Three types of dielectric relaxation processes can be easily distinguished: region I (low temperature, −100 to −50 °C), region II (intermediate temperature, −50 to 0 °C), and region III (high temperature, 0 to 60 °C). A broad relaxation peak in region I can be found to move toward higher frequencies as the temperature increases, which is also accompanied by a slow transition step in the ε′ curves. This has been identified as a subglass β transition process similar to those observed in many other hyperbranched polymers when explored by dynamic mechanical analysisReference Ray, Okamoto and Okamoto17 or dielectric spectroscopy.Reference Nakamura, Saiwaki and Fukao18 The origin of such subglass transition is still an open question and it has been attributed to the reorientation of the ester groupsReference Malmstrom, Hult, Gedde, Liu and Boyd19 or to the torsional vibrations of main chains in the neighborhood of its local energy minimum conformation.Reference Tatsumi, Ito and Hayakawa20 It should be noted that the β process in PBS will evolve into an extremely broad peak with increasing probe frequencies and there is no well-defined peak maximum above 100 Hz, as shown in Fig. 4. At temperatures above −50 °C (region II), another relaxation process becomes evident. This process is usually named α relaxation in polymers and is related to the segmental movement. Figure 5(a) displays the temperature dependence of the imaginary part of dielectric constant (ε″), where the α process could be observed more clearly. The peak temperature (T m) decreases with decreasing frequencies, indicating the freezing of α dipoles.
Temperature dependence of (a) the real part of dielectric constant and (b) dielectric loss tangent, tanδ, of pure PBS at selected frequencies.

Temperature dependence of (a) the imaginary part of dielectric permittivity and (b) the mean relaxation frequency of PBS. The solid line in (b) corresponds to the Vögel–Fulcher (VF) fit by Eq. (1).

For a typical relaxation in segmental motion, the relationship between the probe frequency ω and the peak temperature T m can be described by the Vögel–Fulcher (VF) equation,Reference Ke, Fan and Huang21
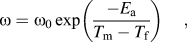
where ω 0 is the attempt frequency, E a the activation energy corresponding to the hindering barrier for the Arrhenius case (i.e., for T f = 0 K) and T f is the static freezing temperature at which ω goes to zero. T f is generally 20–50 K below the glass transition temperature T g. Applying Eq. (1) to the experimental data, we can get the fitting results of ω 0, E a and T f, which are summarized in Fig. 5(b). The freezing temperature, T f = 220 K, is about 20 K below the T g of PBS (241 K).Reference Ichikawa, Washiyama, Moteki, Noguchi and Okuyama22 The activation energy of the α glass relaxation of PBS, E a = 33.4 meV, is comparable to those of other polymers,Reference Wang, Shen, Bao, Yang and Zhang23, Reference Dantras, Dandurand and Lacabanne24 and even of relaxor ferroelectrics.Reference Ke, Fan and Huang21
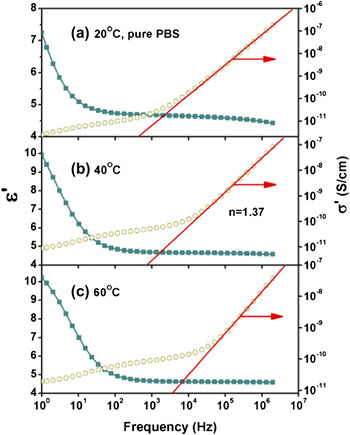
The space charge effect is evident in region III in Fig. 4, where ε′ and tanδ increase dramatically with increasing temperatures at low frequencies. As shown in Fig. 6, in the frequency domain, ε′ increases drastically with decreasing frequencies for frequencies below 100 Hz. To further investigate the space charge effect in PBS, the real part of conductivity σ′(f) was also plotted against frequency in Fig. 6. It can be seen that σ′(f) shows relative strong dispersion behavior at low frequencies and does not lead to a constant dc conductivity plateau. This implies that the low-frequency dielectric property was dominated not only by dc conduction but also by a space charge relaxation process.Reference Tai25 It can also be seen from Fig. 6 that σ′(f) displays a superlinear relationship at high frequencies.Reference Ke, Huang, Yu and Zhou26
Frequency dependence of the real parts of the dielectric permittivity and the ac conductivity of pure PBS at (a) 20, (b) 40, and (c) 60 °C.

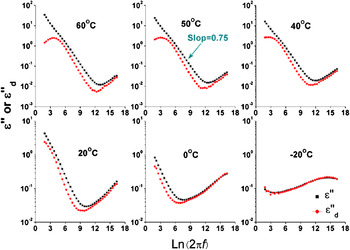
To eliminate the contribution of the dc conductivity to the ε″ spectrum, an approximately conduction-free ε″ spectrum in the frequency range can be found from the following equation.Reference Steeman and van Turnhout27, Reference Wubbenhorst and van Turnhout28
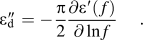
The frequency dependences of ε″ and  for PBS at selected temperatures are shown in Fig. 7. It can be seen that ε″(f) continues to rise with decreasing frequencies due to the strong contribution of dc conductivity. The slope of the logε″−logf plot in the low frequency region at 50 °C is 0.75, instead of 1, implying a low-frequency relaxation process which contributes to the dielectric spectra. By contrast, the
 (f) spectrum shows a peak in the low frequency region, indicating a space charge relaxation. It can be assigned to a Maxwell–Wagner–Sillars (MWS) interfacial polarization process,Reference Ke, Huang, Yu and Zhou26 which originates from the charge buildup at the interface between two phases of different conductivities such as the one between the electrode and polymer matrix. The interesting multiple melting behavior of PBSReference Qiu, Ikehara and Nishi29, Reference Yoo and Im30 may result in this low frequency dielectric relaxation through MWS polarization. The ε″(f) and
 (f) spectra become coincident at temperatures below −20 °C, at which the contribution from the dc conductivity is negligible.
Frequency dependence of the imaginary part of dielectric permittivity, ε″, and the calculated conduction-free ε d″.

C. Dielectric behavior of PANI/PBS nanocomposites
Percolation theory was initially proposed to analyze physical phenomena found above or below the onset of global connectivity in disordered systems.Reference Nan, Shen and Ma31–Reference Zhu, Xie, Xu and Xu33 It was later widely applied in materials research as a powerful tool to study the physical properties of heterogeneous composites.Reference Stauffer34 Near percolation, the effective dielectric constant ε eff of the composite can be described by a simple power law,

where s is a critical exponent that is different for different physical properties.Reference Nan, Shen and Ma31 Usually, the percolation is only related to geometric phase transition at the percolation threshold volume fraction v c. A new theory should be developed to explore the real physical behavior of the composite materials. Simple composite medium theories, such as the Clausis–Mossotti and the Maxwell–Garnet treatments, have been shown to reasonably predict the dielectric properties of composites at relatively low volume fraction, v ≤ 20%.Reference Wang, Song, Bao, Shen and Yang35 These simple models do not take into account the influence of the particle–particle dipolar interactions or their effect on the surrounding medium, which becomes important at higher volume fractions. Here we used the SC-EMT to calculate ε eff of the nanocomposite. Within this theory, the effects of possible interfaces in the composite can be readily modeled as a three-component (matrix, particles, and interphases) system.Reference Li, Zhang and Ducharme36, Reference Li, Huang and Zhang37 This model incorporates the effects brought by the high-dielectric constant fillers in a low-dielectric constant matrix, where localized hot spots can be generated under concentrated electric field in the matrix. The effective permittivity ε eff can be expressed as:

where the suffixes 1, 2, and 3 represent the matrix, filler, and interphase, respectively, and ar denotes the electric field concentration factor in each phase (r = 1, 2, 3). The effective medium approximation provides a reasonable estimate of ar which can be expressed asReference Hori and Nematnasser38:

where s is the depolarization factor and is 1/3 for spherical particles.Reference Yoo and Im30 The field concentration factor a 1 for the matrix can be determined from the normalization condition:
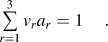
Combining Eqs. (5) and (6), Eq. (4) is then solved consistently for ε eff.
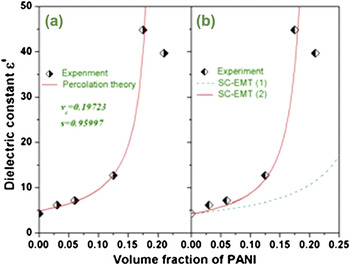
The effective dielectric constants of PANI/PBS nanocomposites obtained from the percolation theory and SC-EMT were compared in Fig. 8. The experimental dielectric constant gradually increased with increasing volume fractions of nanofillers, followed by an abrupt increase when the volume fraction of PANI reaches the vicinity of the percolation threshold v c. The giant increase in the dielectric constant is in accordance with the percolation phenomenon in which the dielectric constant of the composite films can be predicted by the power laws in Eq. (3). The obtained v c ≈19.7% for the PANI/PBS composite films is slightly higher than the theoretical percolation threshold (∼16%) for spherical conducting fillers in a polymer matrix.Reference Yoo and Im30 Since the percolation transition is a second-order phase transition, v c strongly depends on the microstructure of the composite. A percolation threshold close to 16% implies the uniform distribution of PANI nanofillers in our samples. A low v c of 4% has been obtained in nanocomposites with PANI nanofibers embedded in a poly(vinylidene fluoride) and trifluoroethylene [P(VDF-TrFE)] copolymer matrix.Reference Wang, Song, Bao, Shen and Yang35
The effective dielectric constant as a function of the volume fraction of PANI in the PANI/PBS nanocomposites fitted by (a) the percolation theory and (b) the self-consistent effective medium theory model.

To get a deeper understanding on the influence of PANI nanoparticles, Eq. (4) was used to simulate the experimental data shown in Fig. 8. For PANI/PBS composite films, we chose the dielectric constant for matrix to be  and that for the interface to be
 . Through fitting, we got the dielectric constant for PANI to be
 and l/r = 0.02, where r the radius of nanofiller particle and l the thickness of the interphase. It is clear from Fig. 8(b) that the SC-EMT simulation is able to capture the main feature of the effective dielectric constant, similar to the insulator–conductor percolation theory. The interfacial effect was also important for the PANI/PBS composites, without which the theoretical results deviate far away from the experimental one as shown in Fig. 8(b). The dielectric constant of pure PANI obtained through fitting was 43,000, which is consistent with experimental data.Reference Krause and Bohon39 It should be noted that this value is also sensitive to doping and frequency. The exchange coupling length, estimated by l/r = 0.02, is ∼5 nm, which is close to that of P(VDF-TrFE)-based all-organic composites (4 nm).Reference Li40 Within the SC-EMT, the exchange coupling between the matrix and filler can lead to much higher enhanced polarization in the exchange layer,Reference Bhadra and Khastgir41 thus dramatically enhancing the dielectric constant of the all-organic composites. It is worth noting that the exchange coupling in the interphase may be assigned to a type of MWS interfacial polarization process. A discrepancy between experimental and calculated dielectric constants was observed at a volume fraction of 21%. This discrepancy may be attributed to the porosity in the composite films, which was theoretically predicted to form substantially above a certain threshold volume fraction.Reference Calame42
Figure 9 shows the dielectric constant and loss tangent of the PANI/PBS nanocomposites at room temperature over the frequency range of 1 kHz–1 MHz. It can be seen that the dielectric constant is almost independent of frequency when the volume fraction of PANI is far below v c. However, as the volume fraction is in the neighborhood of v c, the dielectric constant shows strong frequency dispersion in the measured frequency range. This dispersion is mainly due to the MWS interfacial polarization of PANI/PBS nanocomposites. When the volume fraction is large enough, there is plenty of charge accumulated at the insulator (PBS)/conductor (PANI) interface. With increasing frequencies, orientation polarization of the dipoles formed at the insulator/conductor interfaces cannot well follow the change of electric polarity, which shows a decreasing dielectric constant. It should be emphasized that the dielectric loss tangent of the percolative PANI/PBS composites remains at a low level (∼0.2), which is much lower than many other percolative composites (usually over 1).Reference Yuan, Dang, Yao, Zha, Zhou, Li and Bai43–Reference Dang, Wang, Yin, Zhang and Lei45 For instance, the tanδ of PANI/PVDF composite reaches 0.85 in the neighborhood of v c.Reference Yuan, Dang, Yao, Zha, Zhou, Li and Bai43
Frequency dependence of (a) the real part of dielectric constant and (b) loss tangent of PANI/PBS nanocomposites.

D. Glass transition dynamics in PANI/PBS nanocomposites
It has been known that the segmental motion relaxation mode observed in polymer systems exhibits VF temperature dependence, which can be described by Eq. (1). As mentioned above, the relaxation time of α process in pure PBS exhibits VF temperature dependence. It is then interesting to investigate the effect of PANI fillers on the glass transition dynamics of the PANI/PBS composites.
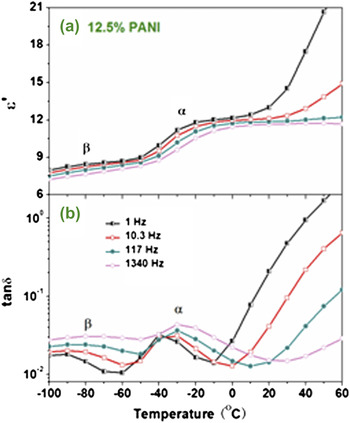
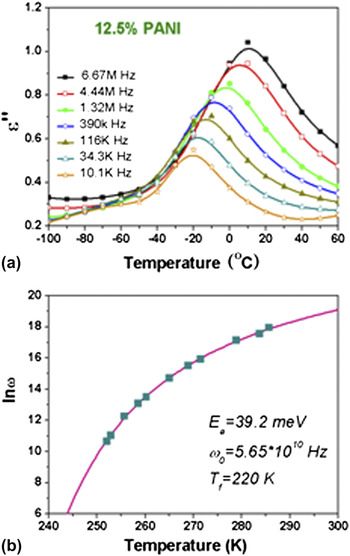
Figure 10 displays the temperature dependences of the real part of dielectric constant (ε′) and the dielectric loss tanδ of the composite with 12.5% PANI. All the three relaxation processes (α, β, and space charge relaxation processes) can be clearly identified, which are similar to that of pure PBS (Fig. 4). The temperature dependence of ε″ for the composite film with 12.5% PANI at selected frequencies is plotted in Fig. 11(a). Figure 11(b) shows the best fitted curve of the α relaxation mode using Eq. (1) with fitting parameters T f =220 K, E a=33.4 meV, and ω 0=5.65 × 10¹⁰ Hz.
Temperature dependence of (a) the real part of dielectric constant and (b) loss tangent, tanδ, of PANI/PBS nanocomposites with v = 12.5% at selected frequencies.

Temperature dependence of (a) the imaginary part of dielectric constant and (b) the mean relaxation frequency of PANI/PBS nanocomposites with v = 12.5%. The solid curve in (b) is the VF fitting.

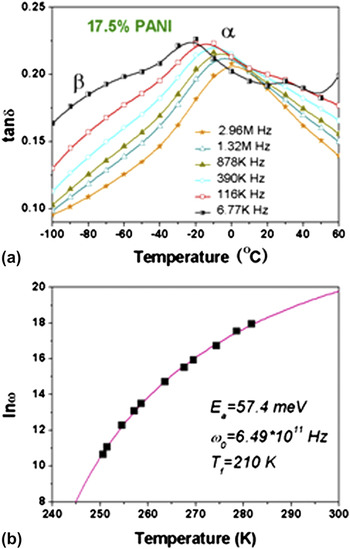
Due to the strong contribution from MWS relaxation and high dc conductivity, α and β modes of the PANI/PBS nanocomposites in the vicinity of v c start to merge as shown in Fig. 12. However, the dielectric peak of α mode can still be clearly seen from the temperature dependence of tanδ plots as shown in Fig. 13. Figure 14 shows the important results on the volume fraction dependence of the parameters obtained by the VF equation [Eq. (1)]. It could be seen that the freezing temperature T f, the attempt frequency ω 0, and activation energy E a of the composites remain almost constant and independent of the amount of PANI for volume fraction less than 12.5%, whereas all of them change dramatically with further increasing of PANI above this value.
Temperature dependence of (a) the real part of dielectric constant and (b) loss tangent, tanδ, of PANI/PBS nanocomposites with v = 17.5% at selected frequencies.

Temperature dependence of (a) the imaginary part of dielectric constant and (b) the mean relaxation frequency of PANI/PBS nanocomposites with v = 17.5%. The solid curve in (b) is to the VF fitting.

Parameters reproduced by the VF fitting for PANI/PBS nanocomposites as a function of volume fraction of PANI. The dashed curve is a fitting of E a by the percolation theory.

It is known that PANI has high intrachain rigidity coupled with strong interchain hydrogen bonding, where even simple main chain molecular motions are highly hindered.Reference Bhadra and Khastgir41 It is then expected that it will not affect the molecular motions of PBS too much when the loading level of PANI is low. A conclusion drawn from Fig. 14 is that the exchange coupling between PBS and PANI is weak when the volume fraction of PANI is less than 12.5%. It is interesting to find that the activation energy and the attempt frequency can also be well described by the percolation theory [Eq. (3)], as shown in Fig. 14. The obtained percolation threshold is around 22%, close to the value derived from Fig. 8. The interparticle distance S of composites could be simply calculated by,Reference Huang and Zhang46
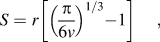
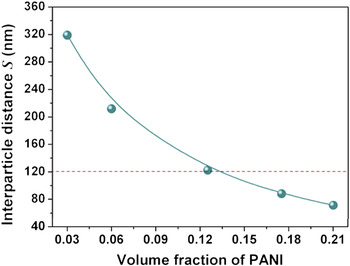
where r is the diameter and v is the volume fraction of fillers. Here, we consider PANI as spherical particles with an average diameter of 250 nm. The interparticle distances of PANI particles are estimated according to Eq. (7) and are illustrated in Fig. 15. The value of S ranges from 320 nm to 120 nm for 3% ≤ v ≤ 12.5%. The almost constant freezing temperature T f implies that the main chain molecular motions of PBS were almost unaffected by a small amount of PANI, which may be because of the large interparticle distance and rigidity nature of PANI. When the volume fraction increases, the average interparticle distance will decrease and then a percolation microstructure will be gradually formed.
Interparticle distance S calculated according to Eq. (7).

IV. CONCLUSIONS
In conclusion, novel PANI/PBS composite films are successfully prepared by a solution-cast and hot-pressing method. It is found that this method leads to a good dispersion of PANI in the PBS matrix. The dielectric constant of the composite film can reach 45, almost 10 times that of pure PBS, when it approaches a percolation threshold v c ≈19.7% and the dielectric loss remains less than 0.2 at 1 kHz. The enhancement in dielectric constant can be ascribed to the exchange coupling interphase-induced MWS polarization. The low-dielectric loss can be attributed to the good dispersion of semiconducting PANI particles in PBS matrix. The PANI/PBS composite films may have potential applications as “green” dielectric materials.
ACKNOWLEDGMENTS
This work is jointly supported by the project of the Fundamental Research Funds for the Central Universities (2011PY0180, 2011PY0179, 2011PY0181), the Key Project of Chinese Ministry of Education (Project No. 107023), the Hong Kong Polytechnic University (Project Nos.A-PJ46, A-PK30, and A-SA11) and the special co-construction project of Beijing City Education Committee.