INTRODUCTION
The accelerator mass spectrometry (AMS) technique is the most common technique used in radiocarbon (14C) dating. The procedure of the age determination using this technique is divided into two parts: sample preparation and measurement. The sample preparation includes mechanical and chemical processes of cleaning, combustion, graphitization, and pressing into the sample holder. The last two steps can be omitted in AMS systems with gas sources, by which the sample transfer into the source is completed post combustion (i.e. into the elemental analyzer (EA) or in vacuum line) (Ruff et al. Reference Ruff, Wacker, Gäggeler, Suter, Synal and Szidat2007). In the traditional technique, a mixture of elemental carbon (graphite) obtained from the sample and iron is pressed into an aluminum holder and inserted as a cathode into the cesium sputter ion source.
The graphitization process is based on the catalytic reduction of CO2 samples to graphite (elemental carbon) on Fe powder in the presence of H2 gas (Vogel et al. Reference Vogel, Southon, Nelson and Brown1984, Reference Vogel, Southon and Nelson1987). Instead of Fe powder other reducing agents can be used, such like Ni, Mn, Zn, or TiH (i.e. Jull et al. Reference Jull, Donahue, Hatheway, Linic and Toolin1986; Slota et al. Reference Slota, Jull, Linick and Toolin1987; Xu et al. Reference Xu, Trumbore, Zheng, Southon, McDuffee, Luttgen and Liu2007). The process can be completed in sealed tubes (Kitagawa et al. Reference Kiatagawa, Masuzawa, Nakamura and Masumoto1993; Xu et al. 2007) in a vacuum line (Czernik and Goslar Reference Czernik and Goslar2001; Nadeau et al. Reference Nadeau, Grootes, Schleicher, Hasselberg, Rieck and Bitteling1998), and can be fully automated in a graphitization system like AGE (Wacker et al. Reference Wacker, Němec and Bourquin2010).
A new system for the preparation of graphite targets for AMS measurements of 14C concentration has been built in the Dendrochronological Laboratory at AGH-UST Kraków. This system consists of equipment for mechanical and chemical sample pretreatment, a vacuum line for sample sealing and purification of CO2, and a graphitization line where reduction of CO2 on iron powder occurs. Cathodes produced in this system were measured in a few AMS laboratories, including the Poznan Radiocarbon Laboratory, Direct AMS Radiocarbon Business Unit, Seattle, Center for Applied Isotope Studies at the University of Georgia, and at the Leibniz-Laboratory at the University of Kiel.
SAMPLES AND METHODS
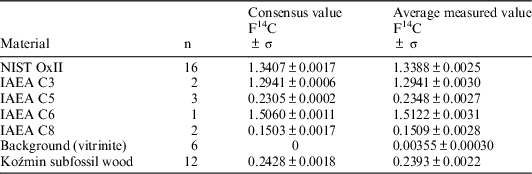
The quality tests for AMS graphitization line were performed using IAEA standards C3, C5, C6 and C8, NIST OxII, and vitrinite (used as a background material). In addition, subfossil wood from Koźmin (Table 1), with a consensus value of 24.28±0.18 pMC, was used to test the procedure of α-cellulose extraction. The sample proceeds from a previous project described given in Dzieduszyńska et al. (Reference Dzieduszyńska, Kittel, Petera-Zganiacz, Brooks, Korzeń, Krapiec, Pawłowski, Płaza, Płóciennik, Stachowicz-Rybka and Twardy2014) and was measured on numerous occasions to control the cellulose extraction from wood samples.
Measured and consensus values of the standard samples used during the tests.

For the α-cellulose extraction from wood the Green (Reference Green1963) protocol was applied (Figure 1). To accelerate the separation of single cellulose fibers from wood samples, and thus to increase the penetration of reagents, an ultrasonic bath was utilized (Pazdur et al. Reference Pazdur, Korput, Fogtman, Szczepanek, Hałas, Krąpiec and Szychowska-Krąpiec2005). Wood samples were dried and cut into shavings, then weighed and placed into glass tubes. Each 1 g of sample was added to 175 mL of deionized water, 2.5 g of sodium chlorite, and 1.7 mL of acetic acid. Each glass tube was then placed in an ultrasonic bath kept at 70°C for one hour, and then 2.5 g of sodium chlorite and 1.7 mL of acetic acid was added to each 1 g of sample. This procedure was repeated five times, and the sample were then rinsed with hot deionized water up to neutral pH. This process removes most of the lignin and the remaining sample consists mostly of holocellulose. For the next step, 75 mL of 10% NaOH solution was added to the samples and then put into an ultrasonic bath at 70°C for 45 min. After the solution was removed, the sample was rinsed with 50 mL of cold deionizing water. Next, 67 mL of 17% NaOH solution was added and samples were put into ultrasonic bath at room temperature for 45 minutes. After this time 50 mL of deionizing water was added to the samples. This step removes rest of the remaining lignin and holocellulose. The sample were then rinsed with hot deionized water up to neutral pH. Finally, 20 mL of 1% HCl was added to the samples and the samples were rinsed to neutral pH. The obtained α-celullose was dried overnight at 70°C.
Scheme of α-cellulose extraction used for the wood samples, as given by Green (Reference Green1963), with further modification described in Pazdur et al. (Reference Pazdur, Korput, Fogtman, Szczepanek, Hałas, Krąpiec and Szychowska-Krąpiec2005).

IAEA and NIST OxII standard material were converted to CO2 without pretreatment. Background material (vitrinite) was prepared by an acid-alkali-acid extraction (AAA) to remove inorganic (carbonates) and organic components (fluvic and humic acid). For combustion to CO2, samples were transferred into a pre-baked (900°C) quartz ampoules together with CuO and Ag (Figure 2a), evacuated to a pressure of 10–5 mbar, sealed and combusted for 4 hr at 900ºC in a muffle oven (Czernik and Goslar Reference Czernik and Goslar2001). The resulting CO2 was released under vacuum and cryogenically purified for subsequent graphitization.
(a) Tube with sample, CuO, and Ag wool. Both (b) and (c) show the vacuum line for graphite preparation, illustrating ports I to V: 1 – tube with Fe catalyst and electric furnace; 2 – tube with cooling trap; 3 – pressure transducer’; 4 – gas piston with sample CO2.

For the reduction of CO2 to graphite, a 5-port containing system was constructed, similar to the systems used at the Leibniz-Laboratory (Nadeau et al. Reference Nadeau, Grootes, Schleicher, Hasselberg, Rieck and Bitteling1998). Each port is made of a 3/8″ Cajon Ultra Torr steel tee and a 1/4″ Swagelok tee welded together, connecting a 3/8″ quartz tube, a pressure transducer (Swagelok S-Model), a cold finger (3/8” quartz tube), a sample port, and a 1/2″ manifold (Figure 2b, c).
Each reduction port contains two manual valves to connect the sample gas piston and the manifold. The central manifold is connected to a vacuum pump (Pfeiffer Hi-Cube) and a 3-line gas port, delivering O2, H2, and Ar. Heating of each graphitization port is completed by electric furnaces with a temperature control system (self-made). During graphitization, the cold fingers for water separation are cooled using a dry ice/ethanol slurry (~177 K). The effective reaction volume of ports 1–5 were estimated to be ~ 11.2–12.3 cm3, equivalent to ~ 165–181 mbar CO2 (0.08 mMol) per mgC. Sample CO2 is graphitized with H2 over Fe powder, used as a catalyst (pure iron, Merck No. 3815, lot 528K735615, <10 µm), giving the Bosch-reaction (Dee and Ramsey Reference Dee and Ramsey2000; Nadeau et al. Reference Nadeau, Schleicher, Grootes, Erlenkeuser, Gottdang, Mous and Willkomm1997; Vogel et al. Reference Vogel, Southon and Nelson1987):
 $$CO_{2} {\plus}2H_{2} \mathop\hscale800%{\to}^\limits{550 {\minus} 600^{\circ}C;\,Fe\ catalyst}} C{\plus}2H_{2} O.$$
For CO2 reduction, we used a H2/CO2 ratio of ~3 (by volume) and a Fe/C ratio of 2 (by mass). Before reaction, the catalyst is conditioned via oxidation (with ~700 mbar O2 at 400°C for 15 min), reduction with hydrogen (~700 mbar H2 at 400°C for 30 min), and evacuation post both these processes.
The process of sample CO2 graphitization is monitored and controlled by manual pressure recordings at 5-min intervals. The success of graphitization is further evaluated by calculating the pressure deduced efficiency EF p (Osborne et al. Reference Osborne, McNichol, Gagnon, Hutton and Jones1994):
 $$EF_{P} {\equals}{{P_{{all\_start}} {\minus}P_{{all\_end}} } \over {3{\;\asterisk\;}P_{{CO2}} }}$$
with P all_start being the sum of selected CO2 – (165–181 mbar=1 mg C) and H2-pressure, P all_end the recorded end-pressure (ideally containing only the surplus of added H2), and P CO2 the selected amount of CO2 sample for graphitization. All targets prepared contain approximately 1 mg of carbon.
Four series of samples were prepared and then sent as a C-Fe powder to be measured in four different AMS laboratories (see Table 1). One series has been sent to Leibniz-Laboratory in Kiel, from which we also got details of the performance of our cathodes.
RESULTS OF TESTS
Graphitization
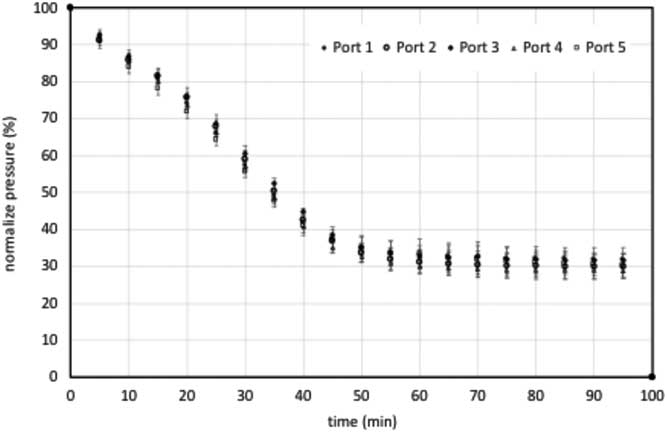
The performance of each graphitization port was checked by controlling the amount of CO2. A total of 25 pressure records (Figure 3) from all five ports were analyzed to calculate the efficiency of converting CO2 into graphite. It shows that the graphitization process is completed after approximately 65 min. According to equation (2), the efficiency EF p is >95% for all five ports, and the measured end pressure is approximately 3.7% higher than the theoretical values [P all_start – (3 · P CO2 )].
The CO2 pressure during graphitization at each of the five ports of the graphitization line.

AMS Measurements
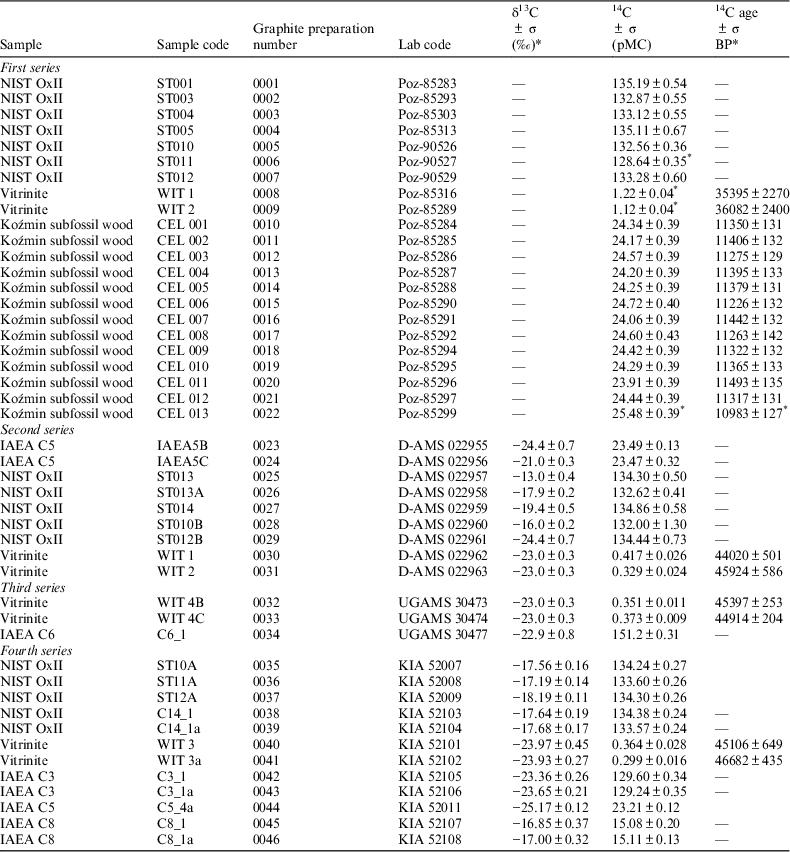
The first series of samples was measured in the Poznan Radiocarbon Laboratory and included 7 samples of NIST OxII, 2 samples of vitrinite as background materials, and 13 samples of our internal standards (Koźmin, samples CEL 1-13), with a consensus value of 24.28±0.18 pMC (see Table 1). An average value of 23.93±0.22 pMC was obtained from twelve measurements and corresponds well with expected value (Michczynska et al. Reference Michczyńska, Krapiec, Michczyński, Pawlyta, Goslar, Nawrocka, Piotrowska, Szychowska-Krąpiec, Waliszewska and Zborowska2018). One sample (CEL 13) was excluded from the calculated average value due to a higher pMC value compared to samples CEL 1-12, this is probably caused by contamination during sample handling.
The second (NIST-OxII, IAEA C5, and vitrinite) and third series (IAEA C6, and vitrinite) of samples were submitted for AMS-measurements at the Direct AMS Radiocarbon Business Unit, Seattle, USA (Labcode D_AMS), and the Center for Applied Isotope Studies at the University of Georgia, USA (Labcode UGAMS), respectively.
The fourth series of samples, consisting of IAEA C3, C5, C8, NIST-OxII, and vitrinite samples, were submitted to the Leibniz-Laboratory of the University of Kiel (Labcode KIA, Table 2). The 14C/12C and 13C/12C ratios were measured using the t HVEE 3MV Tandetron 4130 accelerator mass spectrometer (AMS) (Nadeau et al. Reference Nadeau, Schleicher, Grootes, Erlenkeuser, Gottdang, Mous and Willkomm1997). For all four series, the sample 14C/12C ratio was normalized to the NIST OxII standards (SRM 4990C; National Institute of Standards and Technology), including in each set of the samples. The 14C/12C ratios were corrected for isotope fractionation using the AMS measured δ13C. The high energy 13C3+ current was held between 200 and 300 nA, and the average current yields of the targets varied by no more than 3%. For only one of the seven cathodes of modern standards (OxII and IAEA C3) the external scatter, calculated as the standard deviation of at least 9 measurement intervals at 6 min each, is higher than the uncertainty calculated using the counting statistic
The results of 14C AMS measurements of the samples prepared using the graphitization line in the Dendrochronological Laboratory at AGH-UST Krakow. The AMS measurements were completed at four different laboratories: Poz – Poznan Radiocarbon Laboratory, D-AMS – Direct AMS Radiocarbon Businesss Unit, Seatle, UGAMS – Center for Applied Isotope Studies at the University of Georgia, and KIA – Leibniz Laboratory at the University of Kiel.

* — value rejected from calculations. δ13C values obtained from AMS measurement.
The samples of vitrinite were prepared in order to check the background range and were included in each of the four sets of samples. The average value of measured background, except for measurements done in Poznan Radiocarbon Laboratory, is 0.355±0.030 pMC, and is comparable with values reported by other laboratories (Krajcar-Bronić et al. Reference Krajcar-Bronić, Horvatinćić, Sironić, Obelić, Bareśić and Felja2010; Molnar et al. Reference Molnar, Janovics, Major, Orsovszki, Gonczi, Veres, Leonard, Castel, Lange, Wacker, Hajdas and Jull2013). The results from Poznan Radiocarbon Laboratory are much higher (1.17±0.40 pMC), which can probably be explained by leakage during sealing or graphitization of the samples. In order to check the memory effect of all five ports, each time, vitrinite samples were graphitized directly after the graphitization of samples with a high radiocarbon content (NIST OxII or IAEA C6). The results do not show any memory effects in the vacuum line and at the graphitization ports. The results of all four series are presented in Table 2. For each sample the background correction was applied using the average of the measured values for the vitrinite for each of the series.
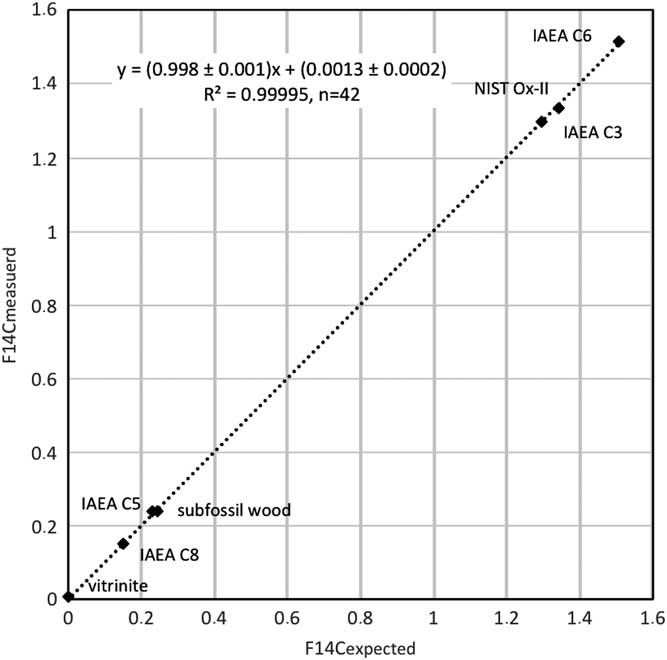
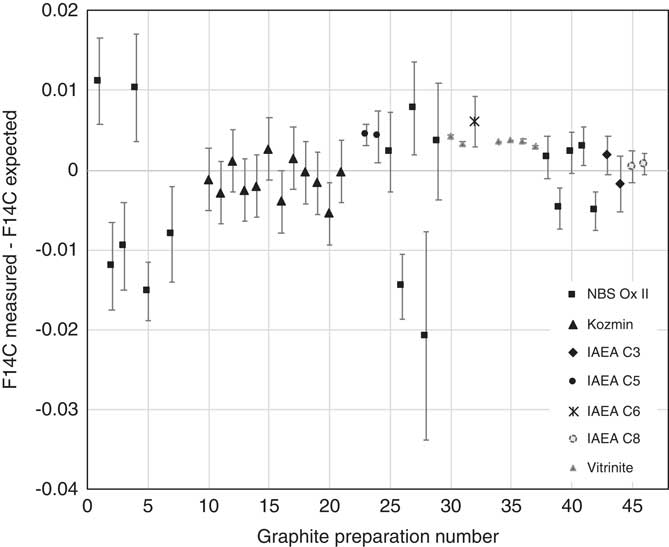
The relationship between measured and expected values for all reference samples is presented in Figure 4. As shown in the figure, measured values correspond reasonably well to the consensus values, with a correlation coefficient R2=0.999 and a slope of a=0.999±0.001. However, the intercept b=0.0012±0.0002 is slightly higher than 0, which may lead to a systematic shift of the obtained values. However, Figure 5 presents the differences between the measured F14C values and the expected values for each standard sample. For most of the samples, there are no significant differences between the measured values and the consensus values.
Relationship between the measured and expected value of F14C for IAEA and NIST OxII standard samples, background material (vitrinite), and Koźmin subfossil wood.

The difference between the measured and expected F14C value for IAEA C3, C5, C6, C8, and NBS OxII standards, vitrinite, and subfossil wood samples Koźmin used as an internal standard for the α-cellulose extraction. The graphite preparation numbers are given in Table 2, in which the rejected values are listed.

The biggest scatter can be observed for the batch of NIST OxII standards measured at the Poznan Radiocarbon Laboratory, with an average value of 133.68±0.47 pMC. We believe this to be attributed to problems during sample preparation during the first stage, when our system was still in the development phase, but it may also be related with performance of our graphite in the cesium sputter ion source during the measurement, since the differences in C/Fe ratio between samples may lead to instability of the target current in the source and to additional isotopic fractionation.
The average difference between measured FMC value and consensus value for NIST OxII and vitrinite were −0.00364 and +0.00355, respectively. In this case, the 14C activity of the source from foreign carbon must have a 14C concentration between these corresponding values.
The tests conducted until now show that the line is ready for routine operation for graphite preparation of organic sample for AMS 14C measurements, however, there is a need for further tests to determine the background dependence of the mass of sample and to extend the use of the line for other types of samples such as bone material, carbonates, etc. Further sample preparation and tests are planned for the near future.
CONCLUSIONS
A new system for sample graphitization for radiocarbon dating with AMS has been built in the Dendrochronological Laboratory AGH-UST Kraków. Both IAEA and NIST OxII standards as well as background samples and sub-fossil wood samples have been used to test the quality of the line. The results show not significant differences between measured values and consensus values for these standard materials. A small positive bias of about 0.12% has been detected and requires further investigation. Further tests to determinate the weight dependence of the organic background and tests with other material types such like bones, carbonates, etc. are required to be completed.
ACKNOWLEDGMENTS
We want to express our thanks to the whole staff of the Leibniz-Laboratory at Kiel for help we have received during the development of the line, sample preparation, measurement and discussion of the results. This work has been partly supported by the Polish National Science Centre grant NCN 2013/09/B/ST10/02249, and Silesian Technical University grant BK-229/RIF/2017.