“Only what we could carry” was the rule; so we carried Strength, Dignity and Soul.
—Lawson Fusao InadaIn 1942 the U.S. government forcibly removed more than 110,000 people of Japanese origin from their homes on the West Coast and sent them to ten internment camps in remote locations of the country, triggering one of the largest population movements of U.S. history. The communities that developed in these camps until their final closing in 1946 were completely new. Daily roles and activities changed, and individuals were surrounded by people from very different backgrounds than the ones they had encountered in their previous lives (Spicer et al. Reference Spicer, Hansen, Katherine and Marvin1969). After leaving the camps and having lost jobs and assets back home, many families and individuals had to start from scratch and reassess career and location choices.
This paper studies the long-run career impacts of this displacement episode for those affected. That is, years after internment, how different were the earnings, occupations, and residential locations of former internees, relative to those they would have had if they had not been incarcerated? Studying this question provides an opportunity to learn about economic forces and mechanisms surrounding an episode of historical importance.
The answer to the above question is not obvious. On the one hand, internment constituted a hugely negative shock. The contemporaneous costs for those affected were large, evident, and hard to quantify. Not only did internees lose their freedom of movement and civil rights, they lost jobs, experienced detachment from the outside labor market, and were displaced to remote locations far away from their homes. They were often forced to sell assets at “fire sale” prices before being taken away. In short, they experienced huge economic loss and personal hardship. These circumstances suggest that, either from labor market detachment or from the loss of personal wealth, the future labor market prospects of internees could have been persistently harmed.
On the other hand, pre-internment locations, jobs, and social exposure of Japanese Americans may not have been optimal from a labor market perspective. Family ties, community preferences, migration costs, and lack of information represent labor market frictions that may hinder individuals’ long-run outcomes through underexposure to locations and jobs where economic opportunities are best. Precisely due to the losses at home and to geographic displacement, many internees were forced to re-optimize and start from scratch after release. A large migration across the United States of former internees took place in the aftermath of internment, possibly inducing moves to areas and occupations where opportunities were greater.
Making the most of a new start might have been facilitated by the economic and human capital diversity present in the camps, and the resourcefulness of internees. In 1942, Japanese Americans were represented in all strands of society, from highly educated urban professionals to small farm and business owners and rural laborers. In the camps, many experienced less economic and human capital segregation than in their former lives. Camp living arrangements and interactions with others—in very close proximity and for a prolonged period of time—could have enabled exchanges of information, gathering of skills, and changing aspirations. These interactions could have been channeled through day-to-day contact or, more formally, by popular internee-operated adult education programs (Su Reference Su2011).
Understanding how and to what extent these circumstances affected internees’ prospects is valuable for at least three reasons. First, the shock of mass internment—indiscriminate and unrelated to labor market trends—provides a suitable environment to study questions related to displacement, mobility, and labor market frictions. Second, comprehending these questions would improve our understanding of the long-run consequences and responses to a key episode in the history of the United States, Japanese Americans, and the consequences of WWII. Third, this analysis can also shed light on the barriers and frictions that immigrant groups have faced throughout history as they seek economic advancement in their new homes.
In my analysis, I first estimate the long-run average causal effect of internment on earnings using a difference-in-differences (DiD) framework. This approach compares outcomes of interned Japanese Americans before and after internment with outcomes of a comparable group of Asians living in the United States and not subject to internment. When choosing this comparison group, it is key to account for institutionalized discrimination toward Asians before WWII—especially on the West Coast—and its decline thereafter (Hilger Reference Hilger2016). For this reason, the comparison group consists of a combination of West Coast Chinese Americans, and non-interned Japanese Americans (those who were living outside the West Coast in 1942). While West Coast Chinese Americans faced similarly severe pre-war racial discrimination, China was a U.S. ally during WWII. Because Japanese Americans who did not live on the West Coast were fewer in number and far from areas considered important for the war in the Pacific, they were able to avoid the racially motivated anti-Japanese drive that led to mass internment. Although limited by the amount of pre-WWII data, I provide evidence indicating that these groups had similar incomes in 1940 and were on similar trajectories.
I combine several data sources, starting with 1940, 1950, and 1960 U.S. Censuses, which include information on income, race, and place of residence. A key empirical challenge is that future or past internment is unobserved in Census data. Footnote 1 To address this issue, I develop a method to estimate the probability of internment conditional on Census observables, combining Census data with two additional datasets: administrative camp records, and a sociological study from the 1960s, which surveyed around 4,000 Japanese Americans (the Japanese American Research Project (JARP), Levine and Rhodes, 1981). These data are valuable because camp records list everyone who was interned and because the survey asked respondents to describe their migration history within the United States. Combining the administrative records with the 1940 Census, I first use Bayes’ Rule to predict internment based on Census observables in a nonparametric way. Then, I use the survey information on migration patterns to modify the estimator in a way that takes post-internment moves into account, which permits applying it to 1950 and 1960 Census data.
Following this approach, the results indicate that internment had a long-run positive and large effect on the annual income of internees 5–15 years after leaving the camps, with magnitudes that range from 9 to 22 percent of the counterfactual average income. This finding is robust to modifications of the comparison group (Chinese only, non-interned Japanese only, or both) as well as to different empirical specifications. Due to the small number of non-interned Japanese Americans, the estimated effects when only using them as a comparison group are imprecisely estimated and not statistically significant. However, these estimates are similar in magnitude to the precisely estimated ones that arise when using the other comparison groups.
A potential concern is the existence of differential trends in post-war racial discrimination toward Chinese and Japanese Americans that could confound the effects of internment (e.g., government or society “compensating” internees). However, the historical literature does not suggest such a large distinction and has studied the change in anti-Asian discrimination of these two groups as a whole (e.g., Wu Reference Wu2013; Hilger Reference Hilger2016). An important historical asymmetry, if anything, favored the Chinese: they were first allowed to naturalize in 1943 while Japan-born residents were only allowed to do so in 1952. It was not until the 1980s that the injustice toward internees was formally acknowledged and compensated. Footnote 2
In the second part of the paper, I investigate potential explanations behind the results noted earlier, with the caveat that mass internment was a complex event and teasing apart all related plausible long-term mechanisms is not feasible. With this caveat in mind, I find evidence consistent with two complementary channels. The first channel is the re-optimization of location and career decisions after internment. The second channel, for which the evidence is suggestive, is the potential exchange of information and skills mediated by the high economic and human capital diversity of the camps.
The 1960s JARP survey asked respondents retrospective questions about their occupational history, their places of residence in the United States, and whether they had been interned or not. I find that internees experienced more occupational and geographic mobility compared to non-interned Japanese Americans. Internees had a 19 percent higher probability of having changed occupation after the war and a 24 percent higher probability of living in a different state. In addition, the occupational mobility effect is almost entirely driven by those young internees who were previously working in farming jobs, who climbed the occupational ladder into professional and technical occupations. If the aftermath of forced displacement led people to move to jobs and locations with better opportunities—even when displacement reduced wealth that could have financed these moves—this would imply that adjustment costs were present before internment, or that the experience provided new information or skills that enabled such moves. Footnote 3
Although limited by data availability, I explore if access to new information and skills could have played a role in enabling mobility. Camp life intrinsically led to much more intense interactions than in regular communities. I systematically document the economic and human capital diversity present in the camps: all camp communities housed people from all educational levels, urban/rural origin, and occupational skills. Combining camp records with finely geocoded 1940 Census data, I provide a novel descriptive comparison between the level of economic diversity in the camps and that which was present in the communities of similar size where West Coast Japanese Americans lived before internment. I find that most internees were exposed to higher shares of highly educated and highly skilled workers in the camps than in their previous communities of residence.
If camp interactions generated any productive responses it is plausible that they particularly accrued to the less educated and less skilled. In line with this prediction, I show evidence suggesting that income inequality among interned Japanese Americans decreased, relative to the comparison group. Additionally, the survey data reflect a lower intergenerational correlation of income among Japanese Americans who were interned. Lastly, I estimate model-based occupation-specific frictions based on the occupational choice model of Hsieh et al. (2013). These estimates indicate that the frictions that internees faced relative to the comparison group decreased after internment across professional, white-collar, and blue-collar occupations.
This paper contributes to several strands of work. A literature, recently reviewed by Becker and Ferrara (2019), studies the consequences of forced displacement. Among this literature, this paper relates to work documenting consequences of forced displacement on the displaced (Bauer, Braun, and Kvasnicka 2013; Deryugina, Kawano, and Levitt 2018; Sarvimäki, Uusitalo, and Jäntti 2020; Nakamura, Sigurdsson, and Steinsson 2020; Becker et al., Reference Becker, Irena, Pauline, Nico and Ekaterina2020). Internment making individuals re-optimize in ways that improved their long-run labor market outcomes aligns with the effects of displacement due to natural disasters (Deryugina, Kawano, and Levitt 2018; Nakamura, Sigurdsson, and Steinsson 2020), or post-WWII forced displacements in Europe for those employed in agriculture (Bauer, Braun, and Kvasnicka 2013; Sarvimäki, Uusitalo, and Jäntti 2020). The context I study is set apart from these other episodes by the fact that internees received no financial compensation for their losses during my study period. This fact rules out pre-internment liquidity constraints as a potential channel for long-term gains. Another distinction is voluntary migration post-internment: contrary to the European post-WWII displacements, internees could return to their locations of origin after internment ended.
Apart from being a forced displacement episode, Japanese American internment had an incarceration component too. The characteristics of this incarceration were rather unique, and without a clear parallel. Singular features include the emergence of ten small, new, temporary societies with communal living, composed of men, women, and children of all ages and diverse former economic status; with freedom of action within the boundaries of the camps, but not allowed to leave freely; and, amid hardship, opportunities to pick up new skills and information for the future. Empirical work on institutions sharing some but not all of the noted features include criminal incarceration (Kling Reference Kling2006), peacetime military service (Card and Cardoso 2012), POW camps (Costa and Kahn 2007), USSR ethnic deportations (Miho, Jarotschkin, and Zhuravskaya 2020), and refugee camps (Ginn Reference Ginn2020).
The interactions in the camps between new and diverse sets of peers speak to the literature on social contact and peer influences, especially to evidence indicating that communities of residence impact the long-term outcomes of children and young adults (Katz, Kling, and Liebman Reference Katz, Kling and Liebman2001; Chetty, Hendren, and Katz 2016; Chyn Reference Chyn2018; Guiso, Pistaferri, and Schivardi 2021), evidence on a negative correlation between positive neighborhood effects and socioeconomic segregation (Chetty and Hendren 2018), and evidence on the effects of peers’ economic diversity (Rao Reference Rao2019). The transmission of information and skills among economically diverse individuals with common culture and ethnicity aligns with the effects of matching demographically similar instructors and students (Dee Reference Dee2005).
By design, the human capital and economic diversity present at the camps was coupled with ethnic-origin homogeneity. However, after internment, many internees migrated to new areas of the United States, leaving behind their former communities of residence and, as I later show, becoming less likely to live in Japanese neighborhoods. This dynamic in ethnic residential segregation relates to the economic history literature on immigration that studies residential segregation in immigrant enclaves (see Eriksson and Ward 2019; Eriksson Reference Eriksson2020; Abramitzky, Boustan, and Connor 2020).
Lastly, this paper contributes to empirical work that has studied different aspects of Japanese American internment. Saavedra (2015) finds negative effects on educational outcomes of children who attended internment camp schools. Saavedra also finds that early-childhood internment led to shorter long-run lifespans (Saavedra Reference Saavedra2013) and that, following the Pearl Harbor bombing, internees gave more Americanized names to their children (Saavedra 2021). Shoag and Carollo (2016) use internment as an exogenous geographical shock to study the causal effect of place. They carry out an internee-internee comparison of later outcomes based on place of residence, using the variation driven by the conditional randomness of camp assignment. The paper closest to this one, related to labor market consequences of internment, is Chin (Reference Chin2005). Chin studies the long-run effect of lost labor market experience during internment. Using cross-sectional 1970 Census data she finds that, among (likely) former internees, the earnings difference between cohorts who were of working and non-working age in 1942 is more negative than that observed in other comparison groups. Under the assumption that labor market prospects of school-aged internees were unaffected by internment, Chin interprets this differential as a long-run negative earnings effect of lost labor market experience. While this result might seem at odds with the findings of this paper, Chin notes her results are based on internee-internee comparisons and cannot thus be considered overall effects of internment. Footnote 4
This paper adds to this literature in two main ways. First, I develop a methodology that combines different publicly available datasets and allows to nonparametrically estimate a person’s probability of internment based on Census observables. These propensity scores allow the study of large numbers of internees both before and after internment, and to derive a general understanding of the career consequences (earnings, occupational choice, migration) of internment. Second, I study the economic composition of the internment camps and quantify their human capital and economic diversity in comparison to the communities where Japanese Americans previously lived.
Historical Background
Japanese immigrants began arriving in large numbers to the United States during the end of the nineteenth century, settling predominantly along the West Coast.Footnote 5 The flux of Japanese immigrants increased during the first years of the twentieth century but substantially decreased starting in 1908 due to restrictive immigration laws.Footnote 6 These laws resulted in almost zero new Japanese immigration arriving to the United States between 1924 until 1952 when very small numbers of migrants from Japan started being allowed into the country again.Footnote 7 These legal restrictions shaped the demographic composition of Japanese Americans, which featured a “missing generation.” This created a sharp distinction between first-generation Japanese (the Issei) and their American-born children (the Nisei).Footnote 8 By 1940 there were more than 120,000 Issei and Nisei living in the United States, the vast majority of them living in the West Coast states. Discrimination against Asians was widespread and institutionalized before WWII, especially in areas where they were more numerous, such as the West Coast (Hilger 2016).Footnote 9
On 7 December 1941, Japanese warplanes attacked the naval base of Pearl Harbor, Hawaii, bringing the United States into WWII and turning the Issei into enemy aliens. Mixed with existing racially motivated animosity, suspicion was quickly drawn toward the community of Japanese Americans on the West Coast and rumors of sabotage and espionage became widespread. The FBI carried out the first government reaction by picking up and detaining Issei male community leaders.Footnote 10 However, there were yet no clear signs of what was to come. Even after Pearl Harbor, both Attorney General Biddle and President Roosevelt made statements in favor of personal freedoms and minority rights, explicitly calling for the rights of enemy aliens and warning against falling into war hysteria and minority persecutions (Leighton Reference Leighton1950).
Despite these previous claims, on 19 February 1942, President Roosevelt signed Executive Order 9066, which would, later on, lay the groundwork for the mass internment of Japanese Americans.Footnote 11 This order gave the Secretary of War and designated military commanders the power to prescribe military areas from which any person could be excluded. However, it made no specific mention of Japanese Americans, mass internment, or the West Coast. Events escalated quickly from this point onwards. On 23 February, a Japanese submarine fired at oil tanks near Santa Barbara, California, increasing the fear of an invasion and rumors and suspicion toward Japanese Americans. On 2 March, the U.S. military divided the states of Washington, Oregon, California, and Arizona into designated Military Areas 1 and 2, encouraging Japanese residents in Area 1 to move East.Footnote 12 After the failure of the voluntary migration scheme, on 27 March Japanese Americans in Area 1 (citizens and non-citizens alike) were prohibited from moving in preparation for the mass removal and incarceration that ensued.Footnote 13
Shortly after, the army Western Command, claiming military necessity, started organizing the mass removal of more than 110,000 Japanese Americans from the West Coast. Notices were posted in many cases with less than a week’s notice before departure. Families were told to bring the essential things that they could carry, and there was complete uncertainty regarding if and when they would be able to come back. Many were forced to sell their property, furniture, and other belongings very quickly, at “fire sale” prices. After a short stay in temporary centers and beginning in the summer of 1942, Japanese Americans were sent to ten internment camps in remote and isolated parts of the country that the government had hastily built. A civilian agency, the War Relocation Authority (WRA), was set up to administer the camps. They were distributed across California, Arizona, Idaho, Utah, Wyoming, Colorado, and Arkansas.Footnote 14
Life at the Camps
The camps consisted of blocks of military-style tarpaper barracks, with communal mess halls and lavatories in the middle of each block (see Online Appendix Figure A3). Barracks were typically partitioned into several private rooms and, in the best scenarios, a family with children would have their own private room. Couples, small families, and single people usually shared a room with others. While internees were provided with basic necessities (e.g., food, shelter, healthcare, and schooling for children), life at the camps entailed many hardships. Not only due to the loss of freedom but also arising from poor living quarters and services.Footnote 15 In trying to overcome these adversities, internees strove to lead their lives as normally as possible. With the effort and labor of internees, these camps turned into communities that became rather self-sufficient in the provision of services and had a rich social life driven by internee-organized activities. Different types of assemblies were set up to organize camp affairs and represent the interest of different groups of internees. Some internees held jobs in the camps (maintenance, cooks, administrative clerks, teachers, hospital workers, food growers) although the wages paid by the WRA were very low.Footnote 16
Diversity and Interactions at the Camps
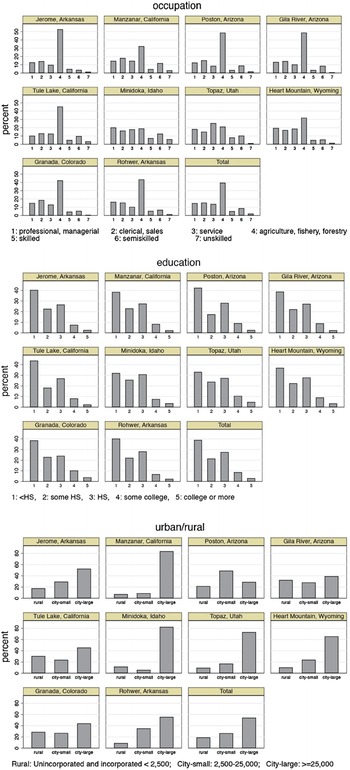
The economic and human capital composition of the camps was a diverse one. West Coast Japanese Americans in 1942 were represented in all strands of society; from highly educated urban professionals to small business owners to itinerant farm laborers. This turned camp communities into a mix of people that, while sharing the same ethnic or national origin, were heterogeneous in economic terms. Using WRA records, Figure 1 reflects such diversity showing the distribution of occupations, educational attainment, and urban/rural origin at the camp level and overall.
Internment Camps’ Economic and Human Capital Diversity
Notes: Distribution of occupational skills, educational attainment, and urban/rural background in WRA records, by internment camp and overall. For educational attainment, I exclude internees who were less than 18 years old. HS stands for high school. Urban/rural category numbers represent population size.
Source: WRA Records.

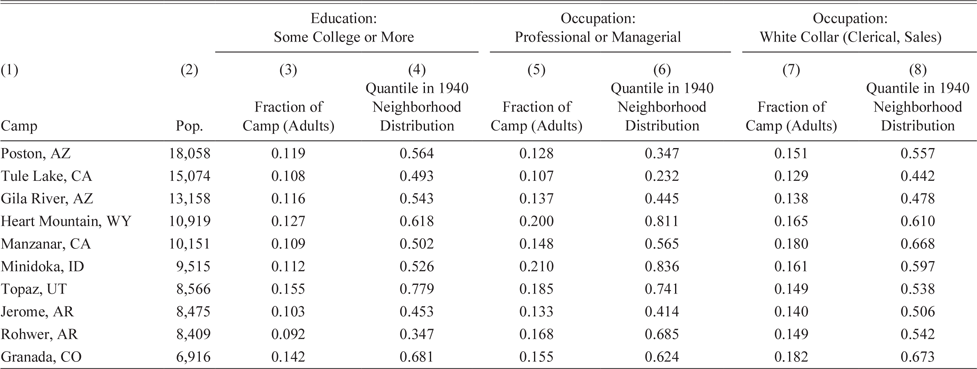
Using administrative camp records on the population of internees, and 1940 Census population data with fine geographic identifiers, Table 1 provides new descriptive evidence on internees’ previous communities of residence and internment camps. This table shows that most internees were surrounded by a higher share of highly educated and highly skilled individuals than in their former communities. For each of the ten camps, Table 1 displays the fraction of who had at least some college education (Column (3)), the fraction with professional or managerial occupation skills (Column (5)), and the fraction with white-collar occupation skills (Column (7)). Using 1940 Census data, Columns (4), (6), and (8) show what fraction of West Coast Japanese Americans were living in neighborhoods with a lower share of each of the corresponding groups of people.Footnote 17 For example, focusing on education and Heart Mountain camp, Column (3) shows that 12.7 percent of their adult internees had at least some college education. Column (4) reflects that 61.8 percent of West Coast Japanese Americans were living in 1940 in neighborhoods with a share of college educated people below 12.7 percent. Looking at these quantiles across measures and camps, we see that they usually reflect high values, mostly above 0.5. This indicates that the shares of highly educated and skilled workers in the camps were larger than that in the previous communities of most internees.Footnote 18
Camps’ Economic Composition and Comparison with 1940 Japanese Americans’ Neighborhood Composition

Notes: Economic composition of WRA internment camps and comparison with that experienced by Japanese Americans in 1940 West Coast (WA, OR, CA, and AZ) neighborhoods, taking into account all persons in 1940 neighborhoods. Column (2)-Camp population in WRA records. Column (3)-Fraction of highly educated adult internees (educational attainment of some college or more). Column (4)-Fraction of West Coast Japanese Americans living in 1940 in a neighborhood with a lower share of highly educated adults than that in Column (3). Column (5)-Fraction of adult internees with previous professional or managerial occupations. Column (6)-Fraction of West Coast Japanese Americans living in 1940 in a neighborhood with a lower share of professional/managerial occupation adults than that in Column (5). Column (7)-Fraction of adult internees with previous white-collar occupations (clerical, sales). Column (8)-Fraction of West Coast Japanese Americans living in 1940 in a neighborhood with a lower share of white-collar occupation adults than that in Column (7). 1940 neighborhoods are groups of Census enumeration districts within a county as described in the text (see footnote 17), with average population of 9,480 people.
Sources: 1940 Census and WRA records.
Through communal mess halls and lavatories, assemblies, leisure activities, and organization to keep the camps running, internees came in close and constant contact with their camp neighbors. The diversity of individuals at the camp level was also present at the finer level of the block, which was an important social and organizational unit within each camp. The people internees saw several times a day, lived within very close physical proximity and shared mess halls and lavatories with, were very different from the ones they had known and interacted with in their previous lives.Footnote 19 As Spicer et al. (Reference Spicer, Hansen, Katherine and Marvin1969) put it:
Everyone was faced with more new than familiar persons in the unaccustomed intimacy of the imposed block basis of social life. Moreover these strangers faced one another in wholly new roles, as chefs and workers in the mess halls as well as table companions, as block managers entirely outside the Japanese-American experience […] (p. 14).
[…], the people in any one block constituted a heterogeneous assortment. Although it might consist of 300 persons from Los Angeles, or Santa Clara County, of Fresno, or Seattle, and although it might consist of a dozen groups of families, each group of whom had known each other before evacuation, still the dozen circles of friends often had very little in common. A typical block of country people might contain eight to ten families of well-to-do farmers, fifteen or twenty itinerant farm laborers, a dozen or more families of poor tenant farmers, a few small-town shopkeepers, possibly a dentist and his family-people who had lived according to widely different economic standards, who had gone to different churches, and who perhaps belonged to none of the same organizations. No block had from the beginning a background of common participation of all its members in some former community (p. 103).
A relevant way in which the interactions between people of diverse skills were channeled was through the adult education programs present in the camps, which are well documented by Su (Reference Su2011). These programs were internee-operated, taught by those internees who had relevant prior professional or academic skills to share. The availability of time, the fact that they were internee-driven and operated, and internees’ desire to prepare for their lives after internment made these programs very popular. The course offerings were varied, including English (for the Issei), shorthand, typing, bookkeeping, mathematics, and business.
Leaving Camp
Individuals started to gradually leave the camps in the winter of 1943/44. They were not yet allowed to return to the West Coast, but after receiving approval, they could leave and resettle in other parts of the country. The WRA tried to encourage and help these moves by setting up field offices in different cities to help internees resettle and find jobs. Cities close to the restricted area such as Salt Lake City or Denver were popular destinations, although many ended up leaving for places farther away such as Chicago, Milwaukee, or Atlanta. The beginning of the end of internment came from the courts. The Supreme Court ruled in December 1944 (Ex parte Mitsuye Endo) that the retention of loyal citizens in internment camps was unconstitutional.Footnote 20 At the same time, the government announced that by January 1945 the exclusion order would be rescinded, Japanese Americans would be allowed to return to the West Coast, and a timeline for the closing of the camps was put in place.
In the fall of 1945, more than three years after leaving the West Coast, the majority of internees had left the camps (Tule Lake camp, the last to close, did so in 1946).Footnote 21 Many returned to their places of origin to pick up their former lives, while others looked to establish themselves elsewhere. Initial destinations outside the West Coast were rarely definitive, and a migratory movement was set in motion where thousands of people looked for new beginnings around the country, leaving the internment experience behind. Around 40 percent of former internees initially resettled outside the West Coast. Between four- and five-thousand former internees (of which 40 percent were minors) migrated to Japan after internment (Daniels 2004).Footnote 22
In 1980 the U.S. Congress appointed the Commission on Wartime Relocation and Internment of Civilians. Their conclusions were that mass internment had constituted a “grave injustice,” that incarceration was not justified by military necessity but based on “race prejudice, war hysteria, and a failure of political leadership.” In 1990, camp survivors were given $20,000 as compensation, along with an apology letter from President Bush.
Data
I use three main sources of data. Firstly, the U.S. Census for the years 1940, 1950, and 1960. Secondly, JARP, a 1960s survey of Japanese Americans and their descendants. Lastly, the WRA records, a comprehensive list with information on every individual who was interned in each of the ten internment camps. Arellano-Bover (2021) provides datasets and replication codes.
Decennial Census 1940–1960
I use the 1940 full count, 1950 1 percent sample, and 1960 5 percent sample of the Decennial Census made available by IPUMS (Ruggles et al. 2015). These provide three cross-sections of Japanese and Chinese Americans before and after internment. The relevant variables in the Census are those providing information on race, income, and current place of residence. The 1940 Census provides some but incomplete information on non-wage income, so I use a simple imputation procedure for non-wage income in this census year.Footnote 23 My difference-in-differences strategy using Census data focuses on the 1896–1924 birth cohorts (i.e., in working age both before and after internment) of male individuals that census enumerators recorded as being of Japanese or Chinese race.
Two key features of Census data motivate much of my empirical approach. The first is that internment status (future or past) is unobserved. Second is the lack of panel linkages between the three datasets. These two characteristics, together with the large geographical dispersion of internees across the United States after leaving the camps, makes determining internment status based solely on Census information unfeasible. While the combination of race and current state of residence would be an almost perfect determinant of internment status in 1942, this is certainly not the case in 1950 or 1960. I overcome this issue by developing a method that combines Census data with survey data and administrative camp records. As I explain in the following section, this allows me to predict internment status based on Census observables while considering the characteristics of the population of internees and their migration patterns after internment.Footnote 24
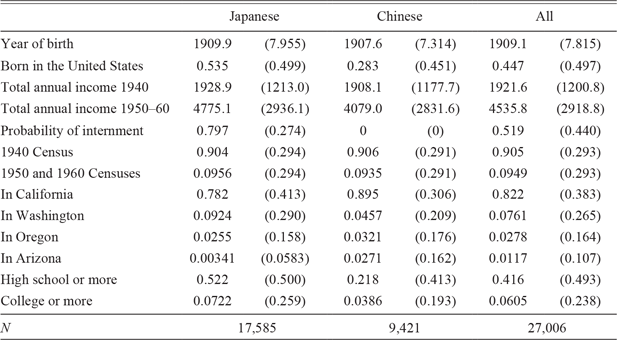
Table 2 presents summary statistics on the Census sample, separately for Japanese and Chinese in the relevant states and birth cohorts. Based on the empirical strategy described later, the sample includes Chinese residing in the West Coast states, and Japanese residing throughout the continental United States.Footnote 25 Given the very low number of Japanese and Chinese Americans in the 1950 1 percent sample, I group 1950 and 1960 as a single “post” period in most of the empirical analysis.Footnote 26 Compared to the Japanese, the Chinese were somewhat older and more likely to have been born abroad. Likely in part because of this, they had lower educational attainment. Due to these differences, I control for these covariates in the DiD analysis. Finally, the table shows how average income across the two groups was very similar in 1940.
Summary Statistics 1940, 1950, and 1960 Censuses

Notes: Summary statistics for the pooled 1940, 1950, and 1960 DiD samples of Japanese and Chinese Americans. Average and standard deviation in parentheses. Males, 1896–1924 birth cohorts who worked at least 26 weeks during the past year. Japanese in continental United States and Chinese in the West Coast (AZ, CA, OR, and WA). Annual total income expressed in 1950 dollars. Probability of internment computed as described in the text. 1940 100 percent Census, 1950 1 percent Census, 1960 5 percent Census.
Sources: 1940–1960 Censuses, JARP surveys, and WRA records.
Japanese American Research Project Surveys
The JARP was initiated in 1960 by the Japanese American Citizens League (JACL). Its objectives included conducting a sociological survey of Japanese Americans, as well as collecting objects, documents, and oral history from the community (Niiya Reference Niiya2017). The JACL partnered with the University of California Los Angeles to conduct the survey and store the collected materials. By 1967, survey data on a total of 4,153 Japanese Americans of three different generations had been collected. Levine and Rhodes (1981) describe the survey in detail.
A list of around 18,000 surviving Issei (first-generation Japanese American) in the continental United States was compiled with the help of Japanese American associations and local authorities. This list was aimed at being as comprehensive as possible. A sample of Issei were selected to be contacted and between 1963 and 1966 a total of 1,047 sampled Issei were interviewed. Footnote 27 Issei respondents were asked to provide a list of their Nisei children. This provided a list of 3,817 Nisei who were contacted for in-person, mail, or telephone interviews. With a response rate of 60 percent, a total of 2,304 Nisei were interviewed. In the same way as their parents, they provided the contact details of their adult children. This provided a total of 1,063 adult Sansei (third-generation Japanese American) of whom 802 (75 percent) responded to a mail questionnaire. Nisei and Sansei survey data were collected between 1966 and 1967. Footnote 28 Levine and Rhodes (1981) argue that the representativeness of the JARP survey was good. Online Appendix B provides evidence consistent with this claim, showing the similarity of JARP respondents and Japanese Americans in the 1960 Census.
Questionnaires were exhaustive and questions ranged many different topics, with surveys being different for each generation. Topics included work and occupations, migration from Japan and within the United States, attitudes, network of relationships, beliefs, and expectations for the future. Importantly for my purposes, many questions were asked in a retrospective way providing some panel data. Also, respondents were asked about their internment status between 1942 and 1945. Regrettably, JARP did not ask about income retrospectively.
The JARP surveys are relevant in two different roles. First, they will allow me to take into account migration patterns when predicting internment status in the Census. Second, I will explore mechanisms behind the long-term income result by comparing career trajectories and attitudes of interned versus non-interned JARP respondents. Tables 4 (Issei) and 5 (Nisei) present summary statistics on the main JARP baseline variables of interest, separately for interned and non-interned respondents.
War Relocation Authority Records
The third dataset comes directly from the internment camps. It contains information on every individual who was interned in each of the ten WRA camps, and it was recorded by WRA employees at the time people arrived at the camps. A digitized version of the original records is made available online through the National Archives.
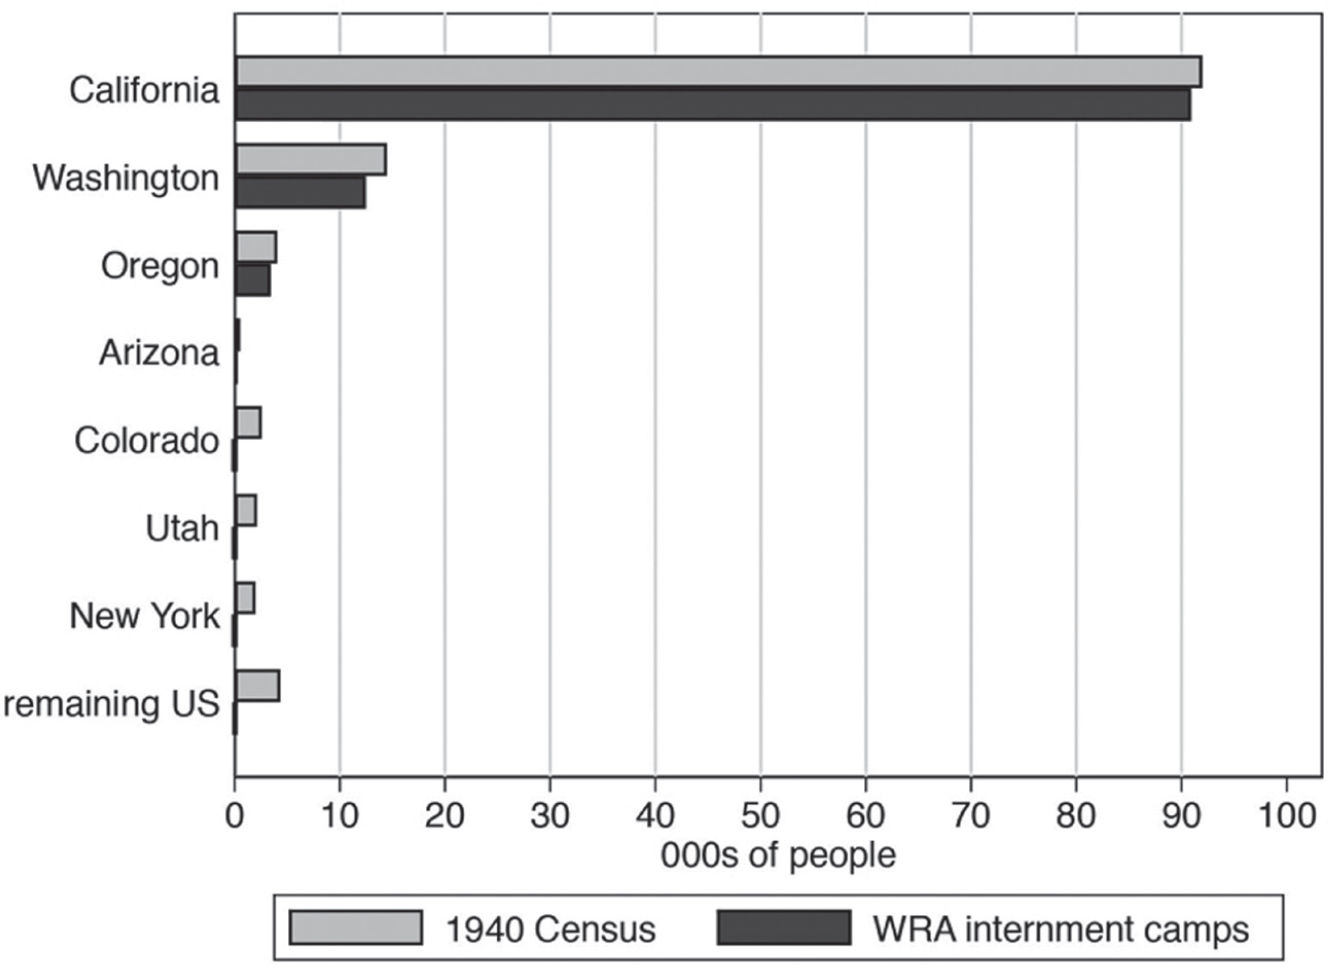
The dataset has information on 109,247 people. Information includes internees’ names, internment camps, previous addresses, educational attainment, occupational skills, and birthplace, among other social and demographic characteristics. Figure 2 shows the state of origin of the population of internees, compared with the state of residence of individuals of Japanese origin in the 1940 Census.
Japanese in 1940 Census and Camp Internees
Notes: Gray bars: Total number of individuals recorded as being of Japanese race residing in each state in the 1940 Census. Black bars: Total number of internees in WRA records, by previous state of residence.
Sources: 1940 Census and WRA records.

Empirical Approach
I now describe the empirical approach I follow to estimate the long-run effect of internment on income. First, I describe the difference-in-differences (DiD) framework as if internment status were observed. Then, I show how I overcome missing internment information in the Census by combining datasets and estimating the probability of internment conditional on observables.
Difference-in-Differences Framework
The objective is to estimate the effect of internment on income using repeated cross-sections from the Census. The 1940 Census provides information before internment, while the 1950 and 1960 Censuses provide information 5 and 15 years after camps closed. Hence, the estimated effects on earnings should be interpreted as long term, and not as the immediate labor market conditions faced by internees once they left the camps. I focus on males, born between 1896–1924 (i.e., working age both before and after internment).
The empirical DiD model based on observed internment has the following form:
 $${y_{it}} = {\alpha _t} +{X^{\prime}{}_{it}} \gamma + \delta {I_i} +\beta \left( {{I_i} \times Pos{t_t}} \right) + {\varepsilon _{it}},$$
where y it is annual income for individual i in Census year t, α t are time fixed effects for each of the three Census years, X it are time-varying controls, I i equals one if individual i was interned, and Post t equals one for Census years 1950 and 1960. Footnote 29 A suitable comparison group to estimate Equation (1) is one such that the assumptions of parallel trends and zero conditional mean of ε it are satisfied. Under these conditions, β represents the average effect of internment for internees.
When choosing a suitable comparison group it is key to account for the institutionalized discrimination toward Asians before WWII—especially on the West Coast—and its decline thereafter (Hilger 2016). Comparing interned Japanese Americans with groups who did not experience the same shift in racial discrimination could confound the effect of internment with these trends. The comparison group I employ is a combination of non-interned Japanese Americans (those living outside the West Coast when internment took place) and Chinese Americans from the West Coast (i.e., Washington, Oregon, California, and Arizona—the states targeted for mass internment). The former shared with internees a common country of origin and migratory background but were not interned because in 1942 they were residing in areas other than the West Coast. The latter, while being the target of similar anti-Asian discrimination prevalent in the West Coast before WWII and living in the same areas, were not targeted by government authorities because China, as opposed to Japan, was a U.S. ally during WWII. Given these different similarities, I believe that these two groups complement each other nicely in creating a suitable comparison group for internees. Footnote 30
I provide some evidence to examine the plausibility of non-interned Japanese and Chinese being a suitable comparison group. Outcome variable trends prior to treatment are usually examined as indications of the validity of the parallel trends assumption. Such a check is not available since the 1940 Census was the first to record income information. However, I examine trends for the occupational income score, an income proxy available in both the 1930 and 1940 Censuses. Footnote 31 Online Appendix Figure A5 shows the average occupational income score between likely interned Japanese Americans, likely not interned Japanese Americans, and West Coast Chinese Americans (the following section defines the estimated probability of internment). Caution should be taken when interpreting this figure since there are only two data points and it represents an imperfect measure of my outcome variable. However, it is somewhat reassuring to see that the 1930–1940 trend is parallel between the three groups.
The similarity of pre-treatment characteristics, though not necessary for the DiD assumptions to hold, is a desirable feature in such a setting. Online Appendix Figures A6 and A7 provide some insight into the similarity of labor market characteristics of both groups in 1940. Online Appendix Figure A6 plots the distribution of income and its average after conditioning on place of birth, age, and high school completion (i.e., covariates in Equation (1)) for both groups in 1940. The average is the same across both groups and the distributions show significant overlap. Online Appendix Figure A7 plots the occupational distribution for both groups in 1940. While the probability of working in farming or being a laborer varied substantially between internees and non-internees, the remaining occupations were held in similar proportions.
A potential concern is the existence of differential trends in post-war racial discrimination toward Chinese and Japanese Americans that could confound the effects of internment. However, the historical literature does not suggest such a large distinction, and it has studied the change in anti-Asian discrimination of these two groups as a whole (e.g., Wu Reference Wu2013; Hilger 2016). An important historical asymmetry, if anything, favored the Chinese; they were first allowed to naturalize in 1943 while Japanese-born residents were only allowed to do so in 1952. It was not until the 1980s that harm toward internees was formally acknowledged and compensated. Finally, DiD regressions using only Japanese as a comparison group should help allay these concerns.
Overall, the historical context and the empirical evidence from the 1930 and 1940 Censuses suggest that the required DiD assumptions are reasonable in this setting. In the Mechanisms section I provide additional evidence regarding the pre-internment similarity of interned and non-interned Japanese Americans in the JARP surveys. Next, I deal with the fact that I i is unobserved in the Census.
Predicting Unobserved Internment Status
Census data do not include internment status information. This prevents me from estimating Equation (1) directly. The nature of the data (no panel data) and the historical context (migration after internment) pose additional challenges to inferring the value of I i from Census observables.
Given how Japanese American internment took place, the combination of a person’s ethnic origin and state of residence in 1942 would be a very good predictor of I i . Footnote 32 This means that—absent large migration flows between 1940–1942—it is relatively straightforward to predict internment for 1940 Census observations. It would also be straightforward to predict internment in 1950 and 1960 if panel data were available and thus state of residence in 1940 was observed in 1950 and 1960. This is not the case since I rely on repeated cross-sections that do not record place of residence 10 and 20 years earlier. The large migration of internees away from the West Coast after internment complicates matters, making state of residence in 1950 or 1960 not a good proxy for state of residence in 1940.
I address these issues by complementing Census data with the JARP surveys and the WRA internee files. The goal is to extract different information from each dataset in order to estimate an individual’s probability of internment based on Census observables. To be precise, the goal is to estimate Pr(I i = 1|Z i , s i t ) ≡ E[I i |Z i , s i t ], where Z i are immutable characteristics of individual i observable in the Census (year of birth, birthplace, race)Footnote 33 and s i t is the state of residence of person i in Census year t, for t = 1940, 1950, 1960. Given the historical context of Japanese American internment, I assign Ê[I i |Z i, s it] = 0 for individuals whose race is recorded as Chinese in the Census. The following discussion applies to individuals of Japanese origin.
Estimation of E[Ii|Zi, sit]
In 1940 Census
I start by estimating E[I i |Z i, s i40], the probability of internment based on state of residence in 1940. Applying Bayes’ rule,
 $$Pr\left( {{I_i} = 1{\rm{|}}{Z_i},s_i{}^{40}} \right) = \frac{{Pr({Z_i}, s_i{}^{40}|\;{I_i} = 1) \cdot Pr\left( {{I_i} = 1} \right)\;}}{{\Pr \left( {{Z_i},\;\;s_i{}^{40}} \right)}},$$
I leverage the WRA records, where I observe all individuals that were interned along with several individual characteristics (which include Z i and s i40). Footnote 34 Together with the 1940 Census, where I observe all individuals of Japanese origin who were or were not interned, I can nonparametrically estimate each of the three components on the right-hand side of Equation (2).
Grouping individuals into cells according to Z i × s i40, the conditional probability Pr(Z i, s i40 |I i = 1) is estimated as the proportion of individuals in the WRA records in each Z i × s i40 cell. The unconditional probability of internment, Pr(I i = 1), is estimated as the total number of individuals in the WRA records over the total number of individuals in the 1940 Census recorded as being of the Japanese race. Finally, the probability Pr(Z i, s i40) is estimated using the 1940 Census by computing the proportion of Japanese Americans in each Z i × s i40 cell.
This procedure provides
 $$\widehat{Pr} (I_i=1|Z_i, s_i^{40})$$
, a nonparametric estimate of the probability of internment based on observables Z i and state of residence in 1940. This allows me to attach a probability of internment for each individual of Japanese origin in the 1940 Census.
In 1950 and 1960 Censuses
Since the WRA records do not include internees’ state of residence in 1950 and 1960, the same procedure cannot be carried out for these Census years. The key to estimating the probability of internment for these years is the JARP data. The JARP asked respondents for retrospective information regarding their internal migration within the United States. Thus, in the JARP dataset, I observe for each individual their state of residence in 1940, 1950, and 1960. This allows me to estimate a state-state matrix of migration probabilities for Japanese Americans and, in combination with
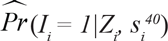 $$\widehat{Pr} (I_i=1|Z_i, s_i^{40})$$
, estimate
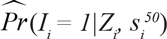 $$\widehat{Pr} (I_i=1|Z_i, s_i^{50})$$
and
 $$\widehat{Pr} (I_i=1|Z_i, s_i^{60})$$
.
I begin by assuming that conditional on state of residence in 1940, the probability of internment is invariant to state of residence in 1950 and 1960. That is, I assume
 $$E\left[ {{I_i}{\rm{|}}{Z_i},\;s_i^{40},\;s_i^t} \right] = E\left[ {I_i{\rm{|}}{Z_i},\;s_i^{40}} \right],\quad t=1950,1960.$$
Note that this assumption does not constrain migration behavior in any way. Rather, this is an assumption about the effectiveness of the government’s internment policy, how the policy targeted some states and not others, and “compliance” with the policy within the targeted states. Given the historical context and the evidence from Figure 2, this assumption is a plausible approximation to reality. In Online Appendix C, I further discuss this assumption using an example.
Under Assumption (3), one can use the estimated probabilities for the 1940 Census and integrate out s 40 i,
 $$E\left[ {{I_i}{\rm{|}}{Z_i},\;s_i^t} \right] = \;\mathop \sum \nolimits_{s = 1}^S E\left[ {{I_i}{\rm{|}}{Z_i},\;s_i^{40} = s} \right] \cdot Pr(s_i^{40} = s|\;{Z_i},\;s_i^t),$$
where Pr(s i40= s| Z i, s it) is an entry in the migration matrix, which is estimated using JARP. Footnote 35
In short, Equation (2) shows how one can use a combination of the 1940 Census and the WRA records to estimate the probability of internment in 1940. Equation (4) adapts this predictor for 1950 and 1960, using migration information contained in JARP. I now show some features of the estimator Ê[I i |Z i, s it].
Descriptives and Performance of Ê[I i |Z i, s it]
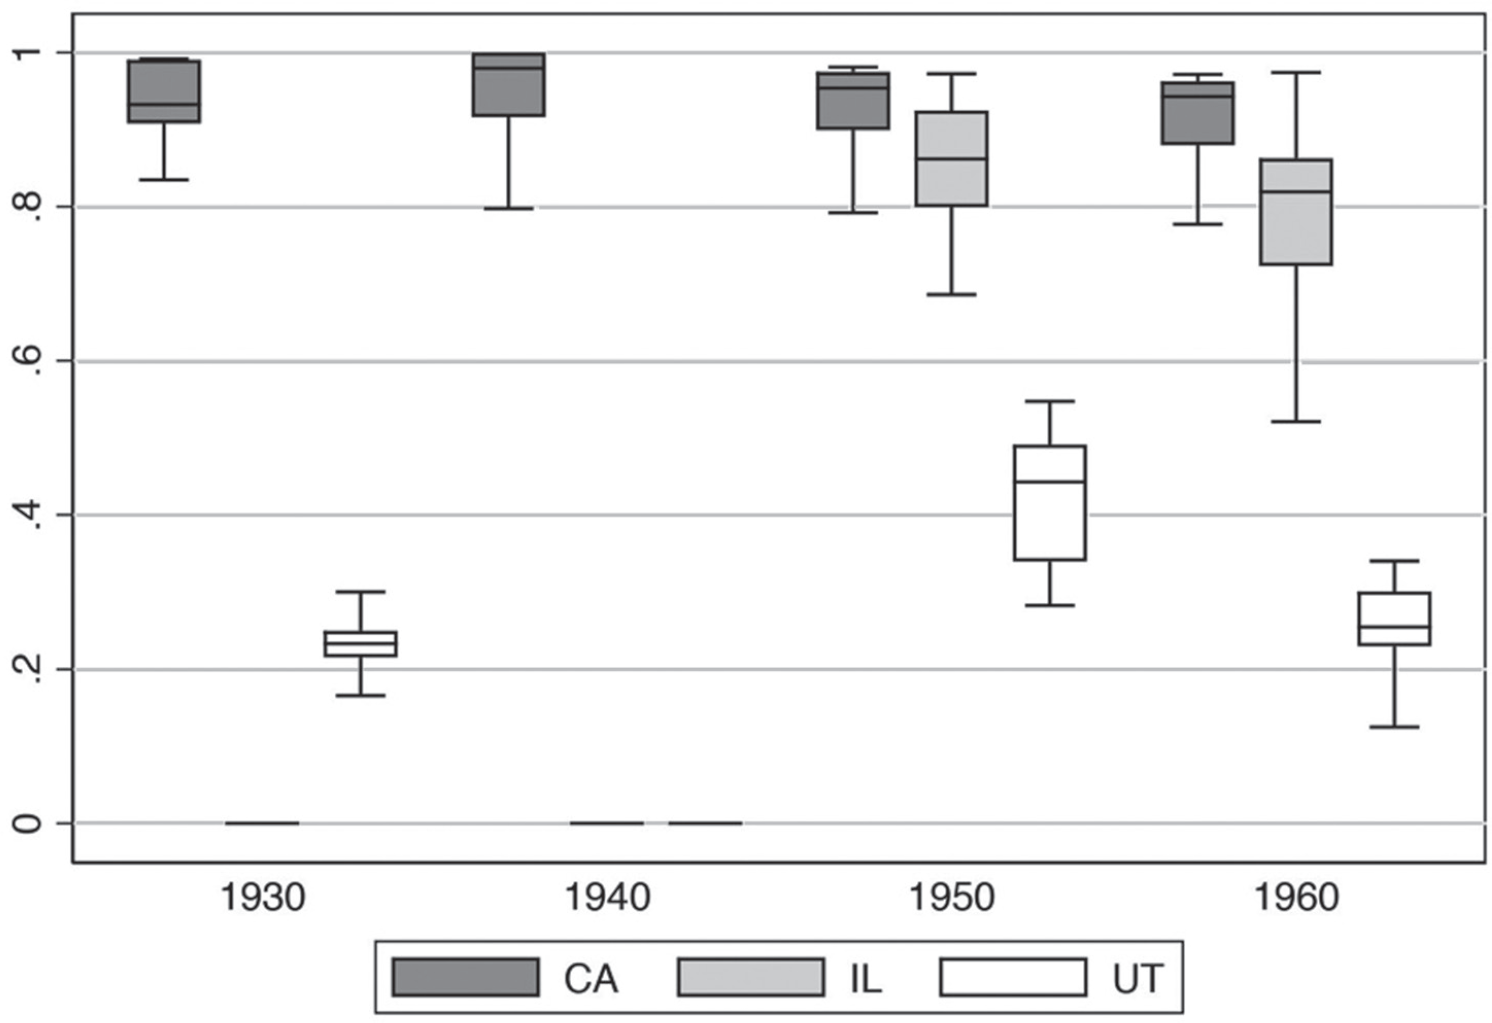
Figure 3 shows the distribution of Ê[I i |Z i, s it] for Japanese individuals residing in California, Illinois, and Utah across Census years.Footnote 36 I have also estimated probabilities for the 1930 Census for illustration purposes, following the same procedure as for 1950 and 1960. These three different states are chosen because they represent different historical evolutions with respect to Japanese American migration and internment. California was the state with the largest population of persons of Japanese origin and its residents were also targeted for internment by the U.S. government. Hence, in any given Census year, Japanese residing in California have high chances of having been/going to be interned, which is what Figure 3 shows. Illinois represents a different scenario since it had practically no residents of Japanese origin before internment and, after internment, a significant number of former internees resettled in Chicago. This means that in 1950 and 1960, Japanese residing in Illinois would have high probabilities of being former internees. Finally, Utah is an in-between case. There was a significant—though small—community of Japanese residing in Utah before 1942, but it was not targeted for internment. Because of this, Japanese living in Utah in 1930 have low but positive probabilities of future internment, allowing for the possibility of migration to the West Coast between 1930 and 1940. In 1940, Japanese from Utah have no probability of being interned since Utah was not targeted. Finally, in 1950 and 1960 the probabilities are positive since they account for internees who migrated to Utah after leaving camp.
Probability of Internment Over Time for California, Illinois, and Utah
Notes: Boxplots of the distribution of the estimated probability of internment for individuals of Japanese origin in different Censuses and states of residence. Each boxplot shows the lower adjacent value, 25th percentile, median, 75th percentile, and upper adjacent value. Probability of internment estimated as explained in the text.
Sources: 1930–1960 Censuses, JARP surveys, and WRA records.

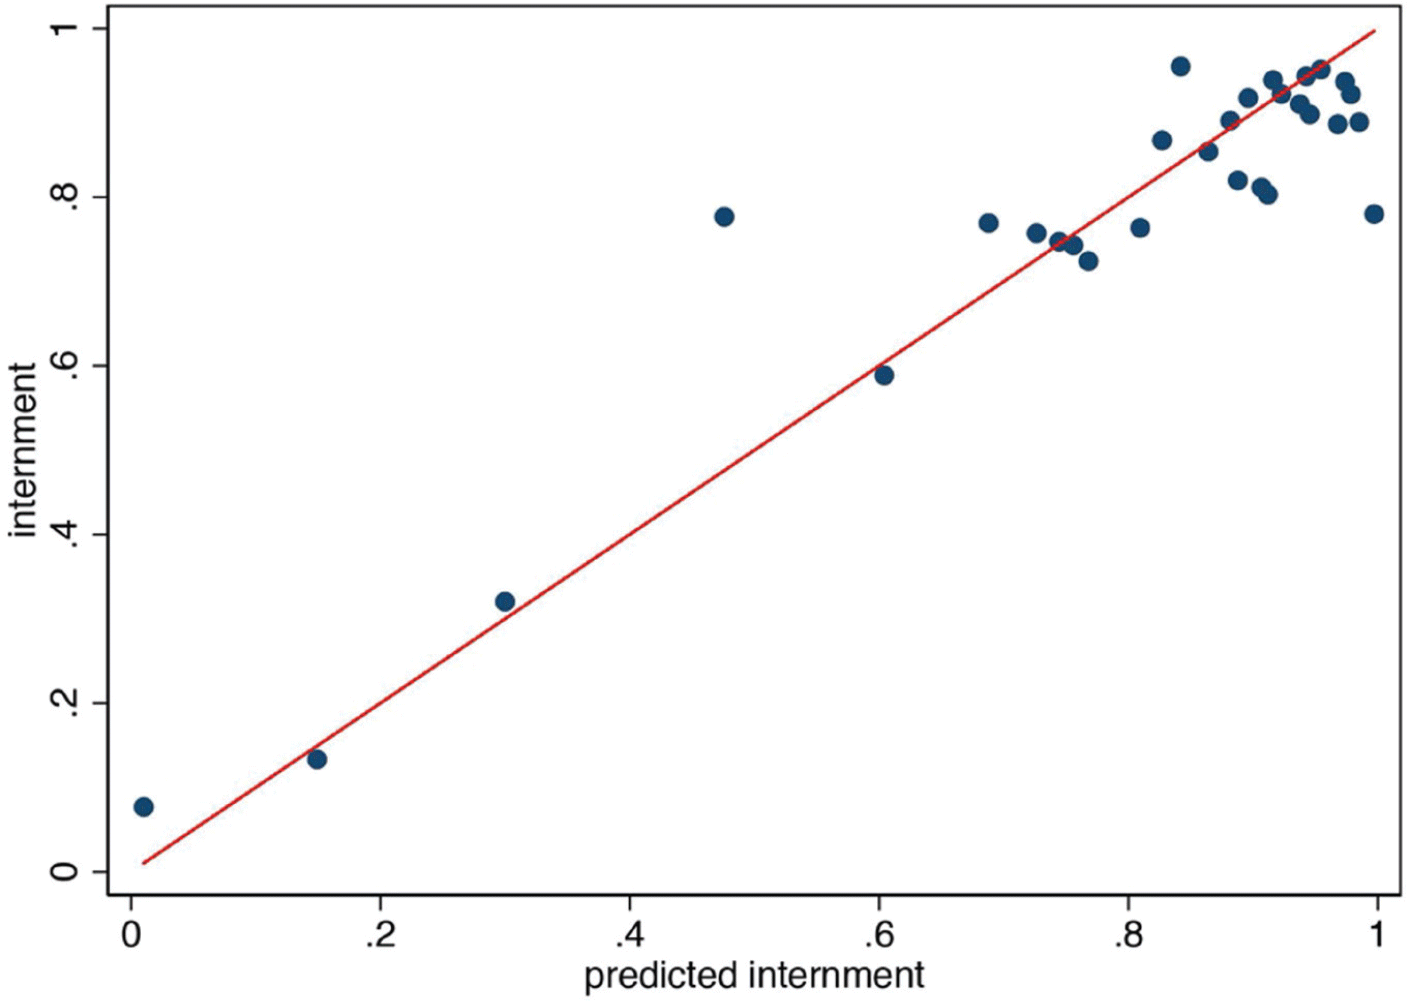
Given that the JARP recorded respondents’ past internment status, I can use it to perform a check of my estimate of Ê[I i |Z i, s it]. I compute the probability of internment for each individual year in the JARP dataset and I compare it to actual internment. Figure 4 is a binned scatterplot of actual versus predicted internment together with the 45-degree line. The points align closely to the 45-degree line, suggesting that my estimate does a good job at predicting internment.
Actual Internment Vs. Predicted Internment
Notes: 45-degree line and binned scatterplot of actual internment against predicted internment in JARP survey data. Probability of internment estimated as explained in the text.
Sources: 1930–1960 Censuses, JARP surveys, and WRA records.

The JARP dataset also allows me to compare the performance of my predictor Ê[I i |Z i, s it] with the performance of a simpler predictor solely based on place of birth. Consider a predictor
 $$\tilde{I}_i$$
, which assigns probability of internment equal to 1 if a Japanese American was born in the West Coast and 0 if born in the rest of the United States, while being undefined for those born in Japan (this is similar to the approach carried out in Chin (Reference Chin2005)). Using JARP, I compute that among the U.S.-born the mean squared error (MSE) of
 $$\tilde{I}_i$$
is equal to 0.172, while the MSE of Ê[I i |Z i, s it] is equal to 0.145. Thus, the drawbacks of using
 $$\tilde{I}_i$$
instead of Ê[I i |Z i, s it] would be (1) not being able to consider those born in Japan (around 35 percent of internees), and (2) among the U.S.-born, an MSE which is 18.6 percent higher.Footnote
37
Estimation and Interpretation of Coefficients
Equipped with Ê[I i |Z i, s it], I now discuss how this allows me to estimate the effect of internment on income, the required assumptions, and the interpretation of the estimated parameter. Going back to Equation (1) and taking conditional expectations,
 $$E\left[ {{y_{it}}{\rm{|}}{Z_i}, s_i^t} \right] = {\alpha _t} + {X^{\prime}_{it}} \gamma + \delta E\left[ {{I_i}{\rm{|}}{Z_i},\;s_i^t} \right] + \beta \left( {E\left[ {{I_i}{\rm{|}}{Z_i},\;s_i^t} \right] \times Pos{t_t}} \right)$$
under the assumption that E[ε it| Z i, s it] = 0. Using the estimated probabilities, β can be estimated from the following DiD regression:
 $${y_{it}} = {\alpha _t} + {X^{\prime}_{it}} \gamma + \delta \hat{E}\left[ {{I_i}{\rm{|}}{Z_i},\;s_i^t} \right] + \beta \left( {\hat{E}\left[ {{I_i}{\rm{|}}{Z_i},\;s_i^t} \right] \times Pos{t_t}} \right) + u_{it}.$$
Some remarks are in order. For Equation (5) to hold, X it is required to be a subset of Z i. This is indeed the case as Z i contains the same information as X it plus Japanese/Chinese origin. In this sense, estimating β through Equation (6) is similar in spirit to an instrumental variables (IV) procedure in which I i is the endogenous variable and ethnic origin and state of residence are the excluded instruments. In this case, I am using fitted values of I i not due to endogeneity concerns, but because I i is unobserved in my main dataset.Footnote 38
Another necessary assumption for this procedure to work is that race and state of residence are indeed excluded instruments, and only affect income through the probability of internment. Since both Japanese and Chinese Americans suffered the same type of pre-war discrimination toward Asians, it is plausible to assume that race has no direct effect on income other than through internment.Footnote 39 Current state of residence as an excluded instrument might be more problematic if there are premiums to residing in one state or another. To address this concern, I estimate versions of Equation (6) in which X it includes fixed effects for five geographical partitions of the United States.Footnote 40 This specification allows for time-invariant location premia, making the new required assumption that before-after changes in location premia only affect income through internment probability.
Under the maintained assumptions, the parameter β can be interpreted as the average treatment effect on the treated thanks to one-sided non-compliance. Since Chinese individuals are interned with zero probability, “always-takers” do not exist and, thus, the population of “treated” and “compliers” are identical (Imbens and Angrist 1994).
Long-Term Impact of Internment on Income
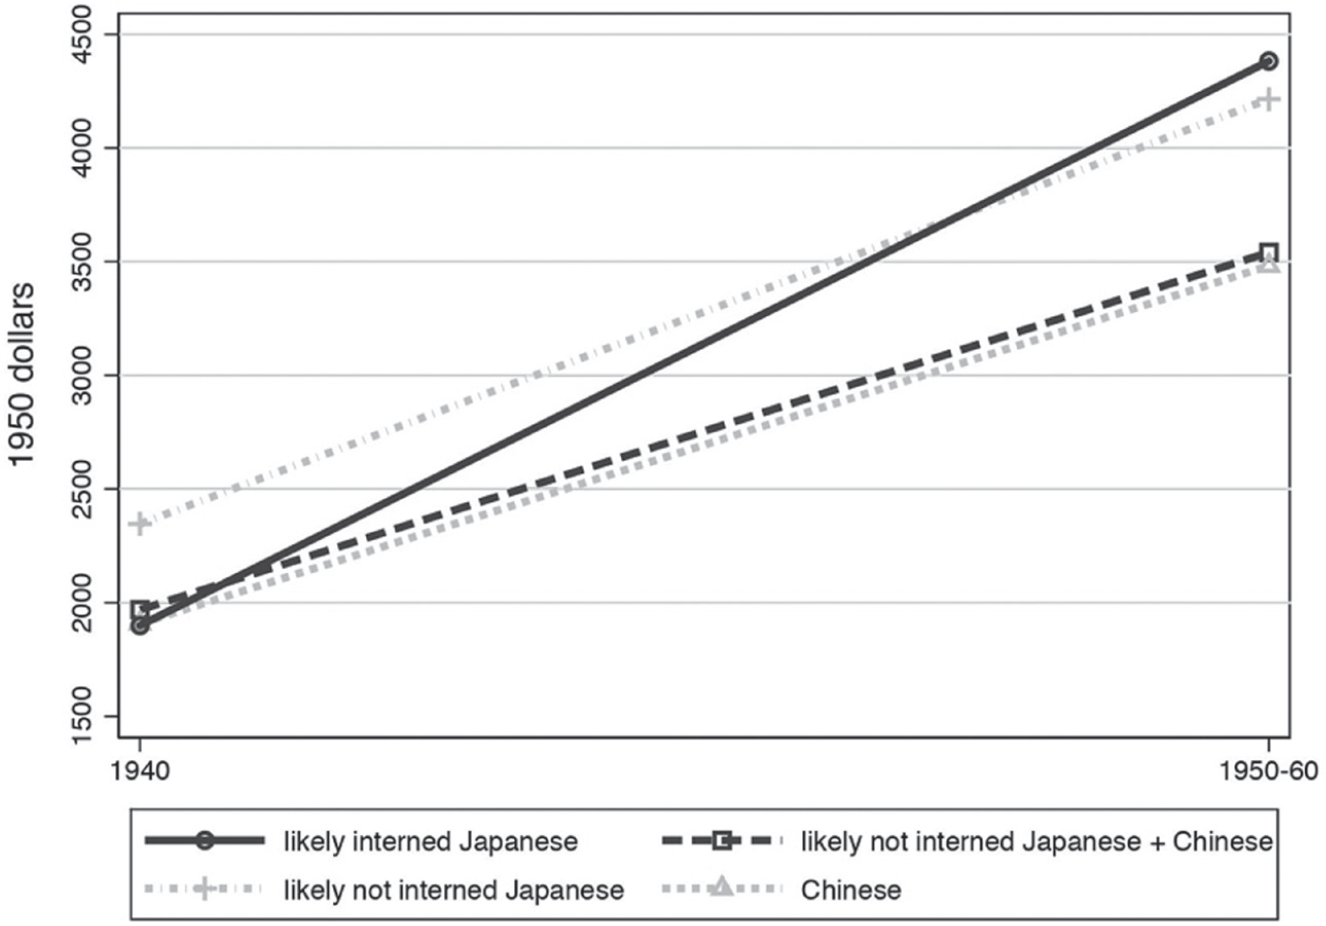
Figure 5 plots raw income averages for likely internees (using the estimated probabilities of internment) and different comparison groups, before and after internment. Internees had similar levels of annual income, around $2,000–$2,500, as non-interned Japanese and West Coast Chinese in 1940. However, the figure shows how internees experienced a higher income growth between 1940 and 1950–60 than any of the three comparison group combinations. I next check whether these patterns hold in a DiD regression framework with different sets of controls.
Average Income Across Time and Groups
Notes: Average total annual income, before and after internment by likelihood of internment. Likely interned are those Japanese with estimated probability of internment greater than .75. Not likely interned are those Japanese with estimated probability of internment less than .25. These two groups include 87 percent of the Japanese sample. Probability of internment estimated as explained in the text. Chinese residing in West Coast States (CA, WA, OR, and AZ). Census person weights are used. Sample: males, who worked for at least 26 weeks during the year, 1896–1924 birth cohorts in 1940, 1950, and 1960 Census.
Sources: 1940–1960 Censuses, JARP surveys, and WRA records.

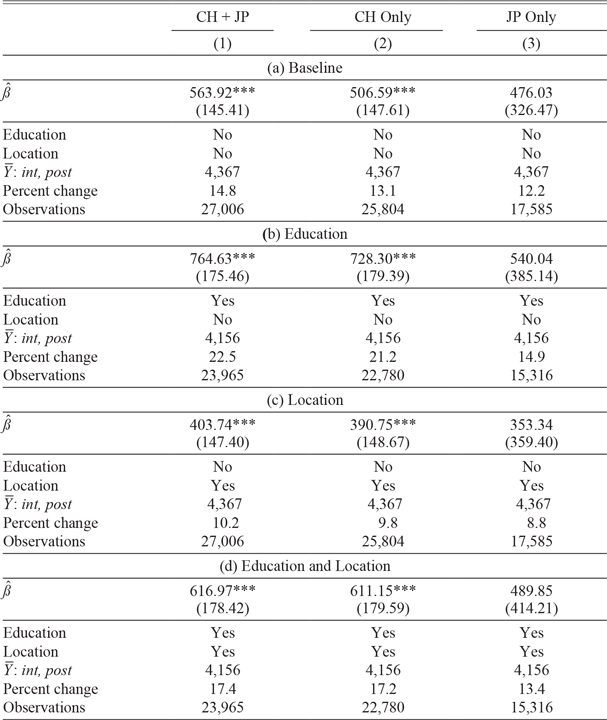
Table 3 shows the results from estimating different specifications of Equation (6). I show estimates of β for different choices of comparison group and different X it regressors. Columns labeled (1) include as comparison group non-interned Japanese and Chinese from the West Coast. In Column (2), I exclude Japanese individuals with zero predicted probability of internment. Column (3) excludes all Chinese individuals and only use non-interned Japanese as a comparison group. I report bootstrap standard errors throughout. These are computed bootstrapping the whole procedure—estimation of Ê[I i |Z i, s it] followed by DiD regressions—and thus take into account the sampling error of my generated regressor.
Effect of Internment on Income—DiD Estimates

* = Significant at the 10 percent level.
** = Significant at the 5 percent level.
*** = Significant at the 1 percent level.
Notes: Point estimates and bootstrap standard errors of the DiD coefficient of Equation (6) in the text, varying the choice of comparison group and regressors. Dependent variable is annual total income in 1950 dollars. All specifications control for age and birthplace. Observations weighted by Census person weights. Education is a dummy variable controlling for high school completion. Location controls for time-invariant fixed effects of five U.S. partitions as described in the text. Males, 1896–1924 birth cohorts who worked at least 26 weeks during the past year. Specifications controlling for education exclude 1920–1924 birth cohorts. Column (1) include Japanese in continental United States and Chinese in the West Coast (AZ, CA, OR, and WA). Column (2) exclude Japanese with zero probability of internment. Column (3) exclude Chinese.
 $$\overline{Y}$$
: int, post is the average total income for internees in 1950–60. Percent change computed as
 $$100 \cdot \hat{\beta}/((\overline{Y}: int, post) - \hat{\beta} )$$
.
Sources: 1940–1960 Censuses, JARP surveys, and WRA records.
Panel A shows estimates of β for the baseline specification, where X it includes a quadratic in age and birthplace dummies.
Footnote 41
Estimates of the effect of internment on income range from $476.03 when only using the Japanese as a comparison group, to $563.92 when using both Chinese and non-interned Japanese. This translates to increases in annual income of between 12.2 and 14.8 percent (with respect to the counterfactual average income implied by
 $$\hat{\beta}$$
). Coefficients are significant at standard confidence levels except for the specification that excludes the Chinese. The relatively small number of non-interned Japanese makes this estimate noisy, but similar in magnitude to the more precisely estimated ones that include the Chinese. This feature is common across the four panels.
Panel B adds education to the set of controls, in the form of a dummy variable that equals one if a respondent has a high school diploma. Footnote 42 In this panel and other specifications controlling for education, I exclude the youngest set of cohorts, those born between 1920 and 1924. I do so in case internment affected education decisions for these younger cohorts, so as to not control for an endogenous outcome. The estimated effects of internment are somewhat larger than in the baseline, ranging from $540.04 (15 percent increase) when excluding the Chinese to $764.63 (22 percent increase) when using the full sample.
Panel C controls for current location of residence, in the form of fixed effects for the five geographical partitions described earlier. Under this specification, the estimates of the effect of internment on income are still positive and significant, although smaller in magnitude than the previous one. The effect ranges now between $353.34 (8.8 percent increase) to $403.74 (10.2 percent increase), depending on which comparison group is used. The smaller estimates compared to those of Panel A already suggest geographic mobility as a mechanism.
Panel D specifications include both education and location controls. The estimated effects, in this case, are smaller than the ones obtained on Panel B. They range from $489.85 (13.4 percent increase) when excluding Chinese to $616.97 (17.4 percent increase) when using the whole sample. In the same way, as in the previous panels, these two estimates are statistically significant at the usual levels while the estimate that excludes the Chinese is not.
The graphical and DiD results imply that internment led individuals to, on average, generate higher incomes in the long term. This finding is robust to a range of different specifications that vary both the choice of the comparison group as well as the set of controls used in the regressions. The estimated effects on income are economically meaningful, with the more conservative ones implying an average increase in annual income with respect to the counterfactual of about 9 percent. As a benchmark, Goldin and Katz (Reference Goldin and Katz2009) document that in 1960 the high school wage premium was between 17 and 26 percent. Footnote 43
Additional Robustness Checks
In Online Appendix D, I study the sensitivity of the estimated effects to “worst-case” scenarios of negatively selected migration to Japan. I do this by combining historical accounts on the number of people who left with an empirical “worst-case” exercise in the spirit of Lee (Reference Lee2009) and Horowitz and Manski (2000). I add “placebo” internee observations to the post period with very low-income realizations, and check DiD estimates under these conditions. This exercise results in positive effects even under very conservative (and arguably implausible) assumptions. Thus, the estimated long-term positive income effects of internment are unlikely to be driven by negatively selected migrants to Japan.
Additional results in Online Appendix A replicate Table 3 using data only from 1940 and 1960, or using alternative income measures. Footnote 44 Lastly, Online Appendix Table A5 shows that there is no evidence of internment leading to endogenous selection into the DiD sample (i.e., through labor force participation).
Mechanisms
Uncovering the channels underpinning the effects on income is challenging due to the multifaceted nature of internment, the long-term timing of the outcomes I study, and data limitations. Additionally, it is not feasible to cleanly separate the effects of displacement from the effects of incarceration, or the interaction between the two. With these caveats in mind, I show evidence consistent with two complementary mechanisms: the re-optimization of location and occupational choices, and positive effects arising from the camps’ economic and human capital diversity. I note that these two channels are likely not exhaustive and there are plausible further mechanisms I cannot explore. In any case, Online Appendix F shows that the data offer little support for certain potential channels such as labor supply increases, changing attitudes toward work, or changes in the attachment toward Japan and the Japanese language.
Occupational Change and Migration
Labor market and migration frictions could have prevented many Japanese Americans from choosing pre-internment locations and jobs that maximized their long-run labor market outcomes. Footnote 45 Because internees were forced to start over after internment, they may have migrated to areas and occupations where opportunities were greater for them.Footnote 46 This could have happened even after a negative wealth shock due to adjustment costs, or lack of information about outside opportunities. The DiD effects from Table 3—smaller when including regional fixed effects—are already suggestive of migration as a potential mechanism.
Historical accounts suggest increased mobility as a mechanism. A contemporaneous report (Okubo et al. 1943), citing a survey carried out in Granada camp, CO, states:
Of this sample […], 51% stated that they intended to continue their previous occupation, while almost as many (47.5%) indicated that they wanted to adopt an entirely new occupation. […] Apparently any changes made will be major changes into new and untried occupations widely different from former work. This is partly due to the war-time economy, no doubt, but it also reflects the desire of persons long frustrated in their efforts to enter certain occupations (particularly skilled and semi-skilled ones) which they have been barred from entering by social barriers in the West Coast states (p. 30).
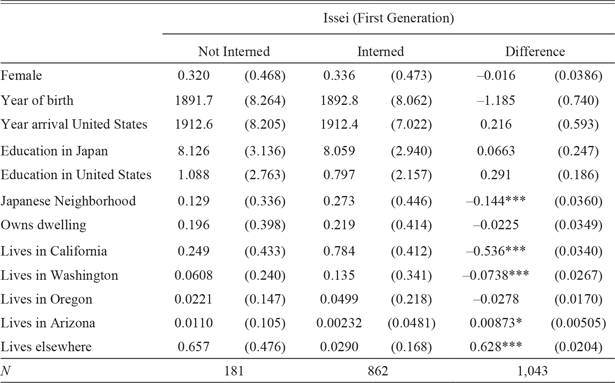
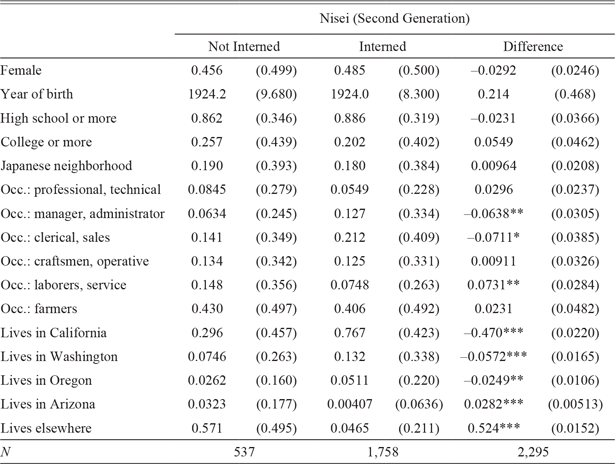
I analyze the location and occupation transitions of internees before and after internment, comparing them to those of non-interned Japanese Americans. I do so leveraging the longitudinal aspect of some JARP questions together with observed past internment status. First, I check the comparability of the two groups before internment. Table 4 shows that, on average, interned and non-interned Issei were equally likely to be female, had the same age, arrived in the United States at similar times, had similar education levels, and were equally likely to be homeowners. As expected, they lived in different parts of the country, and interned Issei were more likely to live in a Japanese neighborhood. Table 5 shows similar statistics for the Nisei: interned and non-interned Nisei were on average equally likely to be female, had similar ages, education, and probability of living in a Japanese neighborhood. They were equally likely to be in farming, professional and technical, or craft occupations. Some differences arise in the Nisei occupational distributions, but they are not large.
Jarp Baseline Summary Statistics—First Generation

Difference in means:
* = Significant at the 10 percent level.
** = Significant at the 5 percent level.
*** = Significant at the 1 percent level.
Note: Neighborhood, dwelling ownership, and state of residence variables refer to the time period 1932–1941.
Source: JARP surveys.
Overall, Tables 4 and 5 show that, although living in different parts of the country, interned and non-interned Japanese Americans were comparable at baseline. As such, it seems a reasonable assumption to attribute differential migration or occupational mobility patterns to the large shock that internment represented.
Jarp Baseline Summary Statistics—Second Generation

Difference in means:
* = Significant at the 10 percent level.
** = Significant at the 5 percent level.
*** = Significant at the 1 percent level.
Note: Neighborhood, occupation, and state of residence variables refer to the time period 1932–1941.
Source: JARP surveys.
Occupational Change
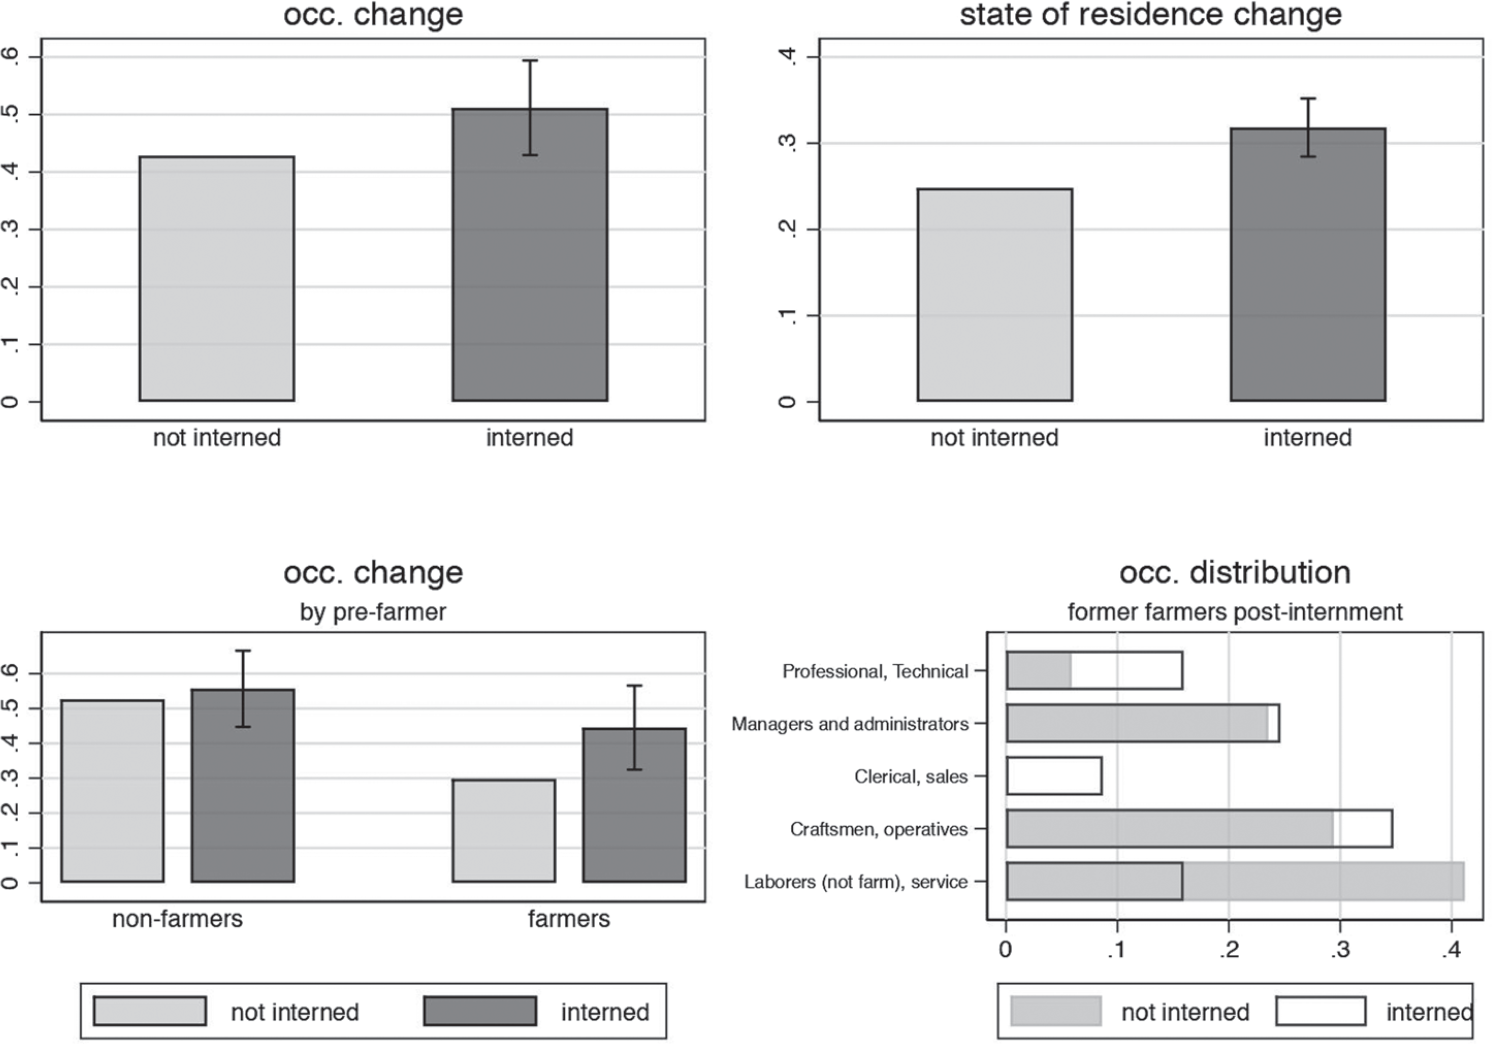
The top-left panel of Figure 6 shows that 42 percent of non-interned Nisei held different occupations before and after WWII. This number is equal to 50 percent for interned respondents, and the difference is significant at the 95 percent level. Thus, interned Japanese Americans were more likely to hold a new occupation after WWII than those who were not interned.
Occupational and Geographic Mobility
Notes: Occupations: Second-generation JARP respondents. State of residence: First- and second-generation JARP respondents. Occupation change equals one if respondent stated that the main occupation held in 1932–41 was different from that in 1946–52. State of residence change equals one if respondent stated that their main residence in 1932–41 was different from that in 1946–52. 95 percent confidence intervals computed using robust standard errors from regressing an occupational/state of residence change dummy on an internment dummy.
Sources: JARP surveys.

Many Nisei were farmers or farm laborers before internment. Once we break down overall occupational change based on baseline occupation, differential occupation switching is driven by those who were farmers before internment. The bottom-left panel of Figure 6 shows that, while non-farmers were equally likely to change occupation (between 51–52 percent of them did), interned farmers were more likely to hold a different occupation after internment than their non-interned counterparts (42 vs. 30 percent). What were these ex-farmers doing after internment? The bottom-right panel of Figure 6 shows that the answer to this question is different for ex-farmers who were interned and those that were not. Farmers who were interned and changed occupations were more likely to switch to professional and technical or clerical occupations, while non-interned former farmers were more likely to transition to laborer or service jobs. Footnote 47
Migration
The top-right panel of Figure 6 plots the proportion of JARP respondents who lived in different states before and after internment, by internment status. Internees were more likely to have migrated to another state (31 percent versus 25 percent of non-internees). These statistics do not capture temporary moves immediately after internment since the survey asked for the main state of residence between 1946 and 1952. Online Appendix E shows that the destination states movers went to experienced higher post-war economic growth than the ones they left behind.
The geographical mobility of internees was coupled with moves into less segregated neighborhoods, according to JARP respondents. Online Appendix Figure A9 shows that the fraction of Japanese Americans who lived in self-described “mostly Japanese” neighborhoods was declining in a secular way before and after internment, for interned and non-interned Japanese Americans alike. However, the data suggest that this decline accelerated after internment for former internees, relative to non-interned Japanese Americans.Footnote 48
Human Capital and Peer Exposure Effects
While I am not able to test for a direct link between human capital and peer exposure effects and later incomes, I provide suggestive evidence consistent with this channel. First, I quantify the ten camps’ high economic and human capital diversity and show that most internees were exposed to more high-skill persons in the camps than in their previous communities. Second, I provide evidence of a decrease in group income inequality and a decrease in the intergenerational correlation of income, driven by children of poorer families. These last two results are consistent with the initially less skilled internees seeing their labor-market outcomes improve the most, which we would expect from positive effects enabled by exposure to economic and human capital diversity.Footnote 49
Quantifying Diversity
Using WRA internment records, Figure 1 plots the distribution of occupational skills, the distribution of educational attainment of adult internees, and the distribution of the previous place of residence size. The figure shows how Japanese Americans had diverse backgrounds and skills, and how this diversity was present in each of the ten internment camps. Comparing camp records to finely geocoded 1940 Census data, Table 1 shows that most internees were surrounded in the camps by higher numbers of highly educated and highly skilled individuals than in their pre-internment communities (see the description of Table 1 in the Historical Background section).
Income Inequality
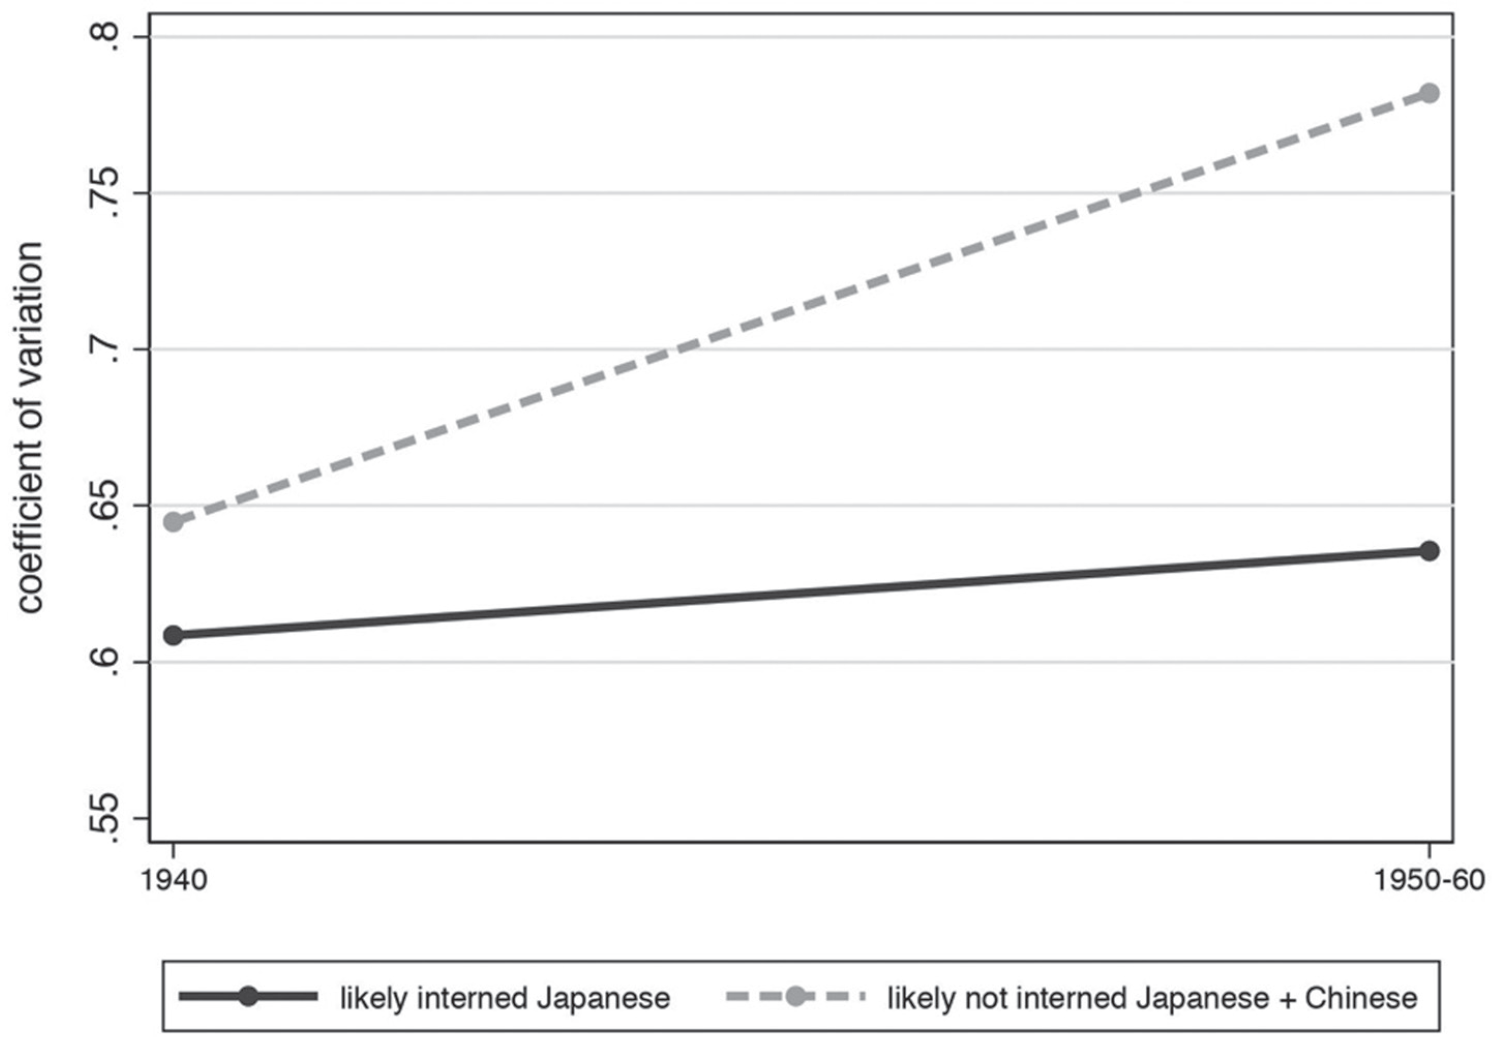
Figure 7 shows that Census data are consistent with internees becoming more equal, as a group, in terms of income. I plot the trend in the coefficient of variation of income as a measure of inequality for likely internees, together with that of non-interned Japanese and West Coast Chinese as a comparison. While inequality increased for internees after internment (from a coefficient of variation of 0.61 to 0.63), that of the comparison group increased substantially more (from 0.65 to 0.78). Under a parallel trends assumption, this would suggest that internment turned internees into a more homogeneous group.
Income Inequality Trend
Notes: Coefficient of variation of total annual income, before and after internment by likelihood of internment. Likely interned are those Japanese with estimated probability of internment greater than .75. Not likely interned are those Japanese with estimated probability of internment less than .25. These two groups include 87 percent of the Japanese sample. Probability of internment estimated as explained in the text. Chinese residing in West Coast States (CA, WA, OR, and AZ). Census person weights are used. Sample: males, who worked for at least 26 weeks during the year, 1896–1924 birth cohorts in 1940, 1950, and 1960 Census.
Sources: 1940–1960 Censuses, JARP surveys, and WRA records.

Intergenerational Income Correlations
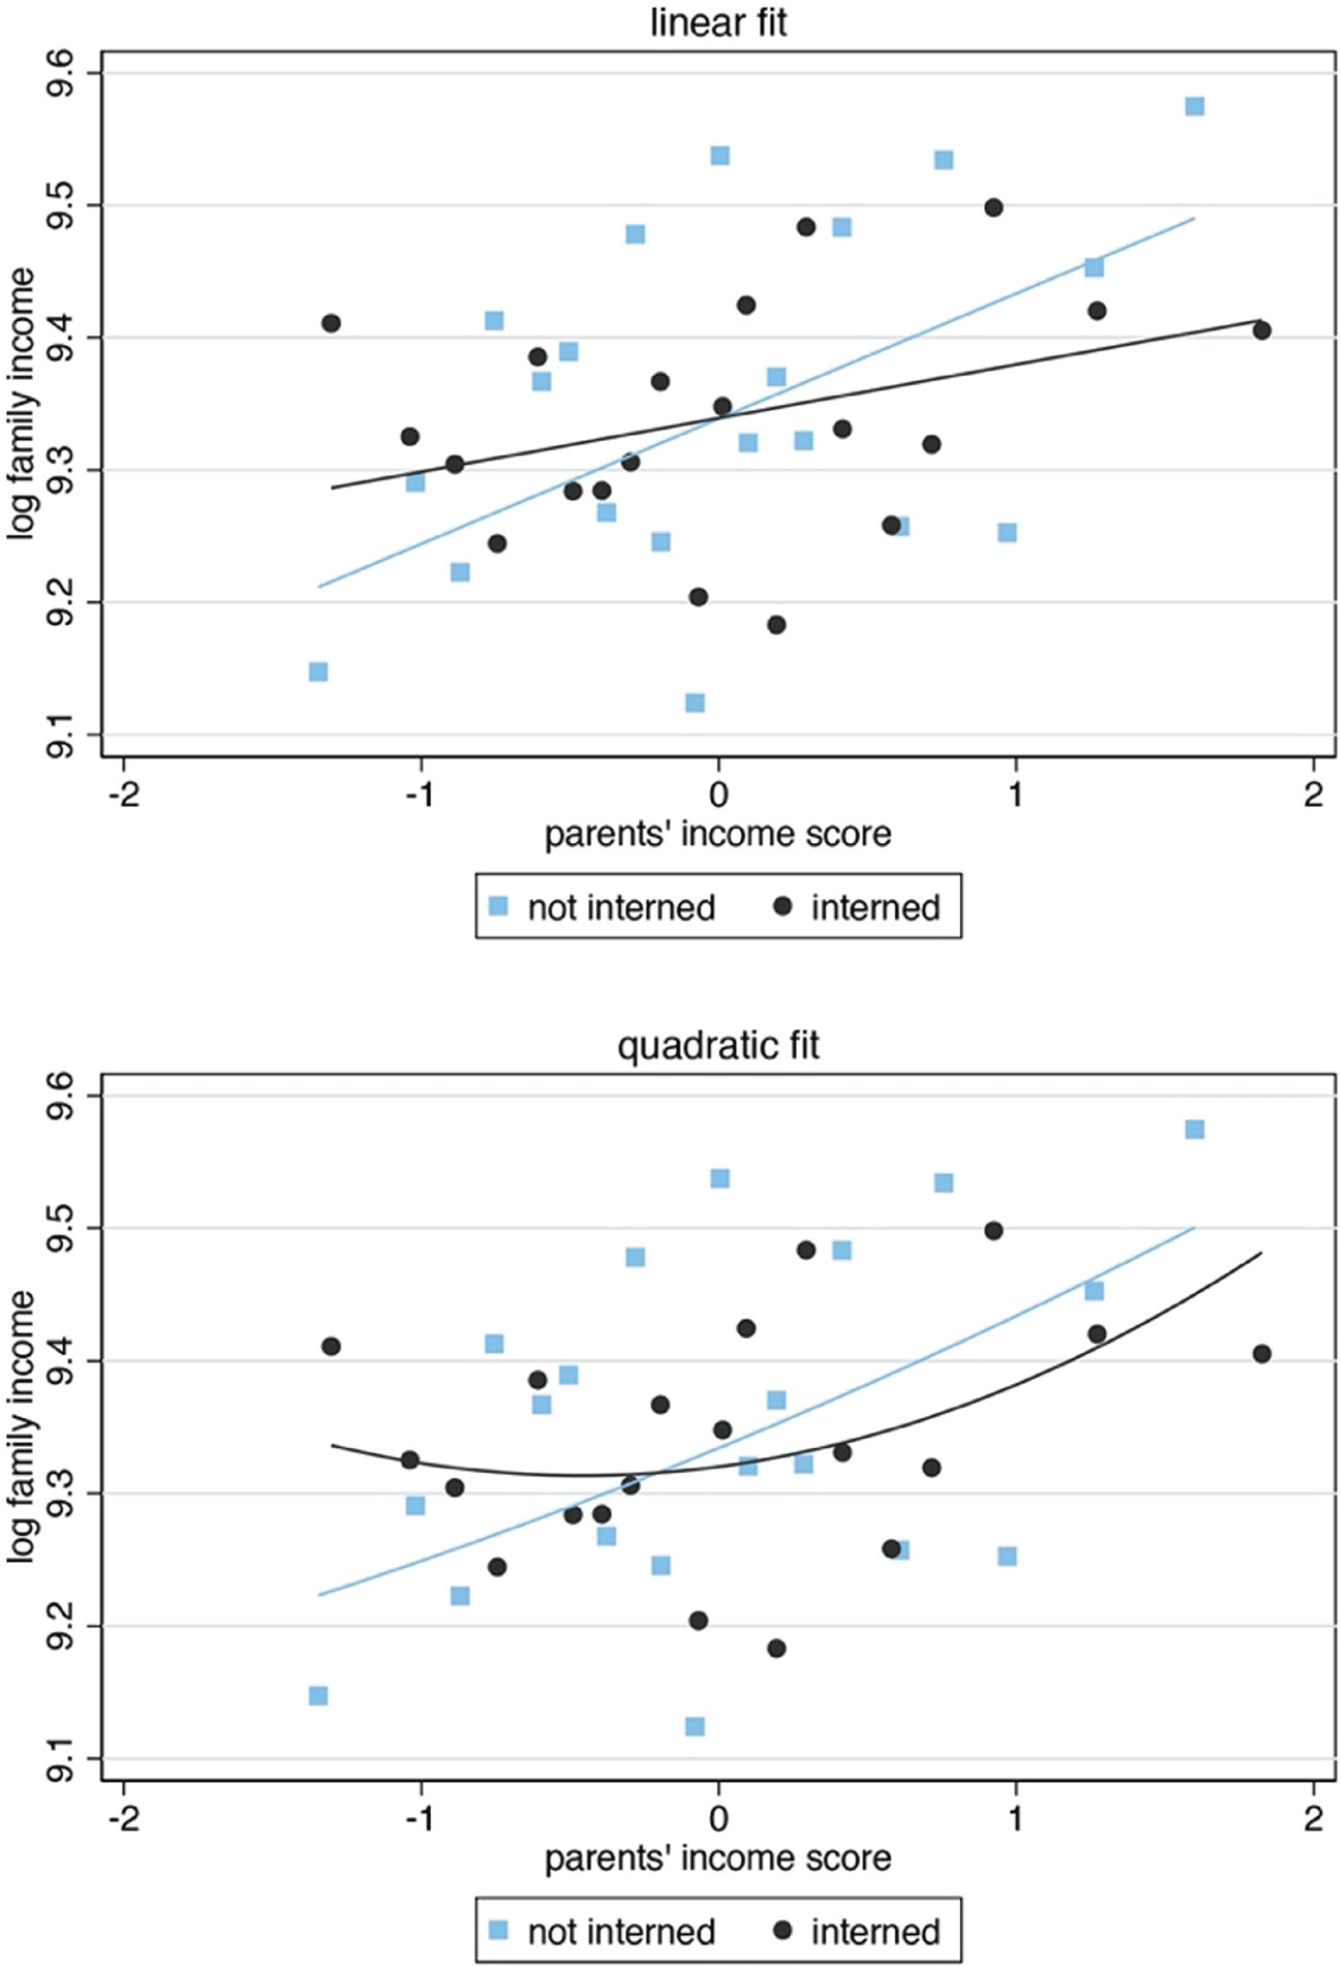
Using JARP data featuring family linkages, past internment, and family income in the 1960s, I test whether the correlation between Nisei incomes and that of their parents is different across interned and non-interned respondents.Footnote 50 For each Issei respondent, I compute a residual income measure that nets out age, sex of respondent, and past internment. This Issei income score is meant to capture earnings potential abstracting from age and internment effects. Figure 8 shows binned scatterplots of the relationship between Nisei incomes and the income score of their parents, separately by past internment status. The top panel (linear fit line) shows that the relationship between children’s incomes and their parents’ income scores is weaker for Japanese Americans who were interned. The bottom panel (quadratic fit line) suggests that the weaker relationship is mostly coming from children of poorer families. Footnote 51
Intergenerational Income Correlation
Notes: Binned scatterplots. Second-generation JARP respondents log family income as a function of their parents’ residual income, by past interment status, and controlling for past internment status. N = 1,584. Parents’ income residualized of past internment status, a quadratic of age, year of interview dummies, and sex. Both parents’ and sons’ incomes are midpoints of reported income brackets. Top panel plots a linear fit and bottom panel plots a quadratic one.
Source: JARP surveys.

Model-Based Measures of Occupational Barriers
The previous section proposes that the need to re-optimize after internment led former internees to access different locations and occupations than the ones they would have had in the absence of internment. Additionally, I have shown evidence suggesting such moves could have been facilitated by camp interactions. That is, an interpretation of the evidence is that displacement and internment reduced frictions preventing individuals to access their most productive occupations and locations.
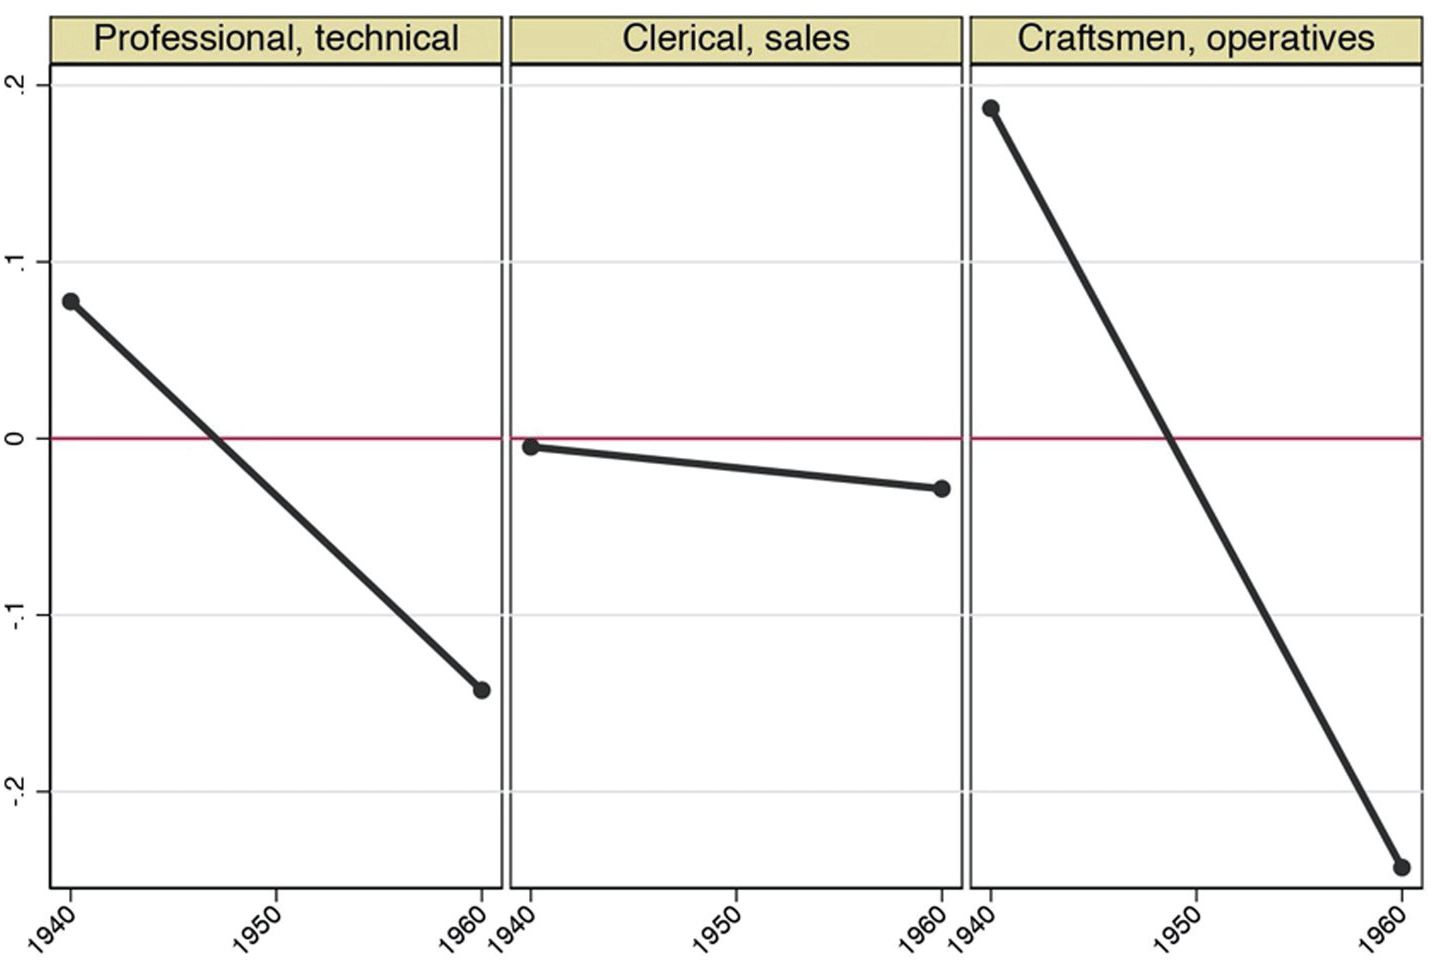
To cast further light on this hypothesis, I borrow and empirically adapt a logistic model of occupational choice from Hsieh et al. (2013) which features group-times-occupation-specific frictions.Footnote 52 Through the lens of this model, I interpret observable statistics of the occupation and income distributions as the barriers that each group (internees vs. non-internees) faced when accessing different occupations. I compute these model-implied frictions in Census data separately before and after internment, and study the evolution of barriers faced by internees relative to non-internees. I relegate the full presentation of the model to Online Appendix G. Here I describe the main intuitions and the empirical results.
Model of Occupational Choice with Frictions
Individuals are categorized by the group they belong to (i.e., internees vs. non-internees) and a randomly drawn vector of occupation-specific talents. Individuals’ occupational choice is distorted by frictions that vary across occupations j and groups g. Such frictions come in two forms:
 $$\tau _{jg}^w$$
is a labor market friction acting as a tax on earnings for individuals of group g employed in occupation j; it can be interpreted as an occupation-group specific form of wage discrimination. Additionally,
 $$\tau _{jg}^h$$
represents a human capital friction acting as a mark-up on educational expenditures that makes it harder for individuals in group g to acquire human capital to work in occupation j; it can be interpreted as barriers that prevent individuals from acquiring the skills or information that are relevant to access an occupation. The usefulness of the model is that it allows to back out from the data measures of
 $${\tau _{jg}}$$
, a composite of labor market and human capital frictions defined as
 $${\tau _{jg}} \equiv \frac{{{{\left( {1 + \tau _{jg}^h} \right)}^\eta }}}{{1 - \tau _{jg}^w}}$$
, where η is a parameter of the human capital investment function.
Empirical Implementation
In equilibrium, the model allows expressing the relative frictions that group g = i (the interned) face with respect to those of group g = c (the non-interned) for each occupation j in terms of employment proportions across occupations and overall wage gaps:

where p jg is the fraction of group g employed in occupation j, and
 $${\overline{wage}_g}$$
is the average wage of group g. As such, the relative composite friction for occupation j for group i is expressed in terms of the occupational odds ratios, normalized by the wage gap, and scaled by the parameters θ and η.
Footnote 53
Equation (7) corresponds to the composite friction, containing both labor market discrimination and human capital barriers. Assuming that both groups faced the same labor market discrimination due to their Asian origin then:
 $$\tau _{ji}^w = \tau _{jc}^w \forall j,$$
and we can interpret Equation (7) as capturing the difference in human capital frictions internees faced with respect to their DiD comparison group. These types of frictions—that is, barriers preventing individuals from acquiring skills or information—are the ones internment most likely could affect. Note that even if the assumption in Equation (8) does not hold, the right-hand side of Equation (7) can still be interpretable as a composite of the labor market and human capital frictions.
Empirical Results
I compute measures of the relative frictions faced by internees following Equation (7). I do this separately in 1940 and 1960 Census data and analyze their evolution before and after internment. I use the same sample as in the DiD analysis,
Footnote 54
and I compute average wage gaps
 $${\overline{wage}_i}/{\overline{wage}_c}$$
using total annual income. I assign individuals to seven occupational categories, consistent with those in JARP survey, where one of them is the home sector.
Figure 9 shows the evolution of
 $$(\widehat{\tau_{ji} / \tau_{jc}})$$
, the barriers faced by internees, relative to the comparison group, in accessing three relevant occupational categories: professional, white-collar, and blue-collar occupations.
Footnote 55
A value of zero for a given occupation indicates that internees, as a group, faced the same level of frictions as non-interned Japanese Americans and West Coast Chinese. Figure 9 shows that, between 1940 and 1960, the barriers faced by internees when accessing these occupations fell significantly with respect to the comparison group. Before internment, internees faced higher barriers to accessing professional and blue-collar jobs, and similar barriers to accessing white-collar jobs. However, by 1960 the picture had flipped and former internees now faced less labor market and human capital barriers in all three of these broad occupational categories. These results suggest that the internment experience lowered frictions that prevented West Coast Japanese Americans from accessing these occupations.
Occupational Frictions, Internees Relative to Non-Internees
Notes: Occupation-internees-specific frictions implied by Roy model, relative to non-interned Japanese and West Coast Chinese. Likely interned are those Japanese with estimated probability of internment greater than .75. Not likely interned are those Japanese with estimated probability of internment less than .25. These two groups include 87 percent of the Japanese sample. Computed in 1940 and 1960 Censuses using Hsieh et al. (2013) parameter estimates.
Sources: 1940–1960 Censuses, JARP surveys, and WRA records.

Conclusion
This paper has studied the career consequences of the forced removal and internment of thousands of West Coast Japanese Americans during WWII. To do so, I have combined different publicly available data sources from before, during, and after the episode: Census data, administrative camp records, and a 1960s sociological survey of Japanese Americans. By combining these datasets, I have been able to develop a method that computes a nonparametric estimate of a person’s probability of internment based on Census observables. Thanks to this method, I have estimated the long-run effect of internment on earnings using Census repeated cross-sections and a DiD approach, using the fact that West Coast Chinese Americans and Japanese Americans living outside the West Coast were not affected by this episode. The results from this exercise imply that 5 and 15 years later, internment caused former internees to generate annual incomes that were on average between 9 and 22 percent higher than the counterfactual.
The positive effect of internment on long-run earnings, although in line with recent evidence on forced migration, can be surprising when considering the forced nature of the removal, the asset and income losses that internees experienced, and the lost labor market attachment during internment. However, my investigation of the mechanisms suggests a re-optimization of job and location choices after internment (up the job ladder, and to higher-growth states) as an explanation of the positive effects. The nature of the displacement meant that after leaving camps, many internees had to start from scratch in a way in which frictions that typically prevent mobility—adjustment and migration costs, community ties—were less prevalent. I have also provided some suggestive evidence consistent with the idea that the unique and new communities that arose in the camps could have facilitated mobility through the exchange of information and skills. If and when better data become available, it would be interesting to have more research further explore this channel.
The overcoming of barriers and frictions limiting Japanese Americans’ access to their most productive locations and occupations is arguably related, intimately, to the fact that they were first- and second-generation immigrants. Barriers to mobility can be higher among immigrants since, throughout history, they have relied on co-ethnic networks. As such, this paper and the historical episode it studies provide an opportunity to better understand the process by which immigrants overcome mobility frictions and advance economically in their new countries.
Japanese American internment constituted a grave violation of civil rights and personal freedoms whose costs are vast and hard to quantify. In all my empirical analysis I do not speak to these costs. However, the findings of this paper do provide some hopeful evidence on the ability of individuals to take the opportunities that a negative shock presents and overcome adversity in the long run. Further, it provides insight into the importance of barriers to occupation and geographic mobility, and some notions on mechanisms that might lower these barriers.