Quantitative echocardiographic assessment of dimensions and function of the right ventricle is challenging due to its unique geometry, anatomic segments, and anterior position. Reference Lai, Geva and Shirali1–Reference Oe, Gorcsan and Mandarino3 In addition, the right ventricle has a complex contraction pattern incorporating motion along three axes: longitudinal shortening, radial motion of the free wall, and anteroposterior shortening by stretching the free wall over the septum. Reference Kovács, Lakatos, Tokodi and Merkely4 Obtaining right ventricular measurements is critical in patients with tetralogy of Fallot because these measurements often impact the timing of secondary interventional or surgical procedures. The initial tetralogy of Fallot repair requires relief of right ventricular outflow tract obstruction and typically causes chronic pulmonary insufficiency and volume overload. Pulmonary insufficiency may be well-tolerated for several years but usually results in progressive right ventricular dilation and dysfunction. Reference Gatzoulis, Balaji and Webber5 Right ventricular dysfunction may present as decreased exercise capacity, atrial and ventricular arrhythmias, and even sudden death. Reference Gatzoulis, Balaji and Webber5–Reference Knauth, Gauvreau and Powell7
Timing of re-intervention after tetralogy of Fallot repair remains a highly debated topic. Reference Geva8,Reference Therrien, Provost and Merchant9 Ideally, a chronically insufficient pulmonary valve would be replaced before any irreversible right ventricular dysfunction occurs, but not so early as to add significantly to the number of times the valve will need to be replaced over the patient’s lifetime. Cardiac MRI has emerged as the gold standard for the comprehensive assessment of the right ventricle because it requires no geometric assumptions and has good reproducibility, but it is time-consuming, expensive, and may require general anesthesia. Reference Iriart, Montaudon and Lafitte10–Reference Geva12 By contrast, transthoracic echocardiography is usually faster, less expensive, and done with light or no sedation.
Three-dimensional echocardiography is also used in clinical practice to obtain a volumetric data set which can then be analysed to calculate dimensions and area change. Studies, however, have found that obtaining accurate three-dimensional right ventricular measurements in patients with tetralogy of Fallot is significantly limited by the patient’s acoustic windows and often underestimate the right ventricular volume as determined by cardiac MRI. Reference Koestenberger and Friedberg13–Reference Grewal, Majdalany and Syed15 Therefore, although three-dimensional echocardiography may be useful for seeing trends in a patient’s right ventricular volume, it has not supplanted the use of cardiac MRI for the tetralogy of Fallot population. In addition, many paediatric sonographers do not obtain training in three-dimensional echocardiography so the clinical applicability of it remains limited to large cardiac centers.
To assess right ventricular dimensions and function by echocardiography, several manual and semi-automated measures are often used together because no single measure has proven to be accurate and complete. The American Society of Echocardiography encourages quantitative echocardiographic assessment of the right ventricle, including two-dimensional linear measurements (longitudinal length, end-diastolic basal diameter, and mid-cavitary diameter), and functional measurements including end diastolic area, end-systolic area, fractional area change and tricuspid annular plane systolic excursion. Reference Lopez, Colan and Frommelt16
Automated and semi-automated software may perform right ventricular measurements more rapidly and consistently than manual methods. Reference Medvedofsky, Addetia and Hamilton17–Reference Penk, Mukadam and Zaidi19 One such software, EchoInsight® (Epsilon Imaging), uses speckle tracking to perform semi-automated measurements of right ventricular dimensions, fractional area change, and tricuspid annular plane systolic excursion. For patients with hypoplastic left heart syndrome, semi-automated measurements of dimensions of the systemic right ventricle and fractional area change using this software were similar to manual measurements. Reference Penk, Mukadam and Zaidi19 Our study aimed to quantify the correlation and agreement between semi-automated right ventricular measurements using EchoInsight® with manual measurements in pediatric patients with tetralogy of Fallot.
Methods
Study population
After approval by the Institutional Review Board, subjects with tetralogy of Fallot were prospectively identified when they presented for a clinic visit that included an echocardiogram or when they underwent an echocardiogram during a hospitalisation. All possible participants received an informational sheet about the study, and parents were able to decline the use of their child’s images. The subjects were divided into four age groups: 0 to 4 months, 4 months 1 day to 12 months, 12 months 1 day to 12 years, and 12 years 1 day to 18 years. Demographic data obtained included weight, height, age, and sex. Patients with inadequate images for analysis were excluded. These included studies that failed to obtain all necessary views, were unable to see a portion of the myocardium, or obtained images of the myocardium that were not sufficient quality for analysis. In total, 41 of the 46 patients enrolled had undergone complete surgical repair while the remaining five patients were either surgically palliated or unrepaired at the time of the study.
Two-dimensional echocardiogram image acquisition
Transthoracic echocardiogram 4-chamber images were obtained using either Philips iE33 or EPIQ 7 ultrasound systems (Philips Healthcare, Andover, MA). Acquired images were stored for off-line analysis, and post-processing was performed on a Merge Cardio Workstation (Merge Healthcare, Chicago, IL) and compressed to 30 frames per second in this process. A single cardiac cycle of the apical 4-chamber view was used to make linear measurements, end-systolic area, end-diastolic area, and fractional area change. An M-Mode measurement of the movement of the lateral tricuspid annulus toward the apex in systole was needed for tricuspid annular plane systolic excursion.
Manual measurements
Manual measurements were performed according to the American Society of Echocardiography (ASE) 2010 guidelines for quantification methods during pediatric echocardiograms. Reference Lopez, Colan and Frommelt16 Right ventricular linear dimensions were obtained at end-diastole. Length was measured on the long axis from the tricuspid valve annular plane to the right ventricular apex. Basal diameter was measured as the maximal minor-axis dimension in the basal one-third of the right ventricle. The mid-cavity diameter was measured at the level of the papillary muscles and the middle one-third of the right ventricular cavity. For right ventricular fractional area change, the right ventricular endocardial border was traced at end-diastole between the trabeculae and compacted myocardium, when the tricuspid valve closes to obtain the end-diastolic area. The right ventricular endocardial border was traced on the frame immediately prior to the tricuspid valve opening to obtain end-systolic area. Right ventricular fractional area change was calculated as [(end-diastolic area − end-systolic area)/end-diastolic area × 100] expressed as a percentage. For tricuspid annular plane systolic excursion, an M-Mode tracing of the lateral tricuspid valve annulus was recorded to measure the movement in millimeters of the tricuspid valve towards the apex.
Semi-automated measurements
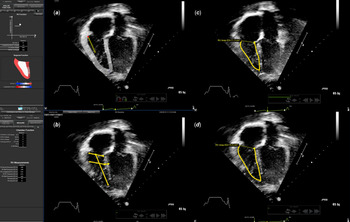
The selected apical 4-chamber images were analyzed using the right ventricle specific protocol of the EchoInsight® software (Epsilon Imaging, Ann Arbor, MI). The software chooses end-diastole as the frame with the largest right ventricular area and end-systole as the frame with the smallest right ventricular area. The right ventricular endocardial border was then traced in end-diastole with manual input, after which the software performed an automated epicardial border refinement process. The software then employs speckle-tracking technology to monitor frame-by-frame myocardial movement during a single cardiac cycle (Fig 1). Manual adjustments to “fine tune” the tracing were not made as this study attempted to compare the unaltered automated measures with manual measures. Tricuspid annular plane systolic excursion was measured by the software from apical images as the distance that the lateral tricuspid valve annulus (tracked in two-dimension) moved towards the apex in systole. This measurement was also not manually adjusted, even if the direction of movement chosen by the software was not pointing directly at the apex.
Echolnsight® semi–automated measurements. A: Apical four-chamber with the initial, user-assisted, trace of the right ventricular myocardium in end–diastole that informs the Echolnight® software where to track. The arrow represents the tracking of the direction and displacement of the lateral tricuspid valve hinge used to measure tricuspid annular plane systolic excursion. B: Echolnsight® tracing of the right ventricular basilar, mid–cavitary, and longitudinal dimensions. C: Echolnsight® tracing of the right ventricular end–systolic area. D: Echolnsight® tracing ofthe right ventricular end–diastolic area.

Reliability analysis
Intra- and inter-rater reliability analyses were performed on 20 randomly selected images from the cohort with the observers blinded to patient identifiers. Intra-rater reproducibility was assessed on repeated assessments done a minimum of 2 weeks apart by a single observer. Two different observers separately conducted both manual and semi-automated assessments to produce the inter-rater data. Reliability was assessed using intraclass correlation coefficients with 95% confidence intervals. An intraclass correlation coefficient ranges from 0 to 1 and a value closer to 1 indicates higher reliability. Reliability was deemed acceptable if the intraclass correlation coefficient was at least 0.7.
Statistical analysis
Descriptive summaries of data were presented as means with standard deviations or medians with interquartile ranges when appropriate. Significance of differences between the two methods was examined by paired Student’s t-tests. Pearson’s correlation coefficient (r) was used to assess the correlation between manual and semi-automated measurements. A 2-tailed p value less than 0.05 was considered statistically significant. Agreement between semi-automated and manual measurements was assessed by absolute and relative sample mean differences. Positive values for these differences reflect a larger value from the semi-automated method compared to the manual measure, and negative values reflect the opposite. Linear regression scatter plots were also used to visualise the correlation and agreement levels.
Results
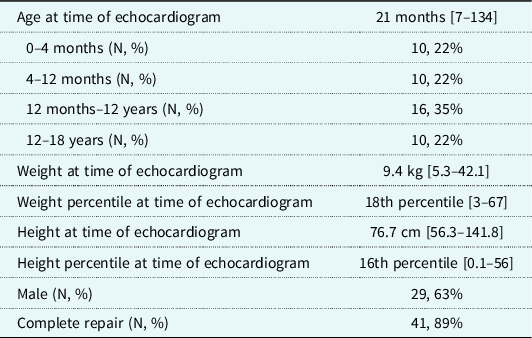
Eighty-three echocardiograms contained manual tricuspid annular plane systolic excursion measurements (which needed to be performed at the time of image acquisition). Of these, 37 were excluded due to poor image quality of the right ventricle. The remaining 46 echocardiograms included in the study were from unique patients, 17 of whom were female. The age ranged from 0 months to 17 years and 2 months with at least 10 subjects in each age group. Demographics of the study population are demonstrated in Table 1.
Demographics of the study population. Median [Interquartile Range] shown for each measure, except when indicated otherwise

Reliability testing
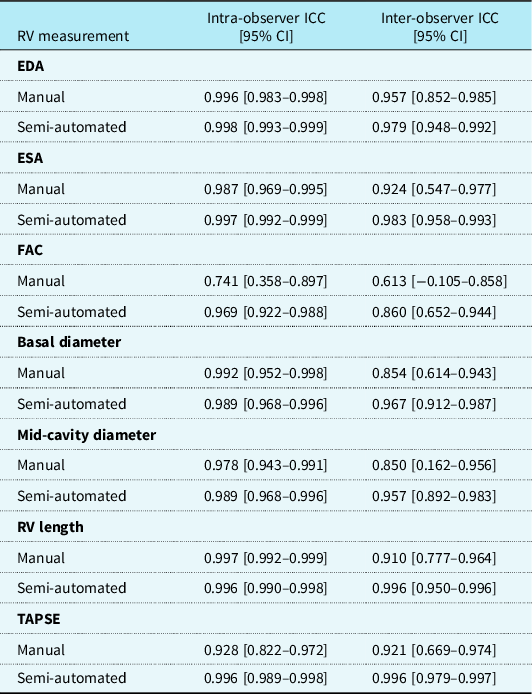
For the manual measurement, intra-observer reliability (Table 2) was high, with intraclass correlation coefficients above 0.8 except for fractional area change (ICC 0.74). For semi-automated measurements, intra-observer reliability was similarly high with all intraclass correlation coefficients estimates above 0.9. For fractional area change and tricuspid annular plane systolic excursion, intra-rater reliability was significantly better, with non-overlapping confidence intervals, for semi-automated measurements than for manual measurements. Inter-rater reliability for manual measurements and semi-automated measurements were above 0.7 except for the manual measurement of fractional area change (intraclass correlation coefficient 0.61). Tricuspid annular plane systolic excursion was the only measure whose inter-rater reliability reached statistical significance for semi-automated measures being superior to manual measures with non-overlapping confidence intervals.
Intra- and inter-observer reliability for manual and semi-automated measurements

* EDA = end-diastolic area; ESA = end-systolic area; FAC = fractional area change; RV = right ventricular; TAPSE = tricuspid annular plane systolic excursion.
Manual versus semi-automated measurements
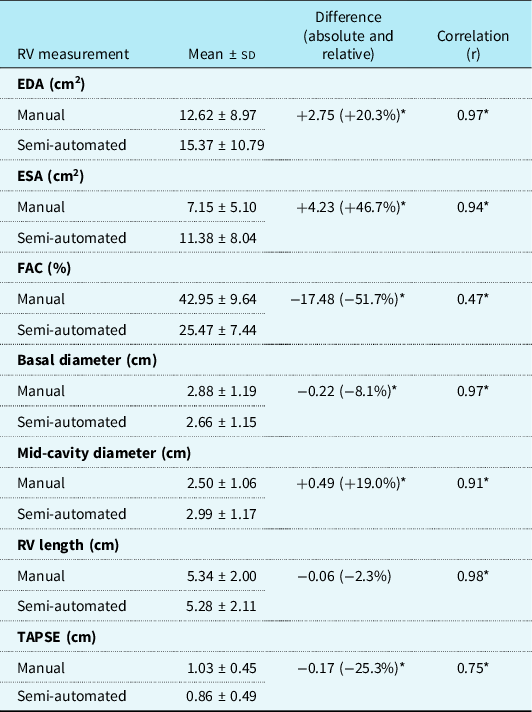
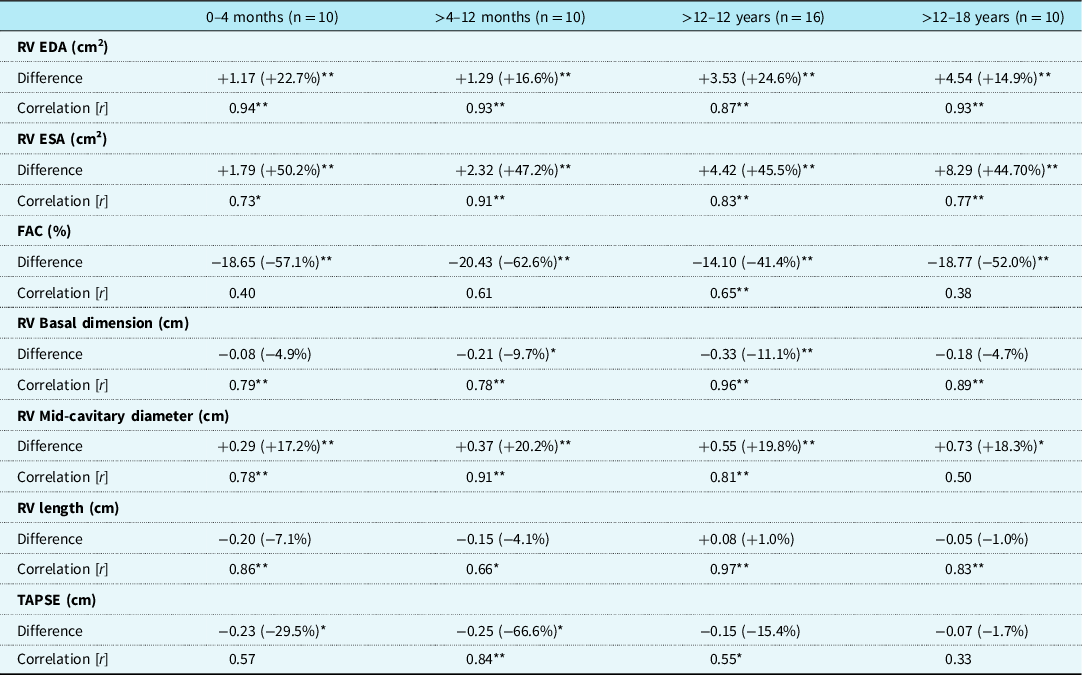
For the whole study population, there was high correlation between manual and semi-automated measures (r ranging from 0.91 to 0.98) except tricuspid annular plane systolic excursion (r = 0.75) and fractional area change (r = 0.47), where correlation was lower but still significant (Table 3). Even though there was correlation, there were significant differences between manual and semi-automated measurements. Smaller differences were found among linear measurements, and the highest levels of agreement were seen for right ventricular length (no significant difference). All the other measures had relative differences ranging from 8 to 52% (all significant). The greatest differences were seen in right ventricular end-systolic area (semiautomated 47% greater than manual), and, accordingly, fractional area change (semiautomated 52% less than manual). Correlation between methods for each measure varied somewhat across age groups, but without a consistent pattern (Table 4).
Mean levels, differences, and correlation of the manual and semi-automated measurements. *denotes p < 0.01

* EDA = end-diastolic area; ESA = end-systolic area; FAC = fractional area change; RV = right ventricular; TAPSE = tricuspid annular plane systolic excursion.
Manual and semi-automated differences (absolute and relative) and correlation by age group. *denotes p < 0.05 and **denotes p < 0.01

* EDA = end-diastolic area; ESA = end-systolic area; FAC = fractional area change; RV = right ventricular; TAPSE = tricuspid annular plane systolic excursion.
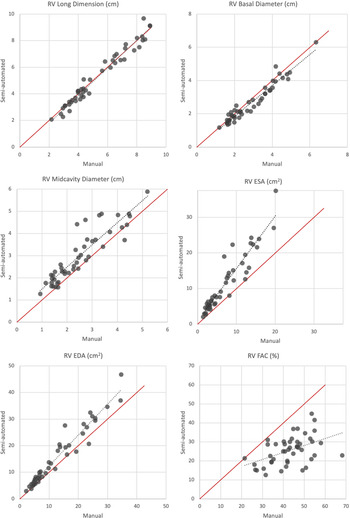
Linear regressions between manual and semi-automated measurements show that as end-diastolic area and end-systolic area become larger, the semi-automated technique estimates progressively higher values for each as compared to the manual technique (Fig 2). As fractional area change becomes larger, the semi-automated technique tends to estimate progressively lower fractional area change. The best agreement between manual and semi-automated methods was for linear measurements, and the agreement did not vary much as the right ventricular size increased.
Correction between manual and semi–automated measurements of RV length, basal and mid–cavitary diameters, ESA, EDA and FAC. The dotted line represents a best fit of the data points, and the red reference line represents a perfect match of the measurements. RV= right ventricle; ESA = end-systolic area; EDA = end-diastolic area; FAC = fractical area change.

Discussion
We compared manual measurements of right ventricular dimensions and function with semi-automated measures obtained using EchoInsight® in children with tetralogy of Fallot. The software proved to be easy to use and able to efficiently obtain all quantitative measures. A single tracing of the endocardial border used in EchoInsight® allowed for all quantitative measurements to be performed with the use of speckle tracking. Semi-automated measures had better intra- and inter-rater reliability for fractional area change and tricuspid annular plane systolic excursion and trends toward better inter-rater consistency for the other right ventricular measures, demonstrating that the semi-automated software can consistently obtain measures with less user-to-user variation. This is important given that multiple different echocardiographers and sonographers are often involved in assessing patients with tetralogy of Fallot, and standardisation of echocardiographic assessments could lead to more uniformity of management. In addition, because these patients are serially assessed, sometimes by different teams, standardisation across encounters over time is important to minimise changes in management that stem solely from inter-observer variations in image interpretation.
The data show that the best agreement between manual and semi-automated methods was for linear measurements. Semi-automated measurements of end-systolic area consistently read larger than manual measurements, and the larger the end-systolic area, the bigger the difference. End-diastolic area measurements had a smaller difference between manual and semiautomated, but the difference was still magnified at larger areas. Fractional area change showed less agreement between semi-automated and manual measurements, attributable to compounding of the variabilities in end-systolic area and end-diastolic area. This is similar to previous studies in other populations that have shown significant variability in fractional area change measures. Reference Medvedofsky, Addetia and Hamilton17,Reference McCloud, Lowisz and Roberson18
Manual and semi-automated measurements of tricuspid annular plane systolic excursion correlated but with a lower tricuspid annular plane systolic excursion estimated by the semi-automated technique. The difference may be explained by the different methods used to obtain manual versus automated tricuspid annular plane systolic excursion measurements. Manual tricuspid annular plane systolic excursion measurements were obtained by using a lateral tricuspid annulus M-Mode acquisition whereas automated measurements were obtained using a two-dimensional cine clip. The measurements were also frequently obtained at different points in the study, from a different angle, and different 4-chamber clips, leading to possible variation in the angle of insonation and predisposing to differences in measurements. While it is possible that the semi-automated image analysis could be limited by the ability of the software to trace the myocardial borders accurately, overall the semi-automated technique showed better intra- and inter-observer reliability for tricuspid annular plane systolic excursion.
Overall, while the two measurement methods did correlate with each other, they did not match each other on several measures. Although the advantages of the semi-automated method include high reproducibility, we cannot conclude that the semi-automated method is interchangeable with the manual method. This contrasts to what has been found in patients with normal cardiac anatomy and in patients with hypoplastic left heart, where semi-automated and manual measurements had better agreement with one another. Reference McCloud, Lowisz and Roberson18,Reference Penk, Mukadam and Zaidi19 Perhaps, the better agreement found in those populations was due to a less hypertrophied right ventricle (normal cardiac anatomy group), and because manual adjustments of the semi-automated tracking were performed (hypoplastic left heart syndrome group). Thus, specific aspects of the right ventricular geometry and function in tetralogy of Fallot may explain the greater differences observed between the two techniques. Therefore, if the semi-automated method is to be used for a patient with tetralogy of Fallot, the method should be done consistently across the patient’s studies to understand right ventricular remodeling, as comparisons between semi-automated and manual methods collected at different timepoints will be difficult to interpret.
The time for automated analysis has previously been reported as 30 seconds whereas manual measurements took 4 minutes. Reference Medvedofsky, Addetia and Hamilton17 Though we did not directly measure the time needed for measurements, in our collective experience, semi-automated methods are faster. The reduction in measurement time could make routine measurements of the right ventricular more likely to occur if semi-automated methods are accessible to busy clinicians.
Important limitations of this study include that patients were excluded from the study if there was incomplete or poor image acquisition, and this led to a small sample size. Manual adjustments to endocardial border tracking with the Epsilon software was purposely not performed; however, this may have contributed to decreased agreement between measurement methods. To limit the variability among measurements, only a single heartbeat was used to obtain all quantitative measurements; in future analysis, multiple heart beats may be employed to better utilise the speckle tracking in an effort to optimise the technology’s ability to track the myocardium and produce more accurate results. Finally, the clips and timing of measurements for tricuspid annular plane systolic excursion were different in manual and automated measures, potentially leading to a larger discrepancy between these measurements.
Several different semi-automated software types exist; therefore, our results are limited to the Epsilon software and cannot be broadly generalized. Finally, our study did not compare semi-automated measurements to cardiac MRI because the vast majority of the study population were not of the age where a cardiac MRI would have been clinically warranted. Nevertheless, our results provide the basis and justification for the funding of larger, prospective, studies to compare semi-automated measurements of the right ventricle to cardiac MRI measurements in patients with unrepaired or palliated tetralogy of Fallot.
Conclusion
Semi-automated echocardiographic measurements generate right ventricular dimension and function information with equal or better intra- and inter-rater reliability compared to manual methods, but area and function measurements yielded relative differences ranging from approximately 20 to 50% between the two methods. Future studies should include adding user input to the semi-automated tracings, understanding how semi-automated versus manual measurements change over serial studies for the same patient, as well as improving beam optimisation and speckle tracking. In addition, future studies to compare semi-automated right ventricular measurements with cardiac MRI right ventricular measurements may decrease the need for frequent cardiac MRIs in this patient population.
Funding
This research did not receive any specific grant from funding agencies in the public, commercial, or not-for-profit sectors.
Conflicts of interest/Competing interests
The authors declare they have no conflicts of interests or disclosures.
Ethics approval
The Advocate Aurora Institutional Review Board approved this study. The study was performed in accordance with the ethical standards as laid down in the 1964 Declaration of Helsinki and its later amendments.
Consent to participate
Informed consent was obtained from all research subjects’ legal guardians.
Consent for publication
None.
Availability of data and material
All data is available on request.
Code availability
None.
Authors’ contributions
All authors contributed to the work per submission guidelines.