


I. INTRODUCTION
AlGaN/GaN HEMT are a promising technology, especially for T/R modules including several elements as power amplifiers, LNA, or power switches. For both these elements, distinct models already exist, such as [Reference Teyssier, Viaud and Quéré1–Reference Islam and Anwar4] for power amplifiers applications, or [Reference Nemati, Ferndhal, Angelov, Fager and Zirath5] in-switch mode amplifiers applications. The new trend to improve the performances, the cost, and the size of these modules is to design all these functions in the same technology and on the same chips. Thus, the same transistor topologies can be used in different functions. Designing each of these functions implies having models with different degrees of accuracies, and it is very challenging to obtain a valid description of the nonlinear elements for several applications with the same model, and improve the definition of drain current source for both positive and negative drain voltage. However, in order to reduce the modeling process duration, it is very interesting to reuse, as far as possible, some parts of a model to design a new one for another application. The I–V model we will describe here was designed in this context.
There are different needs concerning the I–V model:
– For the design of power amplifiers, the model has to be capable of predicting very accurately the I–V curves at positive drain–source voltages, the partial derivatives g m and g d, the knee voltage, and the decrease of the transconductance at high current (to fit the power saturation and the maximum of Power Added Efficiency (PAE)).
– For the design of power switches, the model has to be capable of predicting the I–V curves at both positive and negative drain–source voltages, and particularly the partial derivatives for the “ON” command voltage, for which the transistor works in the linear region most of the time. Special care has to be taken with regard to the continuity of the current and its derivatives in the proximity of V ds = 0 V. Most of the time, the designers use splined I–V models for these kinds of designs, but their possible number of derivations is limited to the degree of the interpolation polynomial, and their high sensitivity to measurement imprecisions in the vicinity of V ds = 0 V can induce some important errors on the partial derivatives. Moreover, it is important that the model reproduces the breakdown, as it sets the power injection limits of the switches.
– For multitone application, predicting the third-order intermodulation requires to accurately model the third- and higher-order derivatives of I ds with respect to V gs [Reference Maas and Neilson6].
We will present here the equations of a new model. The model in this case is extracted from pulsed I–V measurements at room temperature in order to reduce the thermal effects; due to its cold quiescent bias and low dissipated power, we can disregard the self-heating effects with good approximation [Reference Teyssier, Bouysse, Ouarch, Peyretaillade and Quere7, Reference Baylis, Dunleavy and Connick8]. The measured devices can also reveal sensitive to trapping effects. Thermal and/or trapping subcircuits can then be added in the same manner as in [Reference Jardel9].
II. EQUATIONS OF THE MODEL
A) Equations of the main current source
The main current source is described by the following equations:

with
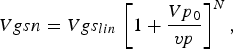



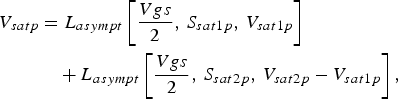

with


Four functions are used in these equations. The function dhyp allows reconstructing the current envelope and is quite similar to a tanh function:

The cval function allows changing the value of a parameter, x from x neg to x pos, when its third parameter reaches the value 0, with a softness determined by the parameter αtrval,

In order to obtain smooth transitions from one domain to another, three functions named genp(x), H asympt(x), and L asympt(x) were used. These functions are C ∞ and allow us to separate the definition domain in upper and lower regions in a smooth way. “a” is the smoothing parameter that acts as illustrated in Fig. 1. The behavior of these three functions is also shown in Fig. 1:


Behavior of functions genp(x) in the solid line, H asympt(x, 1, 5) in gray dots and L asympt(x, 1, 5) in black dots; inset function L asympt(x, 1, 5) for various values of x = 0.1 in the black plot, x = 0.5 in the gray plot, and x = 1 in the black solid line.

B) Equations of the gate–drain and gate–source diodes
The classical diode equation used for modeling the gate source current Igs (reference equation 15) is no suitable here for describing the gate current Igd. Hence, a different formulation is proposed in equation 16:
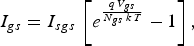

Moreover, a resistance R leak can be added parallel to the gate–drain diode in order to take into account the gate leakage current sometimes measured.
C) Equations of the nonlinear capacitances for power amplifiers and switch applications
For the sake of accuracy of the model, we chose to create a one-dimensional (1D) nonlinear model capacitance and took particular care in conserving as much as possible the equations for the two modes of applications:
– For power amplifier applications, gate source capacitance (C gs) and gate drain capacitance (C gd) had already been defined by nonlinear 1D equations in [Reference Jardel9], and are presented in (17).
(17)
where “x” stands for “d” or “s.”
– For switch applications, C gs and C gd are defined on a larger range of terminal voltages. Values of V gs are far below V p in the OFF-mode (typically −20 V), and are set to 0 or +1 V in the ON-mode, and V gd takes positives values. We keep the equations defined in (17) and will validate the results later. In power amplifier applications, drain source capacitance (C ds) is considered constant [Reference Jardel9]. However, this approximation can no longer be made in the enlarged domain of definition corresponding to the switch applications. That is why we define it with a 1D equation that makes C ds drop to a lower value (0 pF) for small or negative V ds, parameterized in the DC bias V gs (18).
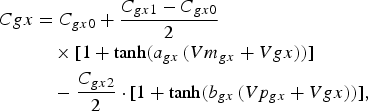
We extract drain-source capacitance (C gs), gate–drain capacitance (C gd) and drain-source capacitance (C ds) from multibias [S]-parameters measurements; the values and model of capacitances are plotted in Fig. 2 and the value of each parameter is presented in Table 1. In the choice of capacitance values, we took particular care in accurate fit in the two mains areas defined by ON- and OFF-mode regimes:

(a) Gate–drain capacitance versus gate–drain voltage, plots: extracted values of C gd, solid line: model values; (b) gate–source capacitance versus gate source voltage, plots: extracted values of C gs, solid line: model values; (c) drain–source capacitance versus drain–source voltage, diamonds: extracted values of C gd for V gs = −18 V to V gs = −2 V, thick line and triangles: model values.

Values of the parameters of equations of C gs, C ds, I gd for the 8 × 75 μm GaN HEMT.

We notice that for power amplifiers application, we can keep a fixed value of the drain source capacitance.
III. VERIFICATION OF THE PROPOSED MODEL FOR SWITCH APPLICATIONS
In order to validate the model, several measurements have been done on FET transistors. The first validation is done by comparing PIV measurements (with 400ns pulse width) of 8 × 75 × 0.25 mm GaN HEMT processed at Alcatel-Thales 3-5lab and its modeled IV characteristic. (cf. fig. 3). The quiescent bias-point chosen here is V gs0 = 0 V and V ds0 = 0 V; then the traps states are set by the instantaneous voltage levels (the I–V curves obtained with this measurement configuration are hence the ones to be modeled if trapping subcircuit are added). Fig. 4 shows a good correlation obtained by using the proposed formulation. The values of the parameters are given in Tables 2 and 3.
Comparison between the measured/modeled pulsed I gs(V ds) of a 8 × 75 μm GaN HEMT, V gs is stepped from −1 to +1.5 V (squares: measurements, black solid lines: model, black dashed lines: best fit with classical equations).

Comparison between the measured/modeled pulsed I gs(V ds) of a 8 × 75 μm GaN HEMT, V gs is stepped from −1 to +1.5 V (squares: measurements, black solid lines: model, black dashed lines: best fit with classical equations).

Physical simulation realized; thanks to Atlas Silvaco show the current saturation for highly negative values of V ds, which is hard to measure without degrading the device.

Values of the parameters of equations of the diodes for the 8 × 75 μm GaN HEMT.

Values of the parameters of equations of the diodes for the 8 × 75 μm GaN HEMT.

The partial derivatives of the current are also shown (here defined as g m = ∂I ds/∂V gs and g d = ∂I ds/∂V ds whatever the sign of V ds): Fig. 6 shows the output conductance for V qs = −10, −7, −1 and 1 V, and Fig. 7 the transconductance, its first- and second-order derivatives, for different values of V ds (−1, 1, and 10 V). We took particular care in accurately modeling the transconductance close to the pinch-off, which is important to fit the low-level gain in class B amplifiers for example.
Fit of the pulsed g d versus V ds measured curves of a 8 × 75 μm GaN HEMT, V gs = −10, −7, −3, 0 and +1 V (symbols: measurements, solid lines: model).

Fit of the pulsed g m versus V gs measured curves of a 8 × 75 μm GaN HEMT, for different V ds: −1, 1 and 10 V (symbols: measurements, solid lines: model).

IV. BREAKDOWN MODEL
The breakdown is modeled for both positive and negative values of V ds. However, measuring it on GaN HEMTs is a quite difficult task, as it often leads to its destruction. We used here the drain current injection method proposed in [Reference Bahl and Alamo10] to determine the breakdown voltages in this case, and approximately obtained BV ds = −65 and +95 V. The derived breakdown model is simple, but useful to know the maximum power the transistor can sustain in the OFF regime, for which power injection leads to a large voltage swing.
For the positive breakdown, a current source I avdg is plugged between the gate and the drain, with a current value having an exponential form

For the negative breakdown, a current source I avgs is plugged between the gate and the source:

The parameters of these models are given in the Table 4.
Values of the parameters of the equations of the positive and negative breakdown for the 8 × 75 μ m GaN HEMT.

The impact of the breakdown models on the I ds(V ds) curves is presented deeper in detail in [Reference Jardel11]. We note that for negative values of V ds, the current saturates before the breakdown (this saturation is set by the parameters S satn and V satn. This saturation is difficult to measure as it leads, in most of the cases, to the destruction of devices, but physical simulations performed with Atlas Silvaco highlight this phenomenon well in Fig. 5 (the modeled device had a slightly different epitaxy and technology as the measured one).
V. VALIDATION ON [S]-PARAMETERS
The accuracy of the model in the RF frequency range was checked through [S]-parameters measurements in the various working regimes of the transistor. Its small signal model was derived from the previous nonlinear I–V model, and extrinsic RF parameters were extracted and then kept constant over the whole set of bias points. Comparisons between modeled and measured [S]-parameters are provided in Fig. 8(a) and 8(b). These points correspond to the nonlinear working limits of the transistor in the OFF and ON regimes. It has to be noted that the model is able to accurately represent the [S]-parameters variations versus the bias values and then will be very useful for the design of RF switch applications.
Comparison between measured (symbols) and modeled (lines) of [S]-parameters for a 8 × 75 μm GaN HEMT, at different biases points: (a) For negative V ds bias A: V gs = −18 V, V ds = −14 V; bias B: V gs = 0 V, V ds = −2 V. (b) For positive V ds biases C: V gs = −18 V, V ds = 16 V; bias D: V gs = 0 V, V ds = 3 V.

VI. VALIDATION ON LARGE SIGNAL RF DRIVE AND TIME DOMAIN WAVEFORMS MEASUREMENTS
A) Bench presentation
To validate the model in switch applications we used a large signal time domain bench, including a large signal network analyzer (LSNA) as described in Fig. 9. The bench allows a reconstruction of temporal waveforms; thanks to the acquisition of harmonics and their phase relation, which is made possible due to measurement coupling probes located as close as possible to the measurement terminal [Reference De Groote, Verspecht, Tsironis, Barataud and Teyssier12].
Scheme of time domain load-pull bench in measurement condition with drain access excitation.

The LSNA subsampling process of CW large signals acts in the same way as that of a stroboscope. It allows us, in a one-shot measurement, to acquire both the fundamental and harmonic frequencies data for all the incident and reflected waves [Reference Faraj, Callet, De Groote, Verspecht, Quere and Teyssier13]; thanks to the rigorous calibration algorithms, the time domain current, and voltages slopes versus time or the load cycles can be drawn at the reference planes.
B) Setup and measurement results
The load line cycle form, for the switch, depends on the ON- or OFF-state of the device. To see the time domain waveforms of this phenomenon, the experiment consists in injecting the RF power by the Drain access of the device with a quiescent bias of 0 V for all the measurements. Several measurements were performed for gate voltages ranging from V gs = −15 V to 0 V and the results obtained for two cases, respectively, ON-switch state and OFF-switch state, are presented here. The fundamental RF frequency is set at 4 GHz. Although the configuration of the bench allows to set-up the impedances at the harmonics 2 and 3, we chose to focus mainly on the fundamental and then applied a complex load; thanks to the tuner on the gate access whose value is Z gate = 50 − j70. It must be noted that the terminal impedance at the gate terminal plays an important role in the behavior of the switch. Due to the mounting of the transistors in common source, only parallel configuration of the switch was investigated in this experiment. However, the developed model can be used in a three-terminal configuration. The load line cycle in the ON-state switch (V gs = 0 V) is plotted in Fig. 10 in linear working regime, this measurement is plotted with results given by the simulation at the same input power level than measured in the DUT plane (P avs = 34.2 dBm), showing good accuracy of the model.
Extrinsic load line for V gs = 0 V for an available power 34.2 dBm, measurement crosses, simulation curves.

The load line cycle in the OFF-state of the switch (V gs = −13 V) was measured for two regimes: one linear corresponding to an available power P avs = 23.8 dBm on drain access, and the other in a nonlinear regime corresponding to P avs = 34.9 dBm. The measured load cycles were compared to the simulated ones. The comparison was performed in the reference plane corresponding to the extrinsic access of the switch. The comparison is shown in Fig. 11 and time domain waveforms of current and voltage are given in Fig. 12.
Extrinsic load lines for V gs = −13 V for an available power P avs = 23.8 dBm and an available power P avs = 34.9 dBm, measurements are plotted in crosses, simulations appear in solid line.

Drain source voltage and current waveforms for V gs = −13 V for an available power 34.9 dBm, measurements are plotted in crosses, simulations appear in solid lines.

The good behavior of the model for nonlinear power applications was demonstrated here. We notice that in the nonlinear OFF regime the load line does not follow the I–V characteristic, i.e. no negative current appears. This is due to a nonlinear shift of the quiescent drain voltage which is very sensitive to the impedance at the gate terminal. Having assessed the nonlinear model in the ON and OFF states, an evaluation of the insertion losses and isolation due to the device versus the injected RF power can be foreseen. Thus, the simulations were performed at 4 GHz with the transistor mounted as shown in Fig. 13. Here the switch is in a shunt configuration and the transistor is switched ON for measuring the isolation while it is switched OFF to estimate the insertion losses. This configuration is often encountered in applications such as single pole double throw (SPDT) structure in transmission/reception modules. These simulation results are plotted in Fig. 14 and they are compared to measurement results obtained for two DC gate-source voltages, V gs = −15 and 0 V.
Simulation of the performances of the parallel switch in the ON and OFF regimes. Insertion loss is defined as P out−P in when the transistor is switched OFF while the isolation is defined as P out−P in when the transistor is switched ON.

Comparisons of isolation (transistor ON) between simulation in red and measurements in circles for V gs = 0 V, and insertion losses (transistor OFF) between the simulation blue solid line and measurements in crosses for V gs = −15 V in blue versus the available power.

VII. CONCLUSIONS
The model proposed allows reproducing the I–V characteristics of FETs for positive and negative values of the drain voltage, and then, by adding the breakdown effects, allow reproducing the whole I–V characteristics. The formulation for the main part is based on smoothed asymptotic functions. It needs a reduced number of parameters, it is well suited for convergence, and has continuous high-order derivatives. This formulation can be used for modeling transistors aimed at different applications, reducing then the modeling process duration when the same topology of transistor is used in these applications.
A nonlinear model for switch applications was developed, using the I–V formulation, and adding nonlinear capacitances extracted from multibias [S]-parameters. We showed a good correlation between measured and modeled [S]-parameters over several bias points, corresponding approximately to the limits of the RF swings in its both working regimes. We also complete the study with time domain load-pull measurements which allowed us to conclude with a good agreement and a good CAD behavior on both linear and nonlinear functioning. This shows the interest of the I–V model, and subcircuit modeling, for designing such RF functions.
ACKNOWLEDGEMENT
This work was partially done in the framework of the KORRIGAN project funded by the European Defence Agency.
 Guillaume Callet was born in Arles, France 1983. He obtained an engineering degree from ENSEA (Ecole Nationale Suprieure d' Electronique et de ses Applications) in 2008 and is currently working toward a Ph.D. degree from Limoges University, in the common laboratory between Xlim and Alcatel-Thales III–V Lab, MITIC. He works on the development of AlInN/GaN technology, particularly on the modeling of power devices.
 Jad Faraj was born in Lebanon in 1983. He received a Master Research degree in 2007 from the University of Limoges, France. He is presently a Ph.D. student at the (Xlim) laboratory, with the Non Linear Electronic Circuits and Sub-Systems team, University of Limoges. His research topic is pulsed time domain load-pull characterization of microwave power transistors and the developing of RF instrumentations for large signal measurements.
 Olivier Jardel was born in Poitiers, France, in November 1981. He received an engineering degree from Aix-Marseille I University, in 2004, and the Ph.D. degree from Limoges University in April 2008, in the common laboratory MITIC between XLIM and Alcatel-Thales 3–5 lab. He is currently a research Engineer at Alcatel-Thales 3–5 lab, and is working on the development of the new AlInN/GaN HEMT technology, on transistor modeling, and on the design of high-power amplifiers.
 Christophe Charbonniaud was born in Limoges, France, in 1972. He received a Master Research degree from Universit de Limoges, France, in 2001, and Ph.D. degree from the Research Institute on Microwave and Optical Communications XLIM, Université de Limoges, in 2005. He is a co-founder of AMCAD Engineering, France, where he serves as the modeling team manager of amplifiers.
 Jean-Claude Jacquet received the Engineer degree from the Ecole Supérieure d'Optique, Orsay, France, in 1990. He subsequently joined the Central Research Laboratory of Thales, as a Research Staff Member, where he was involved with spintronic devices. He focused his efforts on the giant magnetoresistive effect and found a new physical effect called the magnetorefractive effect. Since 1999, he has been involved with GaInP HBT and GaN HEMT microwave power devices. He is currently in charge of thermal management and of the physical modeling aspects on GaN HEMT with the Alcatel/Thales III–V Laboratory.
 Tibault Reveyrand was born in Paris, France. He received a Ph.D. degree from Université de Limoges, Limoges, France, in 2002. From 2002 to 2004, he was Post-Doctoral Scientist with the Centre National d'Etudes Spatiales (CNES) (French Space Agency). In 2005, he became a Contractual Engineer with the Centre National de la Recherche Scientifique (CNRS), XLIM, Limoges, France. His main research interests include the characterization and modeling of RF and microwave nonlinear components.
 Erwan Morvan graduated in material physics and semiconductor devices at National Institute for Applied Science (INSA) in Lyon (France). He was a Ph.D. student at National Center for Microelectronics in Barcelona (CNM) from 1995 to 1999. He worked in the field of device and technology simulation. He developed an ion implantation simulator for Silicon Carbide (SiC) crystal. He obtained the Ph.D. degree in electronics from INSA Lyon in 1999. In 2000, he joined the Corporate Laboratory of Thomson CSF (LCR), now called Thales Research and Technology (TRT). He was involved in SiC MESFET design, technology and characterization as a research engineer from 2000 to 2003. He is now involved in AlGaN/GaN and InAlN/GaN device technology research and development.
 Stéphane Piotrowicz was born in France 1971. He received a Ph.D. degree in Electronics from the University of Lille in 1999. He Joined the Thales Research Center and worked on the design of Hybrid and MMIC power amplifiers on the InGaP/GaAs HBT technology for Radar and Space Applications. He currently works on the development of AlGaN/GaN technology at Alcatel-Thales III–V Lab. He is in-charge of hybrid and MMIC demonstrators for T/R modules as power switches, power amplifiers and low noise amplifiers.
 Jean-Pierre Teyssier was born in 1963 in Brive, France. Since 1990, he works at the IRCOM/XLIM lab of the University of Limoges, France, in the group of Pr Raymond Quéré. He has presented his Ph.D. Thesis in 1994, the subject was about pulsed I(V) and pulsed S-Parameters for the nonlinear characterization of microwave active devices. Till now, he is involved in the design of measurement systems and instrumentation for microwave nonlinear investigations, with an emphasis on time domain pulsed large signal characterization of transistors. Since many years, Jean-Pierre Teyssier and his students are frequent contributors of ARFTG papers, he is now a member of ARFTG ExCom, responsible for workshop organization.
 R. Quéré (Fellow IEEE) received the electrical engineering degree from ENSEEIHT Toulouse, France in 1976 and the French agrégation in applied physics in 1978. After a teaching period of 8 years for undergraduate students, he prepared and earned a Ph.D. degree (with honors) from University of Limoges in 1989. In 1992, he was appointed as full professor at the University of Limoges. Since 1998, he leads the nonlinear high-frequency devices, circuits and systems research department at XLIM-CNRS laboratory. This department gathers 70 permanent and non-permanent researchers and is involved in high-frequency devices circuits and systems design. His main field of interest is in the area of nonlinear device and circuit modeling with a particular emphasis on nonlinear phenomena such as stability in power amplifiers. He advises more than 30 Ph.D. students and he authors or co-authors more than 100 journal articles or communications in international conferences such as IMS/MTT, EuMW. He was the co-author of the book “Nonlinear Stability of Nonlinear Microwave Circuits”. Moreover, he is involved in a number of technical program committees and serves as a reviewer for several journals such as Electronic Letters, IEEE transactions on MTT. In 2005, he was appointed as the general Chairman of the European Microwave Week in Paris.



