I. INTRODUCTION
Biodiesel is commonly obtained through the basic transesterification reaction of vegetable oils or animal fats.Reference Sharma, Singh and Korstad1 However, when waste cooking oils are used as a feedstock, the yield of fatty acid methyl esters (FAME) is affected due to the poisoning of basic sites by the free fatty acids (FFA) contained in this type of raw material.Reference Baskar and Aiswarya2,Reference Atadashi, Aroua, Abdul and Sulaiman3 In addition, the separation process of biodiesel and glycerol becomes complicated as the basic catalyst promotes the saponification of the FFA, generating foam during this stage.Reference Atadashi, Aroua, Abdul and Sulaiman3 An interesting option to circumvent this problem is to use a two-stage process, being the first step the acid esterification reaction which is commonly used to obtain more biodiesel, as a preliminary processing of second generation raw materials,Reference Baskar and Aiswarya2–Reference Sharma, Singh and Korstad4 followed by a transesterification step over basic catalysts. Traditionally esterification has been catalyzed by H2SO4 rendering high yields, but with a large consumption of water to neutralize the biodiesel production.Reference Sharma, Singh and Korstad4 Several acid-solid catalysts have been used to try to replace H2SO4 that could lead to a sustainable process.Reference Sharma, Singh and Korstad4–Reference Atadashi, Aroua, Abdul and Sulaiman6 Among the acid-heterogeneous catalysts, zeolites with different Si/Al molar ratios have been used to tune the acid properties; however, their microporous structure has limited the transport of reactants and products into their cavities.Reference Kirumakki, Nagaraju, Komandur and Chary7–Reference Prinsen, Luque and González-Arellano9 Heteropolyacids also possess a stronger Brönsted acidity, but are solubilized in the reaction medium even when they are supported, which hinders their reuse.Reference Caetano, Fonseca, Ramos, Vital and Castanheiro10–Reference Kuzminska, Kovalchuk, Backov and Gaigneaux12 Polymeric resins represent another kind of solid-acid catalysts with wide pore diameters and intercalated with –PrSO3H groups, which provide high surface acidity. However, the poor thermal stability decreases the application at industrial level.Reference Tesser, Casale, Verde, Di Serio and Santacesaria13–Reference Pappu, Kanyi, Santhanakrishnan, Lira and Miller15
An interesting material is the SBA-15 which contains wide mesopores, large surface area, and high thermal stability.Reference Zhao, Sun, Li and Stucky16 However, due to the weak surface acidity, the addition of transition metals or sulfonic groups by grafting or following the sol–gel route is attractive to enhance this property.Reference Gutiérrez, Fuentes, Salcedo and Klimova17–Reference Basaldella, Legnoverde, Jiménez-Morales, Rodríguez-Castellón, Dalla Costa and Querini20 The latter is reported to be the most suitable since this allows a greater amount of precursor to be incorporated in the SBA-15 material and also avoids additional processing steps which result in a decrease in the final cost of the catalyst production.Reference Chen, Yokoi, Tang, Jang, Tatsumi, Chan and Cheng19,Reference Mbaraka, Radu, Lin and Shanks21
Previous research studies reported in the literature have concluded that the incorporation of transition metals such as Al+3 or Ti+4 increases the surface acidity of SBA-15, obtaining profitable materials to perform even simultaneous esterification and transesterification with high yields.Reference Liang, Wei, Tseng and Shu22–Reference Léon, Song, Su, An, Liu, Gao, Guo and Leng25 The literature also indicates that the addition of sulfonic groups and other organic groups to the SBA-15 increases the catalytic activity due to the enhancement of the acid surface properties and hydrophobicity.Reference Mbaraka and Shanks26–Reference Melero, Bautista, Morales, Iglesias and Sánchez-Vázquez28 Some of these studies have focused on the precursor loading and the optimization of the reaction conditions.Reference Shah, Parikh and Maheria27,Reference Melero, Bautista, Iglesias, Morales, Sánchez-Vázquez and Suárez-Marcos29 Incorporation of Al+3 into the SBA-15 framework leads to the formation of Brönsted and Lewis acidity independently of the synthesis method,Reference Liang, Wei, Tseng and Shu22,Reference Cabrera-Munguia, González, Gutiérrez-Alejandre, Rico, Huirache-Acuña, Maya-Yescas and del Río23,Reference Li, Xu, Xu, Hu, Ma and Guo30 whereas the addition of Ti+4 into the SBA-15 by the co-condensation method preferentially forms Lewis acid sites.Reference Chen, Mochizuki, Abe, Toba and Yoshimura24,Reference Léon, Song, Su, An, Liu, Gao, Guo and Leng25 In the case of sulfonic groups to the SBA-15, apparently only Brönsted acidity resulted when –PrSO3H was added.Reference Chen, Yokoi, Tang, Jang, Tatsumi, Chan and Cheng19,Reference Mbaraka, Radu, Lin and Shanks21 The aim of the present research work was to further study the acidity resulted after the incorporation of Al+3, Ti+4, and sulfonic groups into the SBA-15 and its influence on the final catalytic activity for the esterification of fatty acids. Kinetic and thermodynamic analyses were also performed and are herein included. It is also worth commenting that the present study is a continuation of a work previously published.Reference Cabrera-Munguia, Tututí-Ríos, Gutiérrez-Alejandre, Rico and González31
II. EXPERIMENTAL
A. Catalyst preparation
The sol–gel route was selected to synthesize the M-SBA-15 and M-SBA-15-SO3H materials since it increases the concentration of sulfonic groups compared to graftingReference Mbaraka, Radu, Lin and Shanks21; with a reduction in the synthesis steps, energy, and the use of solvents.Reference Chen, Yokoi, Tang, Jang, Tatsumi, Chan and Cheng19 According to the literature, a maximum molar ratio of Si/M = 10 or Si/S = 10 avoids distortion of the SBA-15 framework.Reference Margolese, Melero and Christians32 M-SBA-15 and M-SBA-15-SO3H materials were then synthesized using initial molar ratios of 147/0.54/1/1/0.1/1.8/0.1 for H2O/HCl/NaCl/TEOS/MPTMS/H2O2/Al(iOPr)3 or TEOS/Ti(iOPr)3 as previously reported.Reference Li, Xu, Xu, Hu, Ma and Guo30
SBA-15 was prepared dissolving Pluronic 123 (P123) and NaCl in HCl solution (0.2 mol/L) at 40 °C. After 3 h, tetraethyl orthosilicate (TEOS) was slowly added into this mixture under stirring. In the case of SBA-15-SO3H, after 2 h of the TEOS addition, a mixture of mercaptopropyl trimethoxysilane-hydrogen peroxide (MPTMS-H2O2) was also incorporated. After 24 h of stirring at 40 °C, the white suspensions were aged at 100 °C during 24 h under static conditions in polypropylene bottles. The solution was filtered to obtain a white precipitate which was washed and then dried at 70 °C. To remove the P123 surfactant, the white solid was placed into a reflux device with boiling ethanol (1 g of material/50 mL of ethanol). To prepare the Al-SBA-15 material, TEOS was previously mixed with aluminum isopropoxide (Al(iOPr)3), and then added into the HCl–NaCl solution as mentioned above.Reference Cabrera-Munguia, Tututí-Ríos, Gutiérrez-Alejandre, Rico and González31 For the synthesis of the Al-SBA-15-SO3H catalyst, it was necessary to incorporate the MPTMS-H2O2 mixture after 2 h of the addition TEOS/Al(iOPr)3. The other steps were similar to those described above. For the synthesis of Ti-SBA-15, similar procedure as that for SBA-15 was followed with the addition of TiOCl2 (a molar ratio of HCl/Ti(iOPr)3 = 1.5) after 2 h, obtaining a yellowish solution.Reference Chen, Mochizuki, Abe, Toba and Yoshimura24 Ti-SBA-15-SO3H was also obtained with the addition of a MPTMS-H2O2 mixture after 2 h. The experimental conditions for the subsequent steps are already mentioned above. All catalysts were dried at 100 °C before being used in the esterification reaction.
B. Characterization
The equipment and the conditions for the acquisition of the XRD patterns, N2 adsorption–desorption isotherms, pyridine adsorption followed by FT-IR, and UV-Vis-DRS were already mentioned in a previous work.Reference Cabrera-Munguia, Tututí-Ríos, Gutiérrez-Alejandre, Rico and González31 Scanning electron microscopy (SEM) was performed using a JEOL (Tokyo, Japan) scanning electron microscope JSM-7600F in the high vacuum mode, at low voltage (5 kV). High resolution transmission electron microscopy (HRTEM) images were obtained using a Philips Tecnai TF20-FEG (Field emission Gun) microscope (FEI, Hillsboro, Oregon) with an electron acceleration voltage of 200 kV. For this purpose, the solids were dispersed in isopropyl alcohol, and the suspension was collected on carbon-coated grids. Thermogravimetric analysis (TGA) was carried out in a PerkinElmer Simultaneous Thermal Analyzer STA 6000 (Perkin Elmer, Waltham, Massachusetts). The experiments were performed using a dwell of 10 °C/min from 30 to 700 °C under a helium atmosphere (22 mL/min). The Si/Al and Si/Ti ratios were determined by inductively coupled plasma (ICP) emission spectroscopy using a 4100 MP-AES Agilent Technologies instrument (Agilent Technologies, Santa Clara, California). The Si/S molar ratio was measured in a PerkinElmer PE2400 elemental analyzer (Perkin Elmer, Waltham, Massachusetts). To evaluate the catalysts’ hydrophobicity, in situ DRIFT experiments were carried out using an FTIR Nicolet 6700 spectrophotometer (DTGS detector; Thermo Fisher Scientific, Madison, Wisconsin) with 4 cm−1 resolution and 300 scan per spectrum. The M-SBA-15-SO3H samples were placed into a vacuum chamber with KBr windows and outgassed at 110 °C during 3 h. After that, the samples were cooled down to ambient temperature and water vapor was introduced into the chamber to reach 1 torr of pressure. DRIFT spectra were collected before and after introducing water vapor.
C. Reaction study
Briefly, the reactor was charged with 0.5 g of catalyst, 10 g of oleic acid, and a MeOH/oil molar ratio of 15:1. The air in the reactor was purged with nitrogen during 5 min. The reactor was rapidly heated up to the experimental temperature and once at this condition, it was pressurized with nitrogen to 14 MPa and the reaction was performed during 5 h at a stirring speed of 600 rpm. Other reaction details can be found elsewhere.Reference Cabrera-Munguia, Tututí-Ríos, Gutiérrez-Alejandre, Rico and González31 To distinguish the catalytic properties of M-SBA-15 and M-SBA-15-SO3H materials, they were first evaluated at 140 °C for different reaction times since esterification is an endothermic reaction,Reference Alenezi, Leeke, Winterbottom, Santos and Khan33 and also at this temperature, oleic acid and methanol are miscible, thus, in the absence of mass transport limitations.Reference Hegel, Andreatta, Pereda, Bottini and Brignole34 The three most active materials were then chosen to analyze deactivation at 140 °C. A more detailed study was performed with one of these materials that showed the highest catalytic activity as well as a good resistance to deactivation. In addition, the equilibrium constants were calculated. The experimental conversion was determined by titration of the percentage of FFA with NaOH solution (0.1 N).Reference Shah, Parikh and Maheria27
III. RESULTS AND DISCUSSION
A. Characterization and catalytic performance
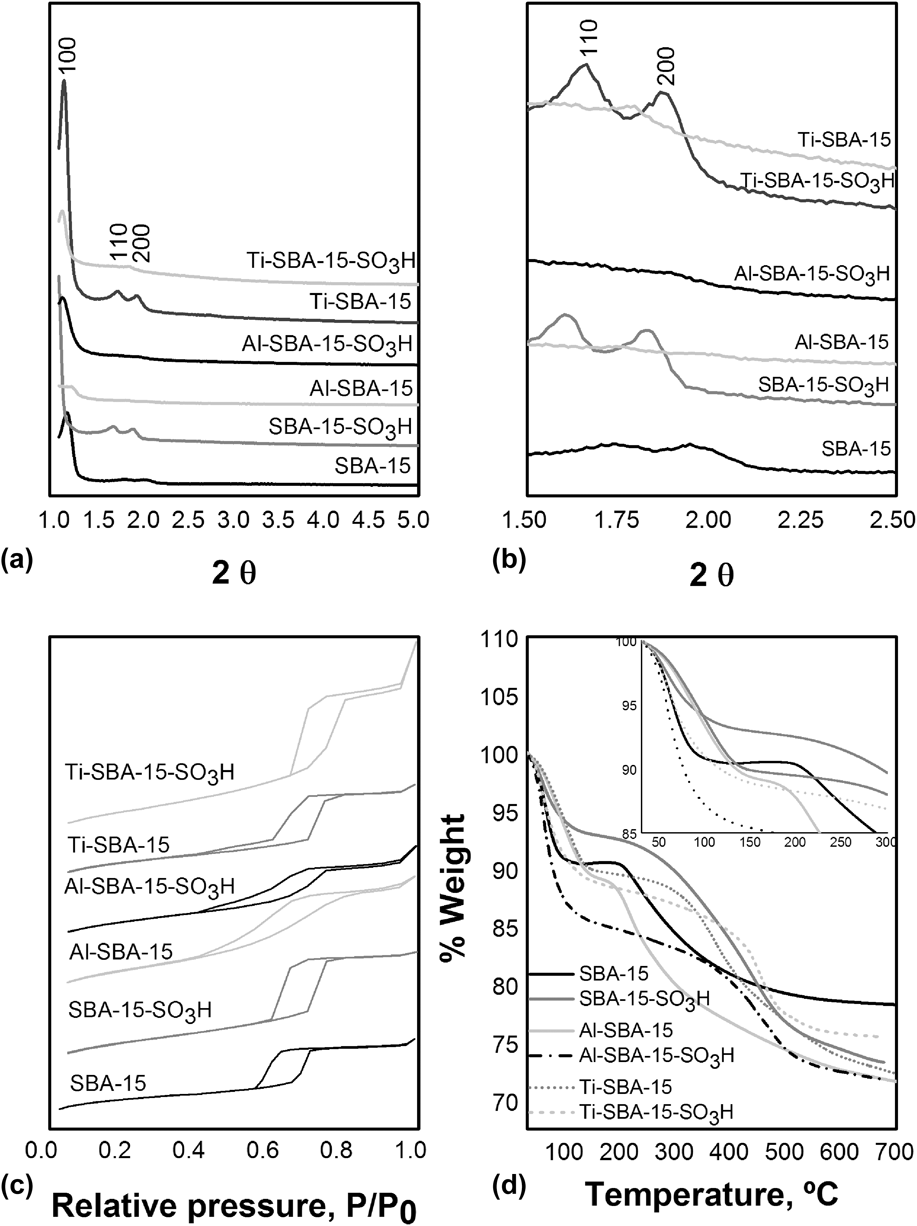
Small angle X-ray diffractograms (SAXRD) of catalysts are shown in Fig. 1(a). All samples present an intense peak at approximately 2θ = 1°, which correspond to the 100 orientation common to these materials (PDF 58-0344).Reference Jeenpadiphat, Björk, Odén and Tungasmita35,Reference Cattaneo, Chiara, Villa, Angioni, Milanese, Capsoni, Grandi, Mustarelli, Allodi, Mariotto, Brutti and Quartarone36 The value of the cell parameter a 0 was calculated for each sampleReference Muthu Kumaran, Garg, Soni, Kumar, Gupta, Sharma, Rama Rao and Dhar37,Reference Çitak, Erdem, Erdem and Öksüzoğlu38 Table I, shows an increase of a 0 for SBA-15 with the addition of the metal or sulfonic groups, due to a small shift of the main peaks to lower angles.Reference Jeenpadiphat, Björk, Odén and Tungasmita35 However, the Al-SBA-15 sample was an exception, showing the lowest a 0 value. The appearance of two small peaks at 2θ = 1.6° and 1.8° assigned to the 110 and 200 planes [Fig. 1(b)], in the SBA-15, SBA-15-SO3H, and Ti-SBA-15 samples, is attributed to a well-ordered 2D hexagonal mesostructure. The absence of these diffraction signals is related to a decrease in their wall thickness (a 0 − D BJH), which resulted from a partial destruction of the pore structure as in the Al-SBA-15, Al-SBA-15-SO3H, and Ti-SBA-15-SO3H materials.Reference Çitak, Erdem, Erdem and Öksüzoğlu38
(a) SAXRD patterns, (b) SAXRD reflections (110) and (200), (c) N2 adsorption isotherms, and (d) TGA analysis of M-SBA-15 and M-SBA-15-SO3H materials. Adapted with permission from Ref. Reference Cabrera-Munguia, Tututí-Ríos, Gutiérrez-Alejandre, Rico and González31. Copyright 2017 Elsevier.

Crystallographic parameter and textural properties of M-SBA-15-SO3H catalysts. Adapted with permission from Ref. Reference Cabrera-Munguia, Tututí-Ríos, Gutiérrez-Alejandre, Rico and González31. Copyright 2017 Elsevier.

N2 physisorption isotherms are depicted in Fig. 1(c). All samples except Al-SBA-15 and Al-SBA-15-SO3H exhibit isotherms of type IV (and type I hysteresis) at relative pressures of about 0.6–0.8,Reference Margolese, Melero and Christians32,Reference Jeenpadiphat, Björk, Odén and Tungasmita35 which were attributed to adsorption–desorption branches whose sharpness indicates the narrow of the pore size distribution,Reference Cattaneo, Chiara, Villa, Angioni, Milanese, Capsoni, Grandi, Mustarelli, Allodi, Mariotto, Brutti and Quartarone36 which was previously reportedReference Cabrera-Munguia, Tututí-Ríos, Gutiérrez-Alejandre, Rico and González31 and complemented with Fig. S1 (Supplementary Material). The isotherms of the Al-SBA-15 and Al-SBA-15-SO3H catalysts exhibit a two-step desorption branch (Type II hysteresis), suggesting the presence of bottleneck mesoporousReference Chen, Huang, Xiu, Han and Bao39 and the reduction of the pore diameter uniformity. According to Table I, the substitution of silicon atoms by aluminum, titanium, and the incorporation of –PrSO3H gives rise to an increase in surface area and pore diameter for the M-SBA-15 and M-SBA-15-SO3H materials compared to SBA-15.Reference Mbaraka and Shanks26 The Al-SBA-15 sample was an exception with the lowest mean pore diameter (broader pore size distribution) and the highest surface area.Reference Li, Xu, Xu, Hu, Ma and Guo30,Reference Zheng, Li, Zhao, Wei and Sun40,Reference Ochoa-Hernández, Yanga, Pizarro, de la Peña O’Shea, Coronado and Serrano41
Table I also indicates that the incorporation of Al and Ti into the SBA-15 is far less than the expected of Si/M = 10 and could be due to the solubilization of these metals in the acid medium.Reference Chen, Huang, Xiu, Han and Bao39,Reference Zheng, Li, Zhao, Wei and Sun40 In addition, this ratio was lower for Al-SBA-15 than that for Ti-SBA-15 (Si/M = 33 and 51, respectively) indicating a better incorporation of aluminum. This difference is probably related to the variation in the ionic radii of siliceous (0.540 Å), aluminum (0.675 Å), and titanium (0.745 Å). Furthermore, the addition of sulfonic groups to the Al-SBA-15 sample reduces the incorporation of aluminum into the SBA-15. Table I also shows the Si/S molar ratios of samples prepared with -PrSO3H. The incorporation of sulfur in the SBA-15 structure was about one third of that expected. However, the Si/S ratios were slightly lower for M-SBA-15-SO3H samples compared to SBA-15-SO3H.
Figure 1(d) presents the TGA results of the samples. Three weight losses were identified, the first in the range of 30 to 150 °C was associated with the desorption of physisorbed water. The profiles indicate a loss of 14.5, 11.2, and 7 wt% for Al-SBA-15-SO3H, Ti-SBA-15-SO3H, and SBA-15-SO3H, respectively. This shows that the SBA-15-SO3H catalyst is less hydrophilic than others. The second weight loss was attributed to the decomposition of P123, and it is located in the range of 150 to 300 °C. In this region, all samples lost about 2–3 wt%, but SBA-15 and Al-SBA-15 samples lost 6 and 9.4 wt%, respectively. The third weight loss occurred from 300 to 700 °C and was assigned to the decomposition of organic matter,Reference Rahmat, Sadon and Abeed-Yusof42 being more pronounced for M-SBA-15-SO3H, as expected.
UV-Vis-DRS spectra of the Ti-SBA-15 [Fig. 2(a)] and Ti-SBA-15-SO3H [Fig. 2(b)] samples exhibit an absorption band in the range of 200–350 nm, indicating that tetrahedral, octahedral, and polymeric species of Ti+4 are present.Reference Chen, Mochizuki, Abe, Toba and Yoshimura24 The deconvolution of the spectra shows that the band centered at 215 nm is related to the ligand–metal charge transfer transition of isolated [TiO4] tetrahedral species. The band at 250 nm belongs to isolated [HOTiO3] units with an octahedral coordination sphere, whereas the band centered at 290 nm is due to the presence of polymeric Ti+4 species.Reference Chen, Mochizuki, Abe, Toba and Yoshimura24,Reference Léon, Song, Su, An, Liu, Gao, Guo and Leng25 It is noticed in Table SI (Supplementary Material) that the addition of -PrSO3H to Ti-SBA-15 reduces (6%) the relative population of tetrahedral Ti+4 species and increases the relative population of polymeric Ti+4 species. This implies that most of the Ti ions are incorporated and homogeneously distributed into the silicate framework of Ti-SBA-15-SO3H.Reference Chen, Mochizuki, Abe, Toba and Yoshimura24
Deconvolution of UV-Vis-DRS spectra of (a) Ti-SBA-15 and (b) Ti-SBA-15-SO3H.

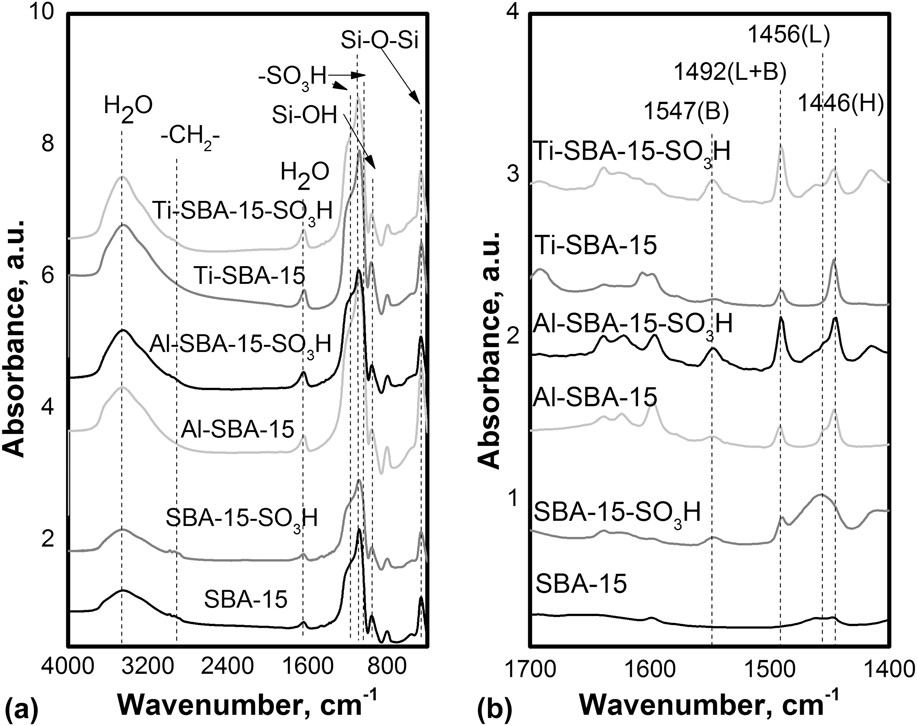
FT-IR spectra of the M-SBA-15 and M-SBA-15-SO3H samples [Fig. 3(a)] show bands with maxima at 1630 and 3400 cm−1 attributed to physisorbed water and hydrogen bonding between water molecules, which were less intense for the SBA-15 and SBA-15-SO3H materials. The band around 2920 cm−1 is associated with the C–H stretching vibration mode of propyl groups which resulted from the incorporation of sulfonic groups. The suitable incorporation of –PrSO3H groups in the samples is evidenced by the presence of bands at 1052 and 1140 cm−1, assigned to symmetric and asymmetric vibrations of –SO3H groups. The bands at 470 and 1090 cm−1 are related to the bending and asymmetric stretching vibrations of Si–O–Si; and the band at about 960 cm−1 is associated with Si–OH groups. These bands were observed in all samples, but are more intense for the M-SBA-15 catalysts.Reference Çitak, Erdem, Erdem and Öksüzoğlu38,Reference Dalla-Costa, Legnoverde, Lago, Decolatti and Querini43 In addition, the absence of the band assigned to –SH groups (2400 cm−1) indicates a complete oxidation of thiol groups.Reference Lourenço, Macedo and Fernandes44
(a) FT-IR spectra with KBr and (b) FT-IR spectra of M-SBA-15 and M-SBA-15-SO3H with adsorbed pyridine evacuated at 100 °C. H: Hydrogen bonding, L: Lewis acid site, B: Brönsted acid site. Adapted with permission from Ref. Reference Cabrera-Munguia, Tututí-Ríos, Gutiérrez-Alejandre, Rico and González31. Copyright 2017 Elsevier.

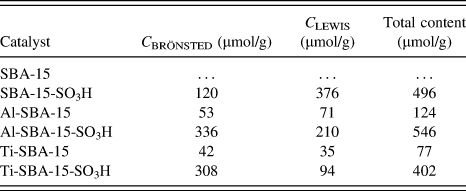
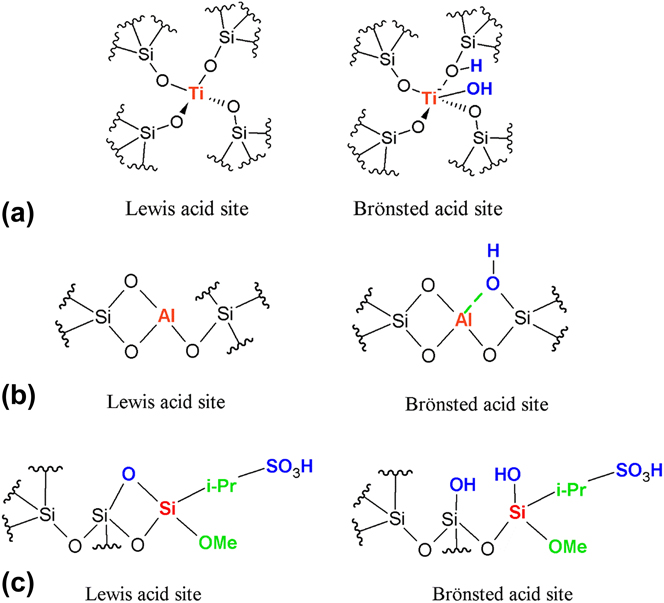
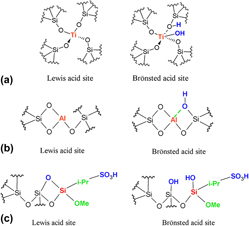
The surface acid properties of M-SBA-15 and M-SBA-15-SO3H materials were determined by pyridine adsorption experiments analyzed by FT-IR [Fig. 3(b)]. To quantify the concentration of acid sites, the integration of the bands located at 1456 cm−1 (Lewis acid sites) and 1547 cm−1 (Brönsted acid sites) was used.Reference Emeis45 The results are summarized in Table II. The order of the total surface acidity is Al-SBA-15-SO3H > SBA-15-SO3H > Ti-SBA-15-SO3H > Al-SBA-15 > Ti-SBA-15 > SBA-15. For SBA-15 only signals associated with hydrogen bonding, interactions between pyridine and silanol groups (Si–O–H) were observed. The incorporation of titanium into the SBA-15 framework increases the intensity of the bands corresponding to Lewis (1456 cm−1) and Brönsted acid sites (1547 cm−1). The Lewis sites are related to Ti+4 coordinated to four oxygen atoms in a tetrahedral coordination as observed in Fig. 4(a), whereas Brönsted acid sites are attributed to Ti+4 species, coordinated to five oxygen atomsReference Yang, Zhou and Han46 [Fig. 4(a)]. The Ti-SBA-15 sample shows a relative concentration of Brönsted and Lewis acid sites of 54.5%, and 45.5%, respectively. A similar trend is noticed in the FT-IR spectrum of Al-SBA-15, where aluminum atoms in octahedral coordination also called aluminum extra framework are related to Lewis acidity,Reference Mokaya and Jones47 while aluminum in tetrahedral coordination is associated with Brönsted acid sites [Fig. 4(b)].Reference Muthu Kumaran, Garg, Soni, Kumar, Gupta, Sharma, Rama Rao and Dhar37 In the Al-SBA-15 sample, the relative concentration of Brönsted and Lewis acid sites is 42.7% and 57.3%, respectively. In general, the incorporation of Al+3 and Ti+4 by sol–gel resulted in materials with Brönsted and Lewis acid sites. Table II also shows that the total concentration of acid sites on the M-SBA-15 materials is 5-fold lower than that of M-SBA-15-SO3H, denoting the high increment in their acid properties after the addition of –PrSO3H groups. The addition of sulfonic groups in the Ti-SBA-15 material increased 7-fold the concentrations of Brönsted acid sites, meanwhile the concentration of Lewis acid sites was triplicated, compared to the sample with no sulfur. Similarly, the incorporation of sulfonic groups in the Al-SBA-15 resulted in an increment by 6-fold in the concentration of Brönsted acid sites, and also the concentration of Lewis acid sites is triplicated, compared to the sample with no sulfur; indicating that the addition of sulfonic groups in M-SBA-15 gives rise to materials with predominating Brönsted acidity, a relative concentration of 62% for Al-SBA-15-SO3H, and 77% for Ti-SBA-15-SO3H. The increase in the acidity after the addition of sulfonic groups was reported in other research studies.Reference Chen, Yokoi, Tang, Jang, Tatsumi, Chan and Cheng19,Reference Mbaraka, Radu, Lin and Shanks21 However, the incorporation of sulfonic groups in SBA-15 resulted in a material with 76% and 24% of Lewis and Brönsted acidity, respectively. Lewis acidity could be explained by the presence of siloxane bridge sites (Si–O–Si),Reference Morrow and Cody48 formed by the dehydroxylation of the silica surface at high temperatures (400 °C).Reference Morrow and Cody48 In this case, the high electronegativity of the oxygens in the –PrSO3H groups, bonded to Si atoms in the SBA-15 framework, creates an inductive effect generating more acidic Si atoms [Fig. 4(c)], and thus, Lewis acid sites. Indeed, the FT-IR spectrum of the SBA-15-SO3H [Fig. 3(b)] shows intense bands at 1456 cm−1 associated with coordinated pyridine on Lewis acid sites, and at 1446 cm−1 due to hydrogen bonding between pyridine and the hydroxyls groups bonded to silicon. The latter is attributed to the hydrogen atoms present in the –PrSO3H groups and also to the more acid silanol groups (Si–OH) which are considered Brönsted acid sites of weak strength. Although pyridine is the probe molecule most widely used to determine surface acidity of amorphous silica-alumina materials, the weak Brönsted acid sites (Si–OH) are incapable to protonate pyridine. It is therefore necessary to use other probe molecule, such as 2,6 dimethylpyridine, for the evaluation of the silanol groups in M-SBA-15-SO3H.Reference Crépeau, Montouillout, Vimont, Mariey, Cseri and Mauge49
Acid properties of M-SBA-15-SO3H materials. Adapted with permission from Ref. Reference Cabrera-Munguia, Tututí-Ríos, Gutiérrez-Alejandre, Rico and González31. Copyright 2017 Elsevier.

Lewis and Brönsted acid sites of (a) Ti-SBA-15, (b) Al-SBA-15, and (c) SBA-15-SO3H.

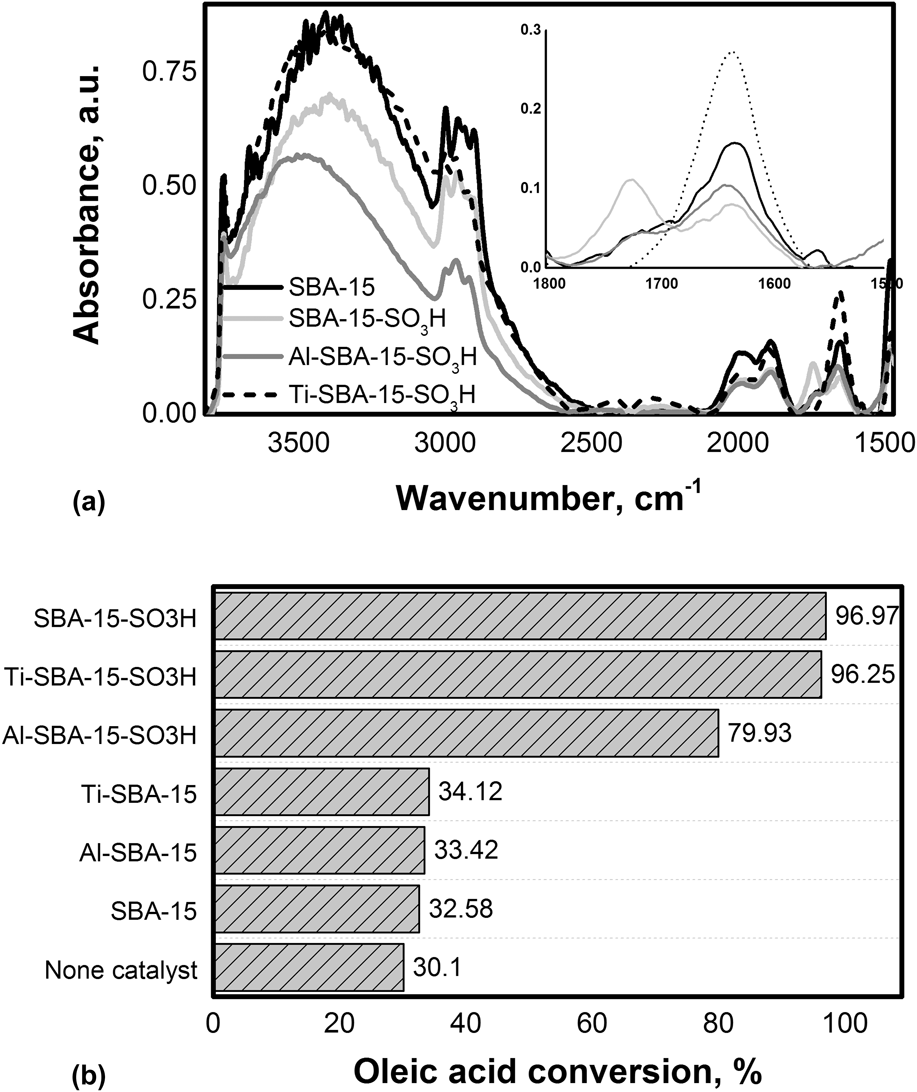
Figure 5(a) presents additional DRIFT spectra. These experiments were intended to find the water adsorption capacity of our samples. The adsorption of water is clearly identified by a band at about 1630 cm−1, and the intensity of this signal gives some guidance of the hydrophobicity behavior of the materials, showing the following trend: Ti-SBA-15-SO3H < SBA-15 < Al-SBA-15-SO3H < SBA-15-SO3H. Among all catalysts, the SBA-15-SO3H sample is therefore the less hydrophilic material, as also observed by the TGA characterization above.
(a) DRIFT spectra of SBA-15, SBA-15-SO3H, and M-SBA-15-SO3H materials with adsorption of water vapor and (b) oleic acid conversion of M-SBA-15 and M-SBA-15-SO3H at 2 h and 140 °C.

To analyze the role played by the acidic properties of M-SBA-15 and M-SBA-15-SO3H materials, catalytic experiments were carried out for the esterification of oleic acid. The conversion after 2 h of reaction is presented in Fig. 5(b). A conversion of 30.1% observed with no catalyst was similar to that for SBA-15 (32.58%) and was due to the high reaction temperature (140 °C). Similarly, Al-SBA-15 and Ti-SBA-15 showed conversions of 33.42% and 34.14%, respectively. The low conversions observed with these samples are related to the low total acidity. However, the conversions of oleic acid under similar reaction conditions, but in the presence of Al-SBA-15-SO3H, Ti-SBA-15-SO3H, and SBA-15-SO3H, were 79.93%, 96.25%, and 96.97%, respectively, which showed the influence of the high total acidity measured in those samples.
The transformation of oleic acid in the presence of our materials at short periods of time was also assessed.Reference Cabrera-Munguia, Tututí-Ríos, Gutiérrez-Alejandre, Rico and González31 The conversions observed for SBA-15-SO3H and Ti-SBA-15-SO3H catalysts were close to 80% in just 0.5 h at 140 °C, whereas those for Al-SBA-15-SO3H and SBA-15 were 42.15% and 10%, respectively, which again, showed the influence of acidity. Although the high acidity observed on Al-SBA-15-SO3H, the low catalytic activity was probably due to the higher hydrophilicity of this sample compared to that of SBA-15-SO3H. It was reported that the hydrophilicity of an oxide mineral is dominated by surface hydroxyl groups (Brönsted acidity).Reference Szczodrowski, Prélot, Lantenois, Douillard and Zajac50 The high catalytic activity of Ti-SBA-15-SO3H [Fig. 5(b)] could be due to the presence of less ionizable hydroxyl groups, resulted in a more hydrophilic surface, compared to Al-SBA-15-SO3H.Reference Szczodrowski, Prélot, Lantenois, Douillard and Zajac50
B. Resistance to deactivation of M-SBA-15-SO3H materials and morphology
To verify the resistance to deactivation of M-SBA-15-SO3H catalysts, experiments were performed during three consecutive reaction cycles at 140 °C and 0.5 h, which is already reported.Reference Cabrera-Munguia, Tututí-Ríos, Gutiérrez-Alejandre, Rico and González31 The Al-SBA-15-SO3H sample showed a low conversion of 42.15%, which decreased to 28.72% after the third reaction cycle. By contrast, Ti-SBA-15-SO3H presented a high conversion of 79.34% in the first experiment and then showed a dramatic decrease to 29.32% in the third cycle. The SBA-15-SO3H catalyst showed a conversion of 80.29% at the end of the first experiment, the conversion went down to 71.08% in the second, and finally reached 55.2% after the third reaction cycle. Formation of water during the reaction, with the subsequent hydration of the surface acid sites, could be the reason of the decrease in activity observed for the M-SBA-15-SO3H catalysts.Reference Chen, Yokoi, Tang, Jang, Tatsumi, Chan and Cheng19,Reference Cabrera-Munguia, González, Gutiérrez-Alejandre, Rico, Huirache-Acuña, Maya-Yescas and del Río23 In this process, the Lewis acidity is transformed to Brönsted acidity.Reference Léon, Song, Su, An, Liu, Gao, Guo and Leng25 Hence, due to the low concentration of Lewis acid sites (23%, Table II) present on Ti-SBA-15-SO3H, the deactivation of this sample was faster than that observed for the SBA-15-SO3H sample (77%, Table II). This was probably due to differences in water adsorption on these samples, as the DRIFT spectra indicate.
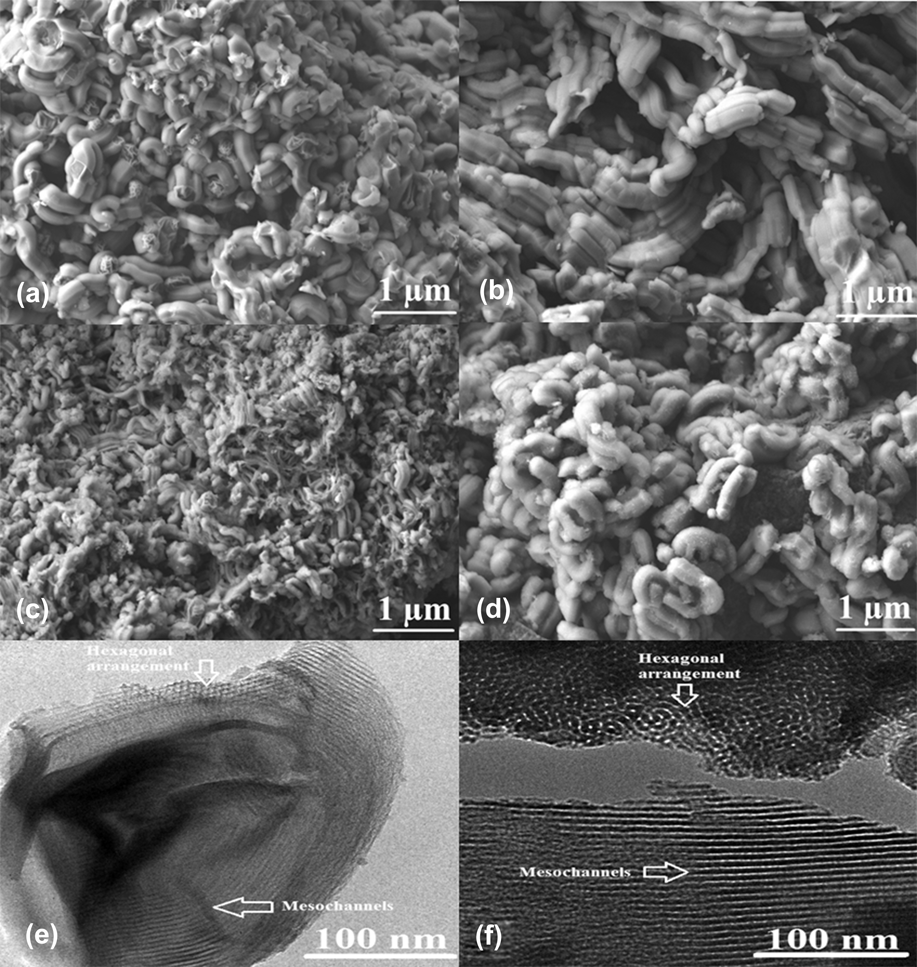
SEM micrographs of M-SBA-15-SO3H materials indicate that all samples show the typical wheat-like structure of the SBA-15 [Fig. 6(a)], comprised of rod-shaped aggregates.Reference Margolese, Melero and Christians32,Reference Jeenpadiphat, Björk, Odén and Tungasmita35,Reference Dalla-Costa, Legnoverde, Lago, Decolatti and Querini43 However, the micrograph of the SBA-15-SO3H sample [Fig. 6(b)] shows rope-like agglomerates. The length of these particles could be due to the reduction in polarity and the water content when micelles were formed during synthesis.Reference Ruthstein, Schmidt, Kesselman, Talmon and Goldfarb51 This is in agreement with the low intensity bands assigned to physisorbed water found in the FTIR spectrum of the SBA-15-SO3H sample [Fig. 3(a)].
SEM micrographs of (a) SBA-15, (b) SBA-15-SO3H, (c) Al-SBA-15-SO3H, and (d) Ti-SBA-15-SO3H; and TEM images of (e) SBA-15 and (f) SBA-15-SO3H.

The micrographs of Al-SBA-15-SO3H [Fig. 6(c)] and Ti-SBA-15-SO3H [Fig. 6(d)] showed additional spheroidal particles resulted from the incorporation of these metals into the SBA-15 framework.Reference Cabrera-Munguia, González, Gutiérrez-Alejandre, Rico, Huirache-Acuña, Maya-Yescas and del Río23 However, the Al-SBA-15-SO3H sample shows rod-like aggregates of minor size than that of SBA-15, which is in line with the low mesoscopic order found in the XRD patterns for this sample. TEM images of SBA-15 [Fig. 6(e)] and SBA-15-SO3H [Fig. 6(f)] showed a hexagonal arrangement of uniform mesochannels.Reference Margolese, Melero and Christians32 SBA-15 also exhibits the honeycomb-like structure, contrary to the SBA-15-SO3H sample which presents some wormhole-like mesoporous honeycomb structures.Reference Cabrera-Munguia, González, Gutiérrez-Alejandre, Rico, Huirache-Acuña, Maya-Yescas and del Río23
C. Kinetic study and thermodynamic parameters using the SBA-15-SO3H catalyst
Among the catalysts studied here, the SBA-15-SO3H material showed the highest activity for the esterification of oleic acid and possesses a high concentration of surface acid sites, both large pore diameter and specific surface area, and a hexagonal arrangement. The kinetic study for this catalyst was performed at 60, 80, and 100 °C. The fractional conversion of oleic acid at these temperatures versus reaction time using the SBA-15-SO3H catalyst was already reported.Reference Cabrera-Munguia, Tututí-Ríos, Gutiérrez-Alejandre, Rico and González31 At 30 min, the oleic acid conversion was 8.82%, 15.96%, and 28.16% at 60 °C, 80 °C, and 100 °C, respectively. While at 5 h, the conversion was 43.97%, 70.45%, and 90.75%, at 60 °C, 80 °C, and 100 °C, respectively. Additionally, it was possible to simplify the esterification reaction assuming an irreversible change. Furthermore, due to an excess of methanol, the transformation could be considered as a first order reaction rate with respect to oleic acid (OA):
 $$- {r_{{\rm{OA}}}} = k{C_{{\rm{OA}}}}\quad .$$
Substitution of this equation in the performance equation for a batch reactor gives
 $${{{N_{{\rm{OAo}}}}} \over W}\left( {{{{\rm{d}}{X_{{\rm{OA}}}}} \over {{\rm{d}}t}}} \right) = k{C_{{\rm{OAo}}}}\left( {1 - {X_{{\rm{OA}}}}} \right)\quad ,$$
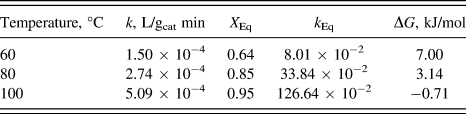
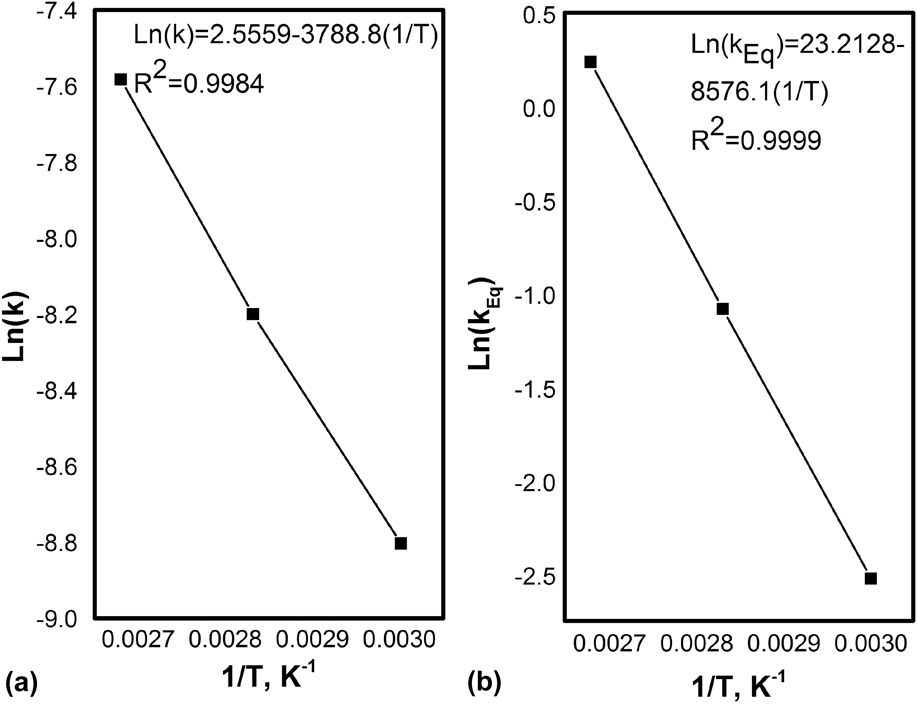
where W means g of catalyst; t is the reaction time in min; NOAo and NOA are the number of moles of OA initially present and at any reaction time, respectively; k is the reaction rate coefficient in L/min.g of catalyst, and XOA is the fractional conversion of OA. From the experimental data and the above assumptions, the reaction rate coefficients were calculated and are presented in Table III. The increase in the values as a function of temperature is clearly observed. The reaction rate coefficients were then used to calculate the activation energy by the Arrhenius equation. An activation energy of 31.5 kJ/mol [Fig. 7(a)] which is in agreement with the value of 29.58 kJ/mol previously reported in the literatureReference Shah, Parikh and Maheria27 was determined. Some additional catalytic experiments were performed to calculate the heat of the reaction and the entropy with the linearized Van’t Hoff equation:
 $$\ln {K_{{\rm{Eq}}}} = - {{\Delta H} \over {RT}} + {{\Delta S} \over R}\quad ,$$
where K Eq is the equilibrium constant, R is the gas constant, T is the absolute temperature, ΔH is the heat of reaction, and ΔS is the entropy change. Plotting 1/T versus ln K Eq, the values of ΔH and ΔS can be evaluated [Fig. 7(b)]. To estimate the experimental values of K Eq, the equilibrium conversion was experimentally obtained performing long catalytic experiments at 60, 80, and 100 °C until the conversion of oleic acid was stable. (Table III). The thermodynamics parameters obtained were ΔH = 71.3 kJ/mol and ΔS = 192.98 J/(mol.K) indicating that the esterification of oleic acid is an endothermic reaction as it is already reported.Reference Alenezi, Leeke, Winterbottom, Santos and Khan33,Reference Ma, Han, Sun, Lu and Ding52 Furthermore, it was possible to calculate the Gibbs free energy at each temperature (Table III), as ΔG is defined as
 $$\Delta G = - RT\ln {k_{{\rm{Eq}}}}\quad .$$
Kinetic and thermodynamic parameters for the esterification of oleic acid over SBA-15-SO3H at 60, 80, and 100 °C.

(a) Arrhenius plot for the pseudo first order rate constant and (b) linear plot of ln (k Eq) versus 1/T for the esterification of oleic acid over SBA-15-SO3H.

According to the values of ΔG obtained (Table III) at 60, 80, and 100 °C, the esterification reaction of oleic acid becomes spontaneous through the formation of the respective ester and water at 100 °C. This explains the conversion of 90.75% obtained after 5 h, which is very close to the equilibrium conversion of 95% at this temperature.
IV. CONCLUSIONS
Incorporation of Al3+, Ti4+, and –PrSO3H into the SBA-15 structure by sol–gel was successfully achieved. However, the final Al, Ti, and S content in the samples was lower than that expected. In addition, the presence of sulfur further reduces the incorporation of aluminum into the SBA-15.
The incorporation of Al+3 and Ti+4 to the SBA-15 framework gives rise to M-SBA-15 materials with both Lewis and Brönsted acid sites. In addition, the total concentration of acid sites of M-SBA-15-SO3H samples is enhanced by incorporating –PrSO3H groups when compared with M-SBA-15 counterparts. The presence of sulfonic groups into the silica structure leads to more hydrophobic SBA-15-SO3H catalyst with mainly Lewis and weaker Brönsted acid sites (Si–OH).
The SBA-15-SO3H showed the highest catalytic activity in the esterification of oleic acid, which was related to the high concentration of Lewis acid sites. The sample also presented good stability after three reaction cycles, probably due to its low hydrophilicity. Finally, the kinetic study for the SBA-15-SO3H catalyst showed that the catalytic process followed first order kinetics and that the activation energy (31.5 kJ/mol) was similar to previous results. Thermodynamic analysis also revealed that the catalytic process was spontaneous and that the reaction was endothermic.
Supplementary Material
To view supplementary material for this article, please visit https://doi.org/10.1557/jmr.2018.374.
ACKNOWLEDGMENT
The authors greatly appreciate financial support of CIC-UMSNH. DACM thanks CONACyT for the grant (487883) received during the development of this work. The authors also thank V.H. Lemus Neri (Faculty of Chemistry, UNAM) and M.R. Cisneros Magaña (IIM, UMSNH) for conducting elemental analysis.