In research on the development of childhood and adolescent aggression and peer victimization, investigators have identified distinct subtypes of children, including a group characterized as aggressive-victims. Children in this group differ from those who are primarily aggressive or primarily victimized in terms of both individual attributes and relational-interpersonal experiences (Olweus, Reference Olweus1978; Schwartz, Reference Schwartz2000; Schwartz, Dodge, Pettit, & Bates, Reference Schwartz, Dodge, Pettit and Bates1997; Schwartz, Proctor, & Chien, Reference Schwartz, Proctor, Chien, Juvonen and Graham2001). With respect to their individual characteristics, investigators have proposed that aggressive-victims exhibit a range of social–emotional and social–cognitive deficits. They have been characterized as emotionally charged and provocative victims who engage primarily in reactive and dysregulated forms of aggression (Olweus, Reference Olweus1978; Schwartz, Reference Schwartz2000). Thus, their aggressive behavioral styles appear to be exacerbated by a propensity for emotion dysregulation, and beliefs that their aggressive behaviors are justifiable (Bettencourt & Farrell, Reference Bettencourt and Farrell2013; Bettencourt, Farrell, Liu, & Sullivan, Reference Bettencourt, Farrell, Liu and Sullivan2013; Cooley & Fite, Reference Cooley and Fite2016; Toblin, Schwartz, Gorman, & Abou-ezzeddine, Reference Toblin, Schwartz, Gorman and Abou-ezzeddine2005). In turn, these maladaptive individual characteristics are thought to increase aggressive-victims’ exposure to negative relational experiences, including peer rejection and having fewer friendships, in addition to peer victimization (Schwartz, Reference Schwartz2000). Further, it has been argued that aggressive-victims’ exposure to adverse peer relational experiences makes it more likely that they will develop co-occurring internalizing problems, including withdrawn behaviors (Bettencourt et al., Reference Bettencourt, Farrell, Liu and Sullivan2013; Kochenderfer-Ladd, Reference Kochenderfer-Ladd2003; Schwartz et al., Reference Schwartz, Proctor, Chien, Juvonen and Graham2001).
Taken together, these characterizations, many of which are empirically based, provide a strong conceptual rationale for examining aggressive-victims as a distinct subgroup. However, there are two notable limitations in this area of research. First, much of the extant research on aggressive-victims has consisted of cross-sectional or short-term longitudinal studies (e.g., across 1 or 2 years). Thus, at present, one investigative challenge is to chart the long-term developmental course of aggressive-victims in order to elucidate whether their individual characteristics and relational experiences exhibit developmental variations or consistency across childhood and adolescence. Second, with a few exceptions, studies on aggressive-victims have not explicitly accounted for potential form-specific variations in this subgroup. This is a notable limitation in light of evidence suggesting that the development and etiology of physical and relational aggression are distinct (Cillessen & Mayeux, Reference Cillessen and Mayeux2004; Ettekal & Ladd, Reference Ettekal and Ladd2015; Heilbron & Prinstein, Reference Heilbron and Prinstein2008).
In the current study, we investigated the development of aggressive-victims at multiple developmental periods, spanning from middle childhood (Grade 1) through adolescence (Grade 11), by using person-centered methods to assess the co-occurrence of multiple forms of physical, relational, and verbal aggression and peer victimization. Furthermore, we investigated how a combination of children's individual characteristics and relational experiences differentiated aggressive-victims from children in other subgroups, and moderated pathways of developmental continuity and change across this developmental epoch. We conceptualized children's individual characteristics as consisting of multiple facets of their social–emotional and social–cognitive functioning, in addition to aggression. To investigate social–emotional adjustment we assessed children's emotion dysregulation and withdrawn behaviors, and to assess social cognitions, their moral disengagement. We conceptualized children's relational experiences as consisting of a combination of their dyadic relationships and their social status more broadly in their peer group, in addition to peer victimization. To investigate dyadic relationships, we assessed children's reciprocated friendships, and to assess social status, their peer group rejection.
Development of Aggressive-Victims in Childhood and Adolescence
Investigators have used several approaches to examine the development of aggressive-victims. One approach has consisted of using person-centered methods to identify a subgroup of aggressive-victims based on multiple forms of aggression and peer victimization including physical, verbal, and relational (see Bettencourt et al., Reference Bettencourt, Farrell, Liu and Sullivan2013; Williford, Brisson, Bender, Jenson, & Forrest-Bank, Reference Williford, Brisson, Bender, Jenson and Forrest-Bank2011). Studies utilizing this approach have examined the developmental continuity of aggressive-victims over short-term intervals (e.g., across 1 or 2 years) in late childhood and early adolescence. There has also been some related research using trajectory modeling methods to investigate the development of bully-victims over longer periods of time (e.g., ages 13–16; Barker, Arseneault, Brendgen, Fontaine, & Maughan, Reference Barker, Arseneault, Brendgen, Fontaine and Maughan2008); however, this approach has not accounted for potential form-specific variations in the developmental trajectories of subgroups.
Building on these investigations, in a previous study using the current data set, we investigated the development of aggressive-victims from middle childhood to late adolescence (i.e., Grades 1 to 11) based on their physical, verbal, and relational aggression and peer victimization (Ettekal & Ladd, Reference Ettekal and Ladd2017). Two distinct subgroups of aggressive-victims were identified (in addition to three other groups characterized as primarily aggressors, victims, or children uninvolved in aggression and victimization). The first subgroup, labeled aggressive-victims, had high levels of physical, verbal, and relational aggression and victimization, and the second subgroup, labeled relational aggressive-victims, had high levels of relational aggression and victimization. Developmental pathways were investigated, and among the two aggressive-victim subgroups, many children exhibited a developmental trend characterized by continuity, such that they remained aggressive-victims over time (i.e., from middle childhood through adolescence). Furthermore, some relational aggressive-victims exhibited a late- or adolescent-onset pathway such that they were initially uninvolved, but had increases in relational aggression and victimization over time. The results also indicated significant gender differences such that males were at greater risk for being aggressive-victims, and females were overrepresented among relational aggressive-victims. Taken together, these findings indicated that there are distinct (i.e., form-specific) subgroups of aggressive-victims that exhibit heterogeneous developmental pathways across childhood and adolescence. Building on these findings, in the current study, we sought to investigate whether the indicated individual and relational factors differentiated these two subgroups of aggressive-victims.
Individual Characteristics Associated With Aggressive-Victims
Emotion dysregulation
Researchers have conceptualized emotion regulation as a complex multidimensional construct (Gross, Reference Gross2015). In the current study, we were interested in a specific aspect of emotion regulation particularly relevant for characterizing the social–emotional profile of aggressive-victims: their emotional overreactivity stemming from anger and irritability (referred to here as emotion dysregulation for brevity). Consistent with the conceptualization of aggressive-victims as emotionally charged and provocative victims (Olweus, Reference Olweus1978; Schwartz, Reference Schwartz2000), we hypothesized that they would have the highest rates of emotion dysregulation compared to other subgroups (Bettencourt et al., Reference Bettencourt, Farrell, Liu and Sullivan2013; Cooley & Fite, Reference Cooley and Fite2016; Schwartz, Reference Schwartz2000; Toblin et al., Reference Toblin, Schwartz, Gorman and Abou-ezzeddine2005).
However, there may also be form-specific variations such that emotion dysregulation differentiates the individual characteristics of aggressive-victims and relational aggressive-victims. In contrast to aggressive-victims who engage in more reactive and dysregulated forms of aggression, relational aggressive-victims may be more strongly motivated by reputational social goals, and therefore engaging in relational aggression to enhance their social standing. Thus, we hypothesized that emotion dysregulation would be more consistently associated with being an aggressive-victim than a relational aggressive-victim. However, in light of evidence that emotion dysregulation contributes to both physical and relational forms of aggression and victimization (Giesbrecht, Leadbeater, & Macdonald, Reference Giesbrecht, Leadbeater and Macdonald2011), we also hypothesized that it would increase the chances of being a relational aggressive-victim compared to being uninvolved.
These group differences may also vary by developmental period. Emotion dysregulation has been theorized to be a risk factor for early-onset aggression (Moffitt, Reference Moffitt1993; Yates, Obradović, & Egeland, Reference Yates, Obradović and Egeland2010). Consequently, emotion dysregulation may have a more pronounced association with the three aggressive subgroups in childhood than in adolescence (You & Yoon, Reference You and Yoon2016). In adolescence, there are typically gains in self-regulatory and emotion processes, which coincide with normative declines in aggression (Eisenberg, Spinrad, & Eggum, Reference Eisenberg, Spinrad and Eggum2010). However, the risks for adolescent-onset aggression may increase for children who do not exhibit these gains. Thus, we hypothesized that greater emotion dysregulation would increase the likelihood of transitioning from the uninvolved to one of the aggressive risk groups over time.
Withdrawn behaviors
Although the social–emotional maladjustment of aggressive-victims is typically demonstrated by their externalizing problems and emotion dysregulation, investigators have also posited that their dysregulated behavioral styles and experiences of peer victimization may precipitate co-occurring internalizing problems including withdrawn behaviors (Bettencourt et al., Reference Bettencourt, Farrell, Liu and Sullivan2013; Kochenderfer-Ladd, Reference Kochenderfer-Ladd2003; Schwartz et al., Reference Schwartz, Proctor, Chien, Juvonen and Graham2001). Aggressive-victims who persistently experience conflictual relationships with peers may attempt to withdraw from, or avoid, social interactions as a coping response. However, to the extent peers perceive children's withdrawn behaviors (e.g., passivity and avoidance) as violating peer norms and reflecting an unwillingness to participate in peer-sponsored activities or relationships, they may respond aggressively to these perceived slights (Rubin, Coplan, & Bowker, Reference Rubin, Coplan and Bowker2009). In turn, experiencing victimization is likely to provoke aggressive-victims to react aggressively, resulting in a coercive and cyclic social interaction pattern (Kochenderfer-Ladd, Reference Kochenderfer-Ladd2003; Perry, Kusel, & Perry, Reference Perry, Kusel and Perry1988; Schwartz, Reference Schwartz2000; Schwartz, Dodge, & Coie, Reference Schwartz, Dodge and Coie1993). Consequently, we hypothesized that higher rates of withdrawn behaviors would increase the likelihood that children would be aggressive-victims compared to being aggressors or uninvolved, but not compared to nonaggressive-victims who exhibit more passive and submissive behavioral styles, and are also likely to display withdrawn behaviors.
It is also plausible that there are form-specific variations that may further differentiate the associations between withdrawn behaviors and the two aggressive-victim subgroups. Among relational aggressive-victims who use behaviors such as social exclusion and friendship manipulation to enhance their social standing and perceived reputation among peers (Cillessen & Mayeux, Reference Cillessen and Mayeux2004; Ettekal & Ladd, Reference Ettekal and Ladd2015), it would be antithetical to their social goals to withdraw from, or avoid, social interactions with peers. Thus, we hypothesized a negative association between withdrawn behaviors and membership in this risk group.
These associations may also exhibit age-related variations (Boivin, Petitclerc, Feng, & Barger, Reference Boivin, Petitclerc, Feng and Barger2010; Reijntjes, Kamphuis, Prinzie, & Telch, Reference Reijntjes, Kamphuis, Prinzie and Telch2010; Sugimura, Berry, Troop-Gordon, & Rudolph, Reference Sugimura, Berry, Troop-Gordon and Rudolph2017). To the extent that peer group norms become more influential in adolescence, and it is increasingly nonnormative to engage in withdrawn behaviors, the positive associations between withdrawn behaviors and being an aggressive-victim (and victim) may increase. In contrast, we hypothesized that the negative association between withdrawn behaviors and relational aggressive-victims would be more pronounced in adolescence, a period in which youth become more concerned with their reputations. That is, adolescents are likely to be more motivated than younger children to abstain from withdrawn behaviors and engage in relational aggression in order to enhance their social positions.
Moral disengagement
In addition to their social–emotional maladjustment, aggressive-victims endorse social cognitions that support and justify the use of aggression. Extant evidence indicates that aggressive-victims report more positive beliefs about the use of aggression, have greater intentions to use physically aggressive responses in social conflicts with peers, and feel less self-efficacy to respond with nonaggressive behaviors (Bettencourt & Farrell, Reference Bettencourt and Farrell2013). Building on these findings, we sought to investigate the role of moral disengagement. Bandura's theory of moral agency (Reference Bandura2002) delineates several social cognitive mechanisms by which children exercise moral disengagement, such as engaging in moral justifications, displacing responsibility, blaming the victim, and minimizing consequences, which collectively function to reduce their self-sanctions (i.e., feelings of guilt or shame) when acting aggressively.
Although the associations between moral disengagement and aggression are well established, less is known about how moral disengagement is associated with being an aggressive-victim. For instance, a meta-analysis by Gini, Pozzoli, and Hymel (Reference Gini, Pozzoli and Hymel2014) indicated significant associations between moral disengagement and aggression; however, most of the studies included in this meta-analysis did not explicitly differentiate aggressive-victims as a distinct subgroup, and primarily included global measures of aggression that consisted of multiple forms. Nonetheless, we posit that experiencing victimization may further promote specific moral disengagement mechanisms among aggressive-victims (e.g., the belief that engaging in aggressive retaliations are justified, and that other children are to blame for these reactions). Research on bullying provides some support for this proposition, such that bully-victims have been found to endorse higher rates of moral disengagement (Obermann, Reference Obermann2011).
Additional research is also needed to investigate potential form-specific variations in aggression and moral disengagement. For instance, although a study by Kokkinos, Voulgaridou, Mandrall, and Parousidou (Reference Kokkinos, Voulgaridou, Mandrali and Parousidou2016) found that moral disengagement predicted relational aggression, they did not control for co-occurring physical aggression. Furthermore, to our knowledge, there are no published studies that have examined the associations between moral disengagement and relational aggressive-victims. Thus, although it is unclear how they would directly compare with aggressive-victims, we hypothesized relational aggressive-victims would also endorse higher levels of moral disengagement compared to the uninvolved group, similar to the other aggressive risk groups.
In light of evidence that moral disengagement has a stronger association with aggression in adolescence than in childhood (Gini et al., Reference Gini, Pozzoli and Hymel2014), it is also plausible that subgroup differences vary by developmental period. Consequently, we hypothesized that moral disengagement would also increase the likelihood that children in the uninvolved group transition to one of the aggressive risk groups over time (e.g., during the transition from late childhood to early adolescence, and from early to late adolescence).
Relational Experiences Associated With Aggressive-Victims
Peer rejection
A substantial body of research indicates that peer rejection is strongly associated with multiple forms of aggression and peer victimization (Card, Stucky, Sawalani, & Little, Reference Card, Stucky, Sawalani and Little2008). Consistent with social interactional continuity perspectives (Caspi, Elder, & Bem, Reference Caspi, Elder and Bem1987), when children act aggressively, these adverse behaviors are likely to elicit peer rejection and hostile peer reactions (Boivin & Hymel, Reference Boivin and Hymel1997). These peer reactions, in turn, are likely to promote and maintain aggression, thus increasing the risks for being an aggressive-victim.
Although there are robust associations among peer rejection and multiple forms of aggression and peer victimization, there are several reasons to posit subgroup differences. First, although peer rejection is associated with physical and relational aggression, its association with physical aggression is stronger (Card et al., Reference Card, Stucky, Sawalani and Little2008). Second, the associations between rejection and aggression tend to be more pronounced in childhood than in adolescence (Cillessen & Mayeux, Reference Cillessen and Mayeux2004; Ladd, Reference Ladd2006). Third, in contrast to its associations with aggression, its association with peer victimization appears to be less sensitive to developmental timing, and persists across childhood and adolescence (Cillessen & Lansu, Reference Cillessen and Lansu2015; Sentse, Prinzie, & Salmivalli, Reference Sentse, Prinzie and Salmivalli2017; Sheppard, Giletta, & Prinstein, Reference Sheppard, Giletta and Prinstein2016). Taken together, we hypothesized that peer rejection would be significantly associated with each of the four risk subgroups compared to the uninvolved group; however, its association with aggressive-victims would be stronger compared to relational aggressive-victims, aggressors, and victims, particularly in childhood.
Friendships
In contrast to peer rejection, which reflects children's social status more broadly in their peer group, friendships are characterized as dyadic relationships. Although having fewer friendships is associated with greater victimization (Sentse, Dijkstra, Salmivalli, & Cillessen, Reference Sentse, Dijkstra, Salmivalli and Cillessen2013), insights gleaned from research on relational aggression suggest that the associations between friendships and aggressive-victims may be qualified by form-specific differences. On the one hand, friendships appear to be a prerequisite for engaging in certain forms of relational aggression, and relational aggression may function to maintain social boundaries and friendships (Kawabata, Tseng, & Crick, Reference Kawabata, Tseng and Crick2014). On the other hand, the functional value of physical aggression has been more controversial. There is some evidence that children who use different forms of aggression are able to maintain more friendships if they use these behaviors strategically and in combination with other prosocial behaviors (Hawley, Little, & Card, Reference Hawley, Little and Card2007). However, these associations are more likely to occur among children who use aggressive behaviors moderately, as opposed to excessively (Ettekal & Ladd, Reference Ettekal and Ladd2015), and may not emerge among aggressive-victims, who have been characterized as ineffectual aggressors who use aggression in maladaptive ways (Schwartz et al., Reference Schwartz, Proctor, Chien, Juvonen and Graham2001). Thus, we hypothesized that having more friendships would be associated with relational aggressive-victims, and having fewer friendships would be associated with aggressive-victims (and victims).
Furthermore, these hypotheses are likely qualified by developmental timing. Not only do friendships have more salience as children mature and during the transition to adolescence, but the strategic uses of relational aggression to maintain friendships appears to be more pronounced in adolescence, presumably because adolescents have developed the social–emotional and cognitive capacities to use these behaviors in more functional ways to enhance their friendships (Ettekal & Ladd, Reference Ettekal and Ladd2015; Hodges, Boivin, Vitaro, & Bukowski, Reference Hodges, Boivin, Vitaro and Bukowski1999; Kendrick, Jutengren, & Stattin, Reference Kendrick, Jutengren and Stattin2012). Consequently, we hypothesized that friendships would increase the likelihood of adolescent-onset pathways from the uninvolved group to the relational aggressive-victim group.
Study Aims
At four different grade levels (1, 5, 8, and 11), children and adolescents were classified into subgroups (i.e., aggressive-victims, relational aggressive-victims, aggressors, victims, and uninvolved) based on their physical, verbal, and relational peer aggression and victimization. Each of these grade levels was selected to reflect distinct developmental periods. More specifically, Grade 1 was intended to reflect middle childhood, Grade 5 late childhood, Grade 8 early adolescence, and Grade 11 late adolescence. During each of these developmental periods, we evaluated the cumulative (i.e., additive) associations of the individual and relational factors (i.e., emotion dysregulation, withdrawn behaviors, moral disengagement, peer rejection, and friendships) on risk group membership in order to determine how aggressive-victims and relational aggressive-victims were distinct subgroups. Subsequently, longitudinal analyses were performed to assess developmental continuity and change. From a person-oriented perspective, developmental continuity and change can be operationalized as the likelihood (or probability) that children remain within the same subgroup or transition into a different group over time. Consistent with this operationalization, we investigated how the indicated individual and relational factors moderated developmental pathways over time, and the extent to which they were associated with late- or adolescent-onset pathways, characterized by making a transition from the uninvolved group to one of the risk groups. This study relied on person-centered methods consisting of latent profile and transition analyses. Compared to more traditional approaches, this methodology does not rely on an arbitrary cutoff score, better accounts for measurement error, and is more accurate at identifying distinct subgroups (see Giang & Graham, Reference Giang and Graham2008; Nylund, Bellmore, Nishina, & Graham, Reference Nylund, Bellmore, Nishina and Graham2007). This methodology was also advantageous compared to variable-centered methods, because it more readily allowed for the identification of distinct subgroups based on multiple forms of aggression and peer victimization, and the estimation of cumulative and longitudinal moderation effects among the identified subgroups.
Method
Participants
Data for this study were part of a larger longitudinal project of children's psychological, social, and academic development from kindergarten to Grade 12. Participants were 482 children (242 females and 240 males) who had aggression and peer victimization data available. From this sample, the majority of participants (n = 383) were recruited upon kindergarten entry (M age = 5.59), and an additional sample (n = 99) of children were added to the longitudinal project in Grade 5, and therefore had no available data from earlier years. Children were primarily Caucasian (80.1%) and African American (15.8%), as well as a small percentage of other backgrounds (4.1%). The median total family income was between $30,001 and $40,000 (19.1% low income, i.e., below $20,000; 43.1% middle income or higher, i.e., over $50,001), and consisted of nearly equal proportions of families from urban, suburban, and rural communities.
Procedure
A large number of potential school districts were identified, representing school districts in larger (moderately urban), suburban, and rural areas in a Midwestern state. Schools within these districts were contacted and randomly selected for participation in this project (among those who agreed to participate). Project staff attended prekindergarten screening meetings for all participating schools, met with parents, explained the project, and collected parent consent forms. Of the families (N = 525) invited to participate in this study, 95% agreed to participate. At all ages, children were asked to provide assent prior to participation.
This study utilized multi-informant data collected across four grades (Grades 1, 5, 8, and 11). Participants and their classmates completed peer-report questionnaires that assessed physical, verbal, and relational aggression and peer victimization as well as peer rejection and mutual friendships. Administration procedures varied across grade levels to account for developmental differences and changing school settings. In Grade 1, participants completed individual interviews with a trained staff member and were asked to provide nominations by pointing to photographs of their classmates that were displayed on a felt board. Starting in Grade 5, classroom-wide sociometric procedures were used. Before participants completed the peer nomination forms, they used practice criteria to ensure that they knew their classmates’ names and could perform the nomination procedures correctly. In higher levels of schooling (Grades 8 and 11), because participants spent time in multiple classrooms and it was not feasible to interview all of their classmates in all of their classes (or all grade-mates for that matter), permission was obtained to review participants’ class schedules, and grade-mates who shared a minimum of one class with the participant (referred to hereafter as classmates) were identified from which a pool of nominators (up to 40) was randomly selected. This method of randomly selecting nominators has been found to be a valid and reliable method for collecting sociometry data when it is not feasible to include the entire sample of grade-mates (see Poulin & Dishion, Reference Poulin and Dishion2008; Prinstein, Reference Prinstein2007). Moreover, to ensure that respondents knew the persons they were nominating, respondents were instructed to nominate only those classmates they knew well, and all items included a response category labeled “don't know this person.” From Grades 1 to 11, the total pool of nominators ranged from 1,576 to 2,593 students across 53 to 166 classes (M = 17.8 to 29.7 nominators per class). In the vast majority of classrooms, across grades levels students were nominated by 15 peers or more (i.e., from 86% to 98%).
In addition to peer-report data, participants and their primary caretakers and teachers completed questionnaires. Self-report data was used to assess children's moral disengagement. Parent- and teacher-report data was used to assess participants’ withdrawn behaviors and emotion dysregulation. Over time, participants in this study became increasingly dispersed and attended many different schools with varying school structures. Approximately 80% of children made the transition to middle or junior high school (in Grades 6 or 7); the remaining attended K–8 schools. Previous analyses with this sample have found that these variations in school transitions have had negligible effects on children's aggression and peer victimization. During the secondary school years (when students moved from class to class), project staff reviewed children's class schedules, identified teachers who taught the child for at least one class period (preferably for an academic subject), and asked if they knew the participating child well enough to complete the questionnaires, and were willing to participate in this project.
Measures
Aggression and victimization
Peer reports were used to assess six indicators of children's physical, verbal, and relational peer-directed aggression and victimization: (a) “Someone who hits, kicks, or pushes other kids” (i.e., physical aggression); (b) “Someone who teases, calls names, or makes fun of other kids” (i.e., verbal aggression); (c) “Someone who tells other kids they won't like them or be their friend anymore just to hurt them or get their own way” (i.e., relational aggression); (d) “Someone who gets hit, pushed, or kicked by other kids” (i.e., physical victimization); (e) “Someone who gets teased, called names, or made fun of by other children” (i.e., verbal victimization); and (f) “Those who other kids gossip about or say bad things about behind their backs” (i.e., relational victimization). In Grade 1, children provided limited nominations (up to three), and items pertaining to relational aggression and victimization were not collected. In subsequent grades, children could provide unlimited nominations, and all six indicators were assessed. For each indicator, standardized scores were computed by classroom to adjust for the varying number of nominators per classroom. Peer nominations are a well-established, valid, and reliable methodology for assessing children's aggressive behaviors and peer victimization experiences (see Coie, Dodge, & Coppotelli, Reference Coie, Dodge and Coppotelli1982; Ladd & Kochenderfer-Ladd, Reference Ladd and Kochenderfer-Ladd2002; Parkhurst & Asher, Reference Parkhurst and Asher1992).
Peer rejection and mutual (reciprocated) friendships
To assess peer rejection, participants were asked to nominate up to three classmates who they least liked (“Kids who you don't like to play [hang out] with at school”). In Grades 8 and 11, the phrase “hang out” was substituted for “play,” to be more developmentally appropriate with adolescents (see Graham & Juvonen, Reference Graham and Juvonen2002; Schwartz, Gorman, Nakamoto, & McKay, Reference Schwartz, Gorman, Nakamoto and McKay2006). Administration and scoring procedures were identical to those described for other peer nomination indicators, and are well established for assessing children's social status using sociometric methods (Coie et al., Reference Coie, Dodge and Coppotelli1982).
Mutual (i.e., reciprocated) friendships were measured by asking children to nominate up to five classmates who they considered to be a “best friend.” Participants were considered to have a mutual friend if the person they nominated as a best friend nominated them as one of their five best friends (see Parker & Asher, Reference Parker and Asher1993). For each child, a friendship score was computed by summing his or her total number of reciprocated friendships. These scores were standardized by classroom to adjust for nominator differences. Friendship data was not available for all of the participants in Grade 11, and therefore was not included in the data analysis for this grade level.
Emotion dysregulation
To assess children's emotional reactivity stemming from anger and irritability across contexts (i.e., at home and school), a multi-informant measure was created based on parent and teacher reports. At every assessment wave, teachers completed the Teacher Report Form (TRF), and parents completed the Child Behavior Checklist (CBCL; Achenbach & Rescorla, Reference Achenbach and Rescorla2001) in Grades 5, 8, and 11. Both measures used a similar response format based on a 3-point scale (1= not true; 2 = somewhat or sometimes true; 3 = very true or often true). Using these measures, an adapted subscale was computed using five items that were included in both the CBCL and the TRF (i.e., screaming, irritability, sudden mood changes, temper displays, and jealous behavior). This subscale was developed by Olson et al. (Reference Olson, Sameroff, Lansford, Sexton, Davis-Kean, Bates and Dodge2013), who deconstructed items from the CBCL and TRF to reflect five distinct subcomponents of externalizing problems including emotion dysregulation. This subscale demonstrated adequate internal reliability over time for parent (αs ranged from 0.74 to 0.82) and teacher reports (αs ranged from 0.80 to 0.85). An aggregated measure was created by averaging the parent- and teacher-report subscales.
Withdrawn behaviors
To assess withdrawn behaviors across contexts, a similar method was used as described for emotion dysregulation. The nine-item withdrawn behaviors subscales from the TRF (αs ranged from 0.78 to 0.85) and the CBCL (αs ranged from 0.71 to 0.82) were aggregated by taking the corresponding average scores from both subscales. The TRF and the CBCL used comparable items, which indexed shy or solitary behaviors, avoidance or withdrawal from peer activities, and abstaining from social overtures.
Moral disengagement
A self-report scale was used to assess children's moral disengagement. This scale was a shortened adaptation of Bandura, Barbaranelli, Caprara, and Pastorelli's (Reference Bandura, Barbaranelli, Caprara and Pastorelli1996) moral disengagement scale, which primarily assessed moral disengagement pertaining to aggressive behaviors. Twelve items were selected from the original measure, which tapped four mechanisms of moral disengagement, including moral justification (3 items; e.g., “it is alright to fight to protect your friends”), euphemistic labeling (3 items; e.g., “slapping and shoving is just a way of joking”), displacement of responsibility (3 items; e.g., “kids cannot be blamed for misbehaving if their friends pressured them to do it”), and distortion of consequences (3 items; e.g., “teasing someone does not really hurt them”). The response format consisted of a 5-point scale (1 = disagree to a lot to 5 = agree a lot). Items reflecting the different mechanisms are typically aggregated to assess moral disengagement more broadly (Bandura et al., Reference Bandura, Barbaranelli, Caprara and Pastorelli1996; Gini et al., Reference Gini, Pozzoli and Hymel2014; Paciello, Fida, Tramontano, Lupinetti, & Caprara, Reference Paciello, Fida, Tramontano, Lupinetti and Caprara2008). Consistent with this approach, the average score for all items was used to form a single scale. This measure had adequate internal reliability (αs ranged from 0.81 to 0.87 over time). Moreover, confirmatory factor analyses were performed to assess one-factor measurement models. Over time, the one-factor model exhibited adequate model fit, χ2 = 64.89 to 114.20, df = 42, p < .01; comparative fit index (CFI) = .94 to .97; root mean square error of approximation (RMSEA) = .03 to .07; standard root mean square residual (SRMR) = .03 to .05. This measure was not collected in Grade 1 due to concerns about its developmental appropriateness with younger children. To reduce the length of survey administration in Grade 8, this measure was omitted. For the purposes of this study, the moral disengagement data collected in Grade 9 was used in place of the Grade 8 data.
Data analysis plan
The first step in the analysis plan was to identify distinct subgroups (classes) of children who could be characterized as aggressive-victims. Latent profile analysis (LPA) was performed in Mplus (version 8; Muthén & Muthén, Reference Muthén and Muthén1998–Reference Muthén and Muthén2017). Models with varying numbers of classes were specified at each grade level based on the six indicators of physical, verbal, and relational aggression and victimization (with the exception of Grade 1 in which only four available indicators were available). Although physical and verbal aggression tend to be moderately to strongly correlated, it has been standard practice to examine them as distinct indicators within the LPA framework (Bettencourt et al., Reference Bettencourt, Farrell, Liu and Sullivan2013; Giang & Graham, Reference Giang and Graham2008; Williford et al., Reference Williford, Brisson, Bender, Jenson and Forrest-Bank2011). Maximum likelihood estimation with robust standard errors was used, an estimation method that is robust to skewness and nonnormality (Yuan & Bentler, Reference Yuan, Bentler, Sobel and Becker2000).
To determine the optimal number of classes, fit indices including the Bayesian information criterion (BIC), sample-size adjusted BIC (SABIC), Lo–Mendell–Rubin adjusted likelihood ratio test (LMR-aLRT), and entropy were assessed (Collins & Lanza, Reference Collins and Lanza2010; Nylund, Asparouhov, & Muthén, Reference Nylund, Asparouhov and Muthén2007). Models with smaller BIC and SABIC values indicate better fitting solutions. Significant p values on the LMR-aLRT indicate that a model with k classes has better fit to the data than a model with k – 1 classes. Entropy values range from 0 to 1 with values closer to 1 indicating greater classification precision. Finally, the qualitative nature of the classes was assessed to ascertain whether they were conceptually meaningful and interpretable in consideration of extant empirical findings.
The second step consisted of a series of cross-sectional and longitudinal analyses to investigate the individual characteristics (i.e., emotion dysregulation, withdrawn behaviors, moral disengagement, and gender) and relational experiences (i.e., peer rejection and friendships) of aggressive-victims and how these factors were associated with their development over time. Cross-sectional analyses were performed using LPA such that the individual and relational variables were treated as predictors (covariates) of class membership. Within the LPA framework, covariate effects were estimated using multinomial logistic regression and interpreted as odds ratios (OR). All of the covariate effects assessed within each grade level were entered into one model. This approach allowed for an examination of potential cumulative (additive) effects, controlling for the effects of other variables.
Longitudinal analyses were performed using latent transition analysis (LTA). LTA can be conceived as a longitudinal extension to LPA and is a flexible methodology for investigating time-specific classifications of individuals (Collins & Lanza, Reference Collins and Lanza2010). In LTA, transition probabilities are estimated that reflect the likelihood that children make specific transitions between two latent classes over time. Within the LTA framework, measurement invariance was assessed to determine whether the nature of the classes remained similar over time. The individual and relational factors were incorporated in the longitudinal models as moderators to determine whether these factors had differential (i.e., interaction) effects on certain transitional patterns (i.e., increased or decreased the likelihood of certain group transitions over time). These analyses were particularly relevant for identifying the factors associated with patterns of late- (or adolescent-) onset development. In more traditional OLS regression techniques, testing for continuous variable interactions typically requires specifying interaction terms based on the cross-product of two independent variables. Within LTA, moderation effects are specified such that class membership at Time 2 is regressed on each of the hypothesized factors conditional on class membership at Time 1 (see Muthén & Asparouhov, Reference Muthén and Asparouhov2011, for a discussion of this approach). Each moderator variable was assessed independently to reduce model complexity, and estimates and significance tests from these models are reported. To facilitate the interpretation of these estimates, for the statistically significant effects, the LTA Calculator in Mplus was used, which estimates transition probabilities conditional on different levels of a moderating variable. Similar to testing interaction effects in a regression analysis, the transition probabilities were compared at 1 SD above and below the mean of the moderating variable.
Because the introduction of additional variables (covariates or moderators) within an LPA or LTA can impact the nature of classes that are identified and individual class assignments, methodologists have recommended the three-step approach that estimates covariate and moderation effects without having them influence class membership (Lanza, Tan, & Bray, Reference Lanza, Tan and Bray2013; Vermunt, Reference Vermunt2010). Thus, the three-step approach was used to estimate the measurement (i.e., class identification) model separately from the prediction models (see Asparouhov & Muthén, Reference Asparouhov and Muthén2014).
Results
Preliminary analyses
Descriptive statistics and bivariate correlations
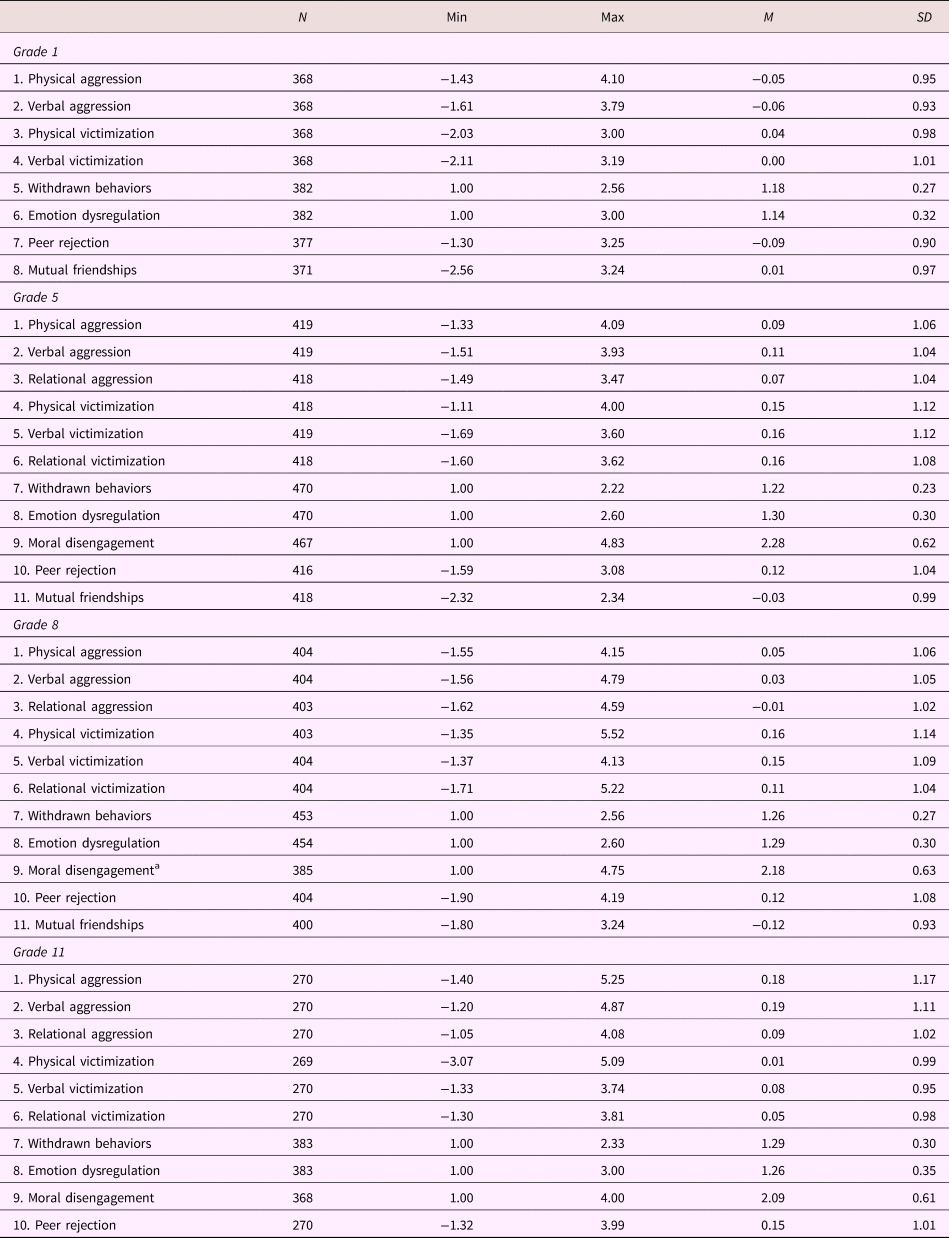
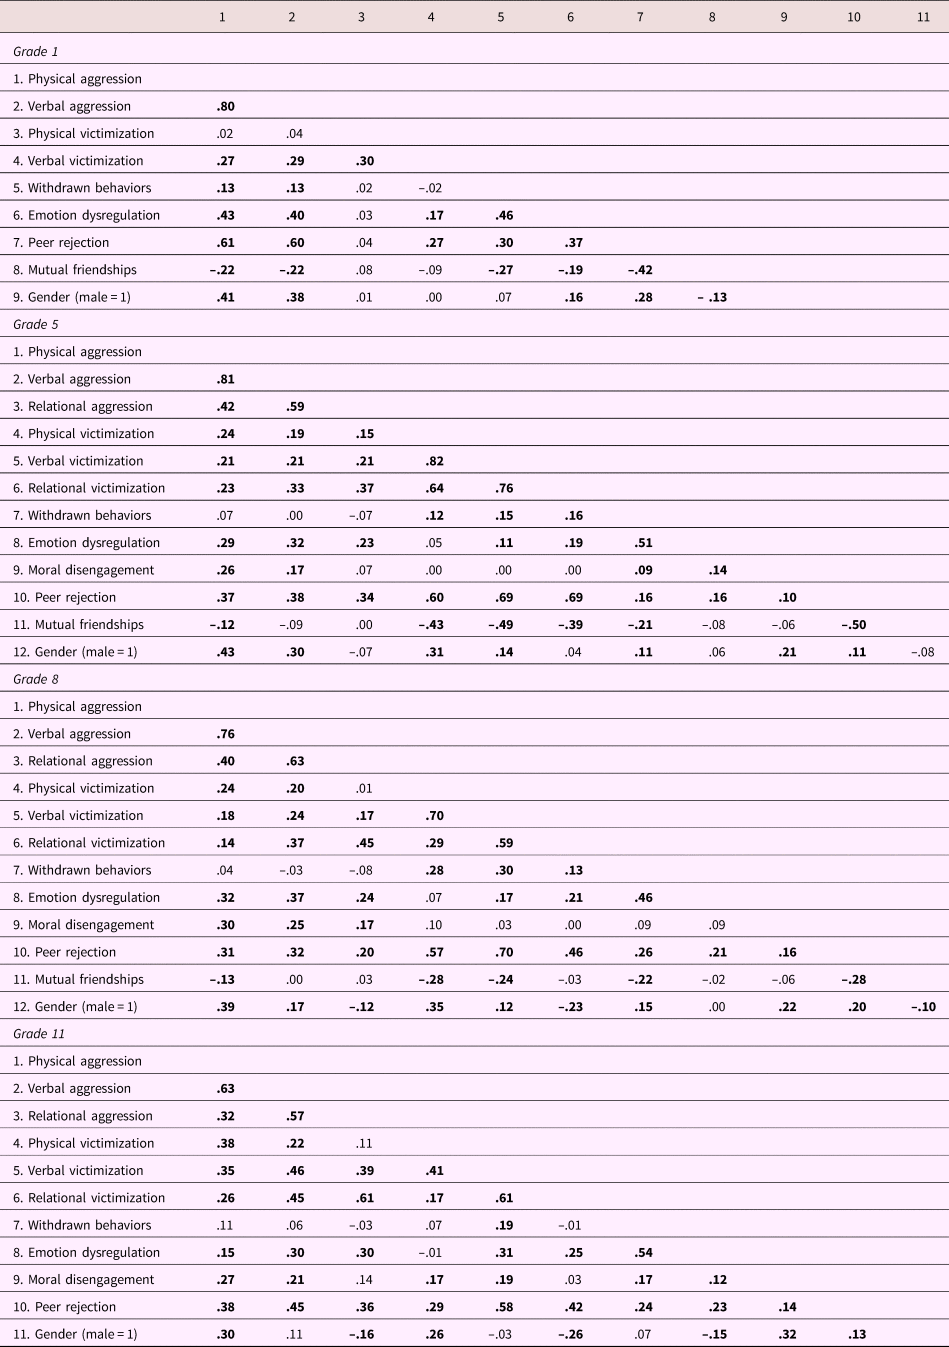
Descriptive statistics (means, standard deviations, and ranges) were estimated for all study variables (Table 1). Because of the large number of repeated measures assessed over time, bivariate correlations are reported by grade level (Table 2). Bivariate correlations indicated that aggression subtypes were moderately to highly correlated with each other, and similar results were found for peer victimization subtypes. Aggression and victimization were also correlated with a few exceptions. Aggression subtypes were positively correlated with emotion dysregulation, peer rejection, and being male. Peer victimization was positively correlated with withdrawn behaviors, being male, and peer rejection, and negatively correlated with friendships.
Descriptive statistics of study variables

aMoral disengagement was collected in Grade 9 but analyzed as part of the Grade 8 data.
Bivariate correlations among study variables by grade level

Note: Values in bold were statistically significant at p < .05.
Missing data analyses
Given the longitudinal nature of this study, participant attrition increased with the passage of time. Missing data analyses indicated that, for all study variables, 20.8% of the data were missing. Because additional participants were added to the longitudinal study in Grade 5, roughly 20% of the missing data in Grade 1 was attributable to this reason. Attrition rates increased with the passage of time, and ranged from 1.9% (n = 9) in Grade 5, 5.6% (n = 27) by Grade 8, and the total attrition by Grade 11 was 17.8% (n = 86).
A series of univariate t tests were performed to assess some of the possible observable causes of missingness and to determine whether the likelihood of having missing data on study variables was associated with children's demographic characteristics (gender, race, or family income). Over time, the likelihood of having missing data on the aggression and peer victimization measures was not associated with race, gender, or family income. There were no significant associations between missing data on the individual and relational factors with these demographic characteristics in Grades 5 and 8. In Grade 11, however, boys and children with lower family incomes had more missing data on withdrawn behaviors, emotion dysregulation, and moral disengagement (t = –3.93 to 3.35, p < .01). Although these differences were statistically significant, the analyses indicated small effect sizes attributable to missing data in Grade 11 (η2 < .03). Considering the higher rates of attrition by Grade 11, additional comparisons were made to see if this attrition was associated with earlier levels of aggression or peer victimization; however, these associations were not statistically significant.
Identification of aggressive-victims
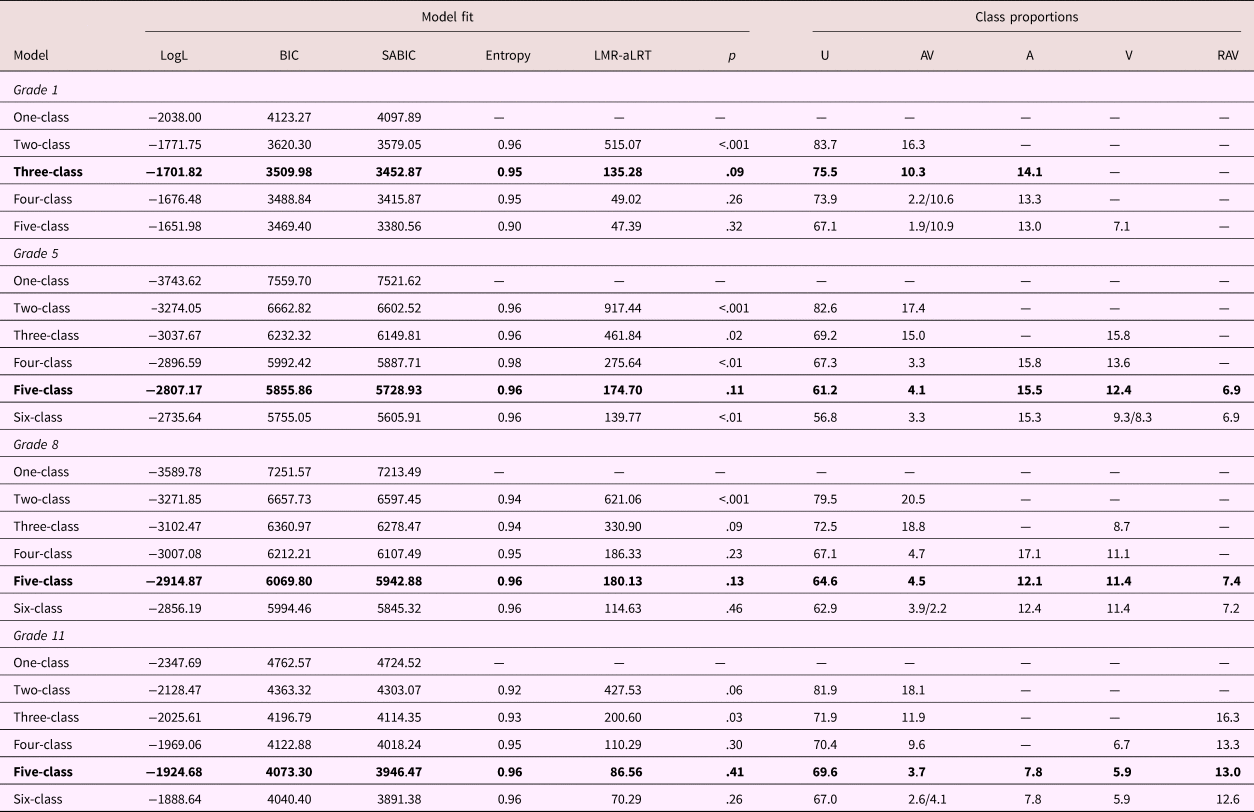
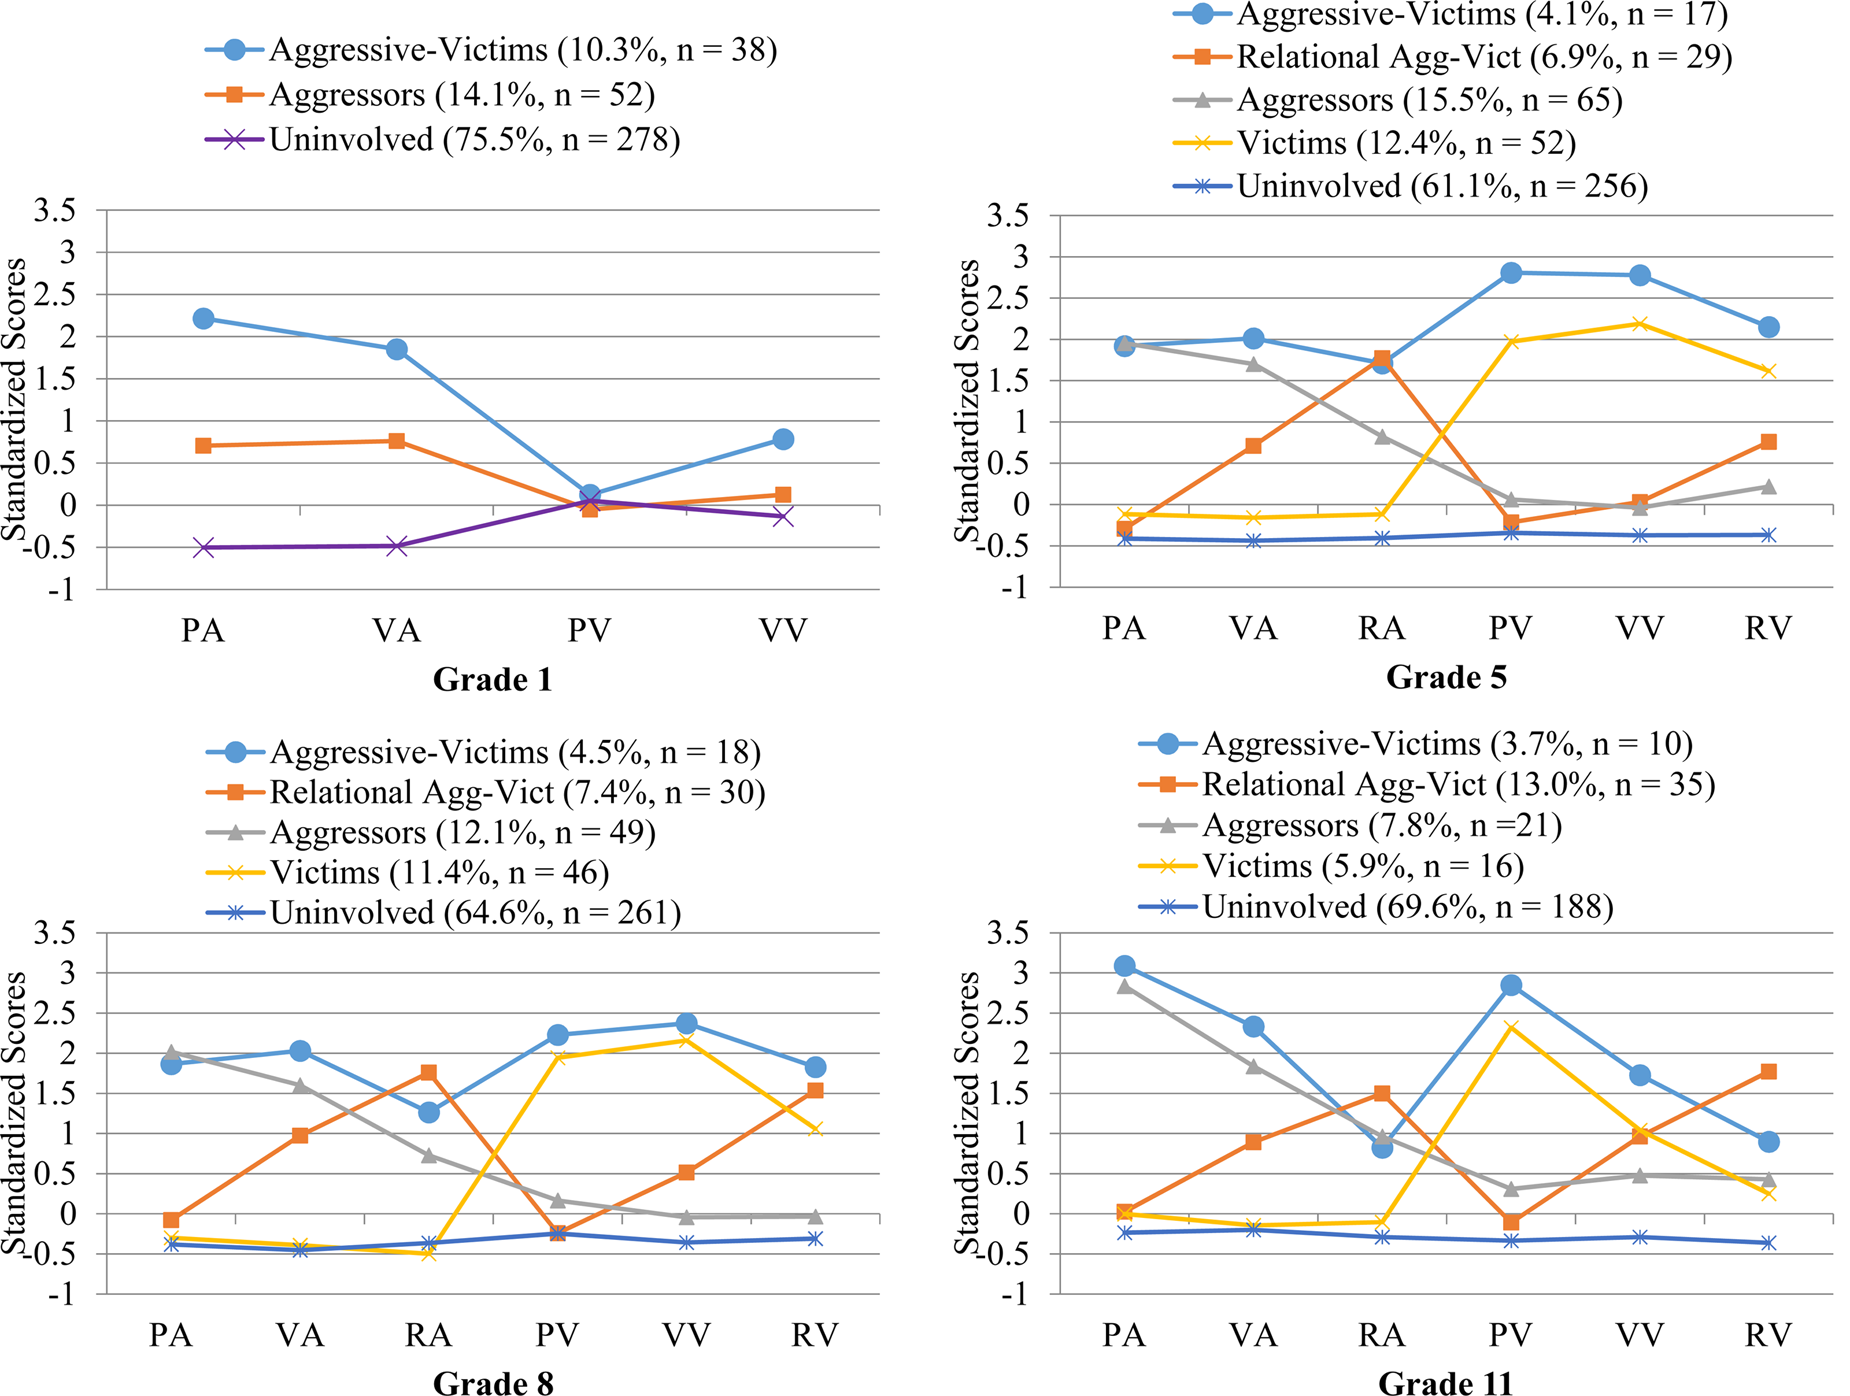
LPA was performed at each grade level using the physical, verbal, and relational peer aggression and victimization indicators in order to identify subgroups of children who could be characterized as aggressive-victims. In Grade 1, although the BIC and SABIC favored models with increasing numbers of classes, it appeared that the relative decrease in these information criteria was smaller for models with three or more classes (see Table 3), and the additional classes in the four- and five-class models appeared to be qualitatively similar and were not conceptually distinct. Although the LMR-aLRT was not statistically significant (for three vs. two classes), because the three-class solution better distinguished an additional qualitatively distinct class and had a lower BIC and SABIC, it was selected as the most parsimonious solution. This model consisted of one class with high aggression and verbal victimization scores (labeled aggressive-victims; 10.3%), a second class with high aggression and low victimization (labeled aggressors; 14.1%), and a third class with low aggression and victimization (labeled uninvolved; 75.5%). See Table 3 for class proportions for each solution.
Model fit indices and class proportions for latent profile analyses in Grades 1, 5, 8, and 11

Note: LogL, loglikelihood. BIC, Bayesian information criteria. SABIC, sample-size adjusted Bayesian information criteria. LMR-aLRT, Lo–Mendell–Rubin adjusted likelihood ratio test. U, uninvolved. AV, aggressive-victim. A, aggressor. V, victim. RAV, relational aggressive-victim. Rows in bold indicate the class solution that was selected. When two class proportions were listed under the same class, it indicated that the model identified two qualitatively similar classes.
In Grades 5, 8, and 11, the results of the LPAs were comparable. With respect to the information criteria (BIC and SABIC), the results consistently indicated that model fit improved as the number of classes increased; however, these indices did not converge on a single solution when examined in combination with the LMR-aLRT (Table 3). With respect to the qualitative nature of classes, the five-class models consistently revealed five distinct and conceptually meaningful classes. However, the additional class included in the six-class models was not qualitatively distinct from other classes. Thus, the five-class models were selected as the most parsimonious solutions, consisting of aggressive-victims, relational aggressive-victims, aggressors, victims, and uninvolved (see Figure 1 for profiles with class-specific means).
Latent profile analysis solutions for Grades 1, 5, 8, and 11 (before imposing measurement invariance). PA, physical aggression. VA, verbal aggression. RA, relational aggression. PV, physical victimization. VV, verbal victimization. RV, relational victimization. Reprinted from Ettekal & Ladd (Reference Ettekal and Ladd2017).

Measurement invariance
Measurement invariance was assessed to determine whether the nature of the classes (i.e., class-specific means) remained similar over time. Because the number and the qualitative nature of the identified classes were similar in Grades 5, 8, and 11, measurement invariance was assessed across these grade levels. Two models were compared to evaluate whether imposing measurement invariance was a reasonable assumption empirically (i.e., it did not substantially impact model fit) in addition to being conceptually justifiable. Model fit indices from a constrained (invariant) model (log-likelihood = –7768.40; BIC = 15905.70, SABIC = 15715.27) were compared to a second unconstrained model in which the latent classes were identified in parallel, but independently of one another, without imposing equality constraints (log-likelihood = –7646.73; BIC = 16031.27, SABIC = 15650.42). In addition to comparing the information criteria of these models, a scaled LRT was performed (LRT = 111.01, Δdf = 60, p < .001). Although the results indicated that the BIC favored the constrained model, and the LRT favored the unconstrained model, the constrained measurement invariance model was selected for several reasons. First, chi-square based nested model tests (e.g., LRT), are sensitive to sample size (Cheung & Rensvold, Reference Cheung and Rensvold2002). Second, from a conceptual standpoint, imposing measurement invariance appeared to be a reasonable determination in order to facilitate the interpretation of the results (i.e., evaluating the effects across qualitatively identical classes).
Associations of the individual and relational factors with aggressive-victim subgroups
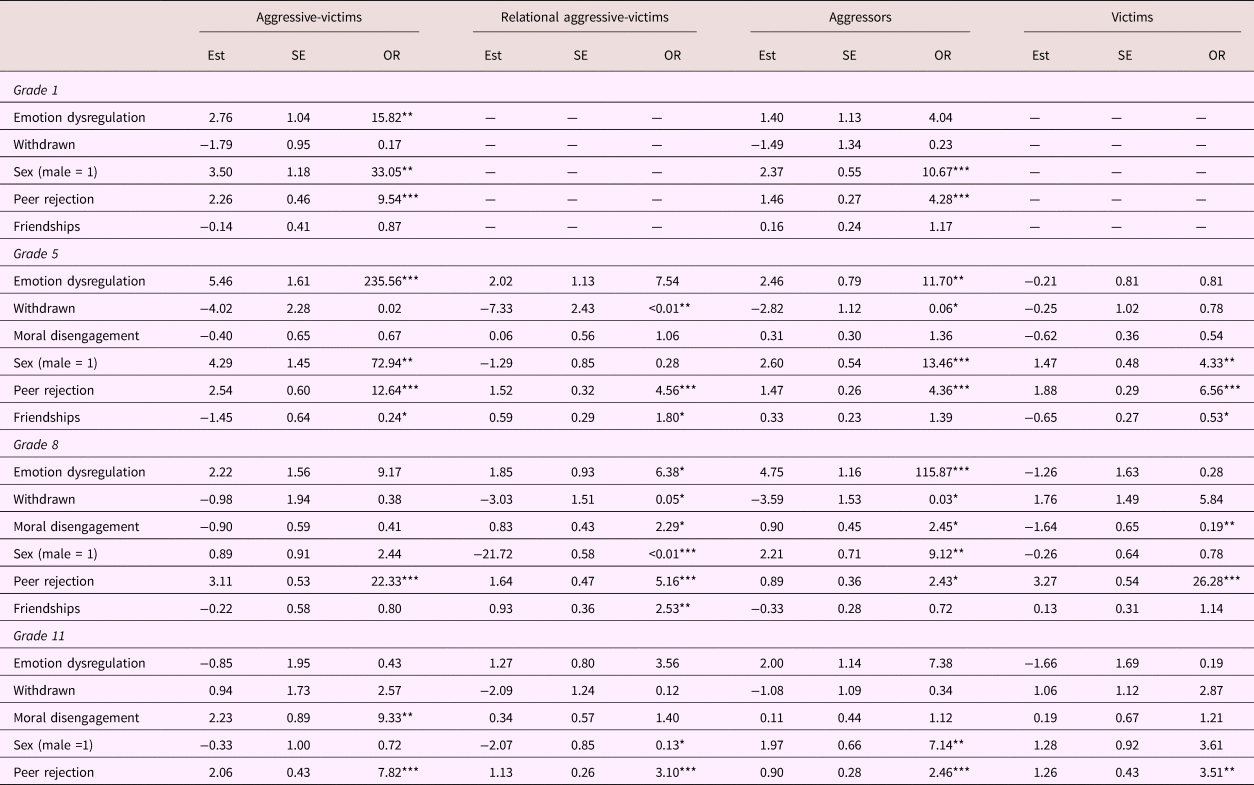
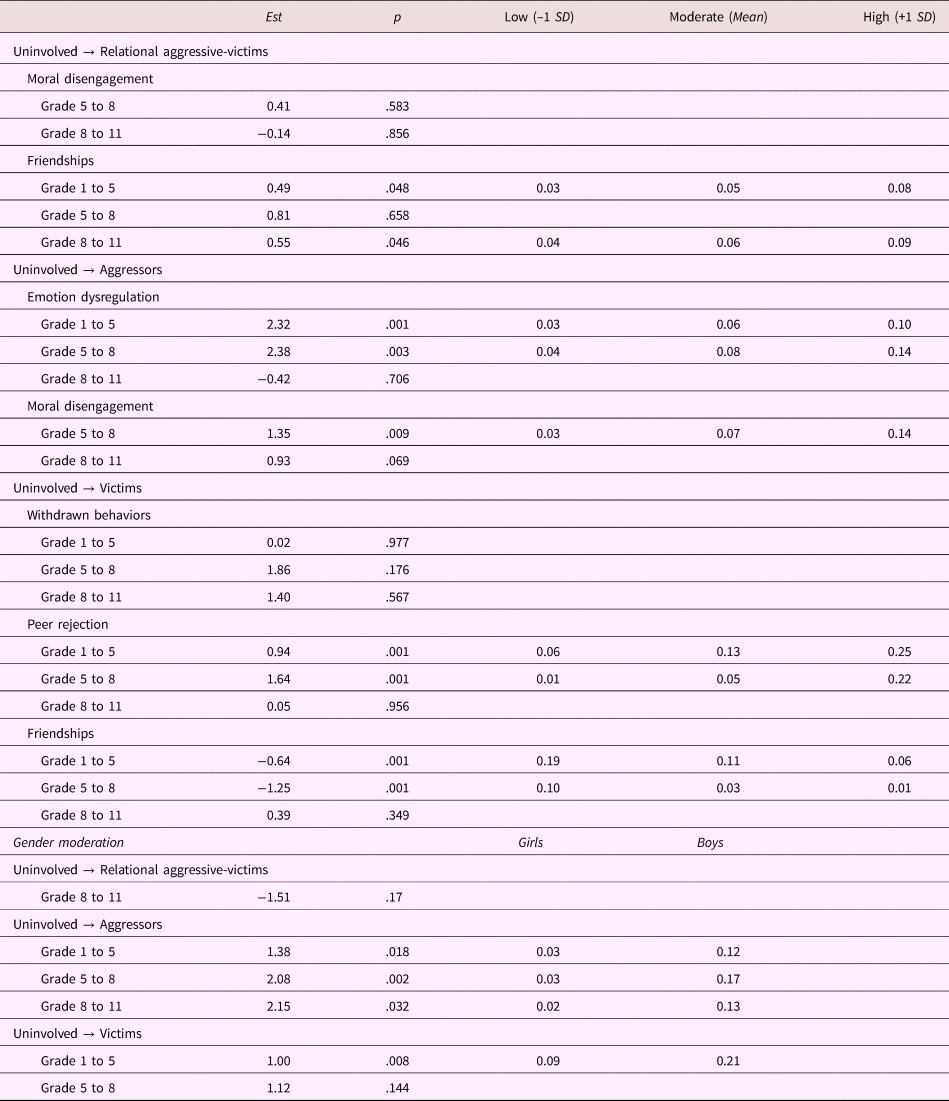
In order to more clearly integrate the findings across the collective set of individual and relational factors, the cross-sectional (LPA) and longitudinal (LTA) analyses are reported by risk group, as opposed to focusing on each of the individual and relational factors separately. ORs and significance tests (p values) comparing each of the risk groups to the uninvolved group (i.e., the reference group) are reported in Table 4, and therefore not reproduced in the text. In cases in which the risk groups were compared with each other, the estimates are reported in the text. Because an examination of each possible pair of group differences would yield an extensive number of comparisons, group comparisons were assessed when warranted by specific hypotheses. Table 5 provides the estimates and significance tests for the longitudinal analyses assessing moderation effects. To facilitate the interpretation of the statistically significant estimates, the conditional transition probabilities are reported at –1 SD below the mean, the mean, and +1 SD above the mean of the moderator variable.
Conditional latent profile analyses examining individual and relational effects in Grade 1, 5, 8, and 11

Note: Analyses are based on using the uninvolved group as the reference group. In Grade 1, the relational aggressive-victim and victim groups were not identified. *p < .05. **p < .01. ***p < .001.
Longitudinal moderation analyses examining late-childhood and adolescent-onset pathways

Note: Longitudinal moderation analyses were performed to assess hypothesized associations. Conditional transition probabilities were estimated for all statistically significant effects (p ≤ .05). For continuous variables, transition probabilities were estimated for 1 SD below the mean, the mean, and 1 SD above the mean of the moderating variable. For gender, transition probabilities were estimated for girls and boys separately.
Aggressive-victims
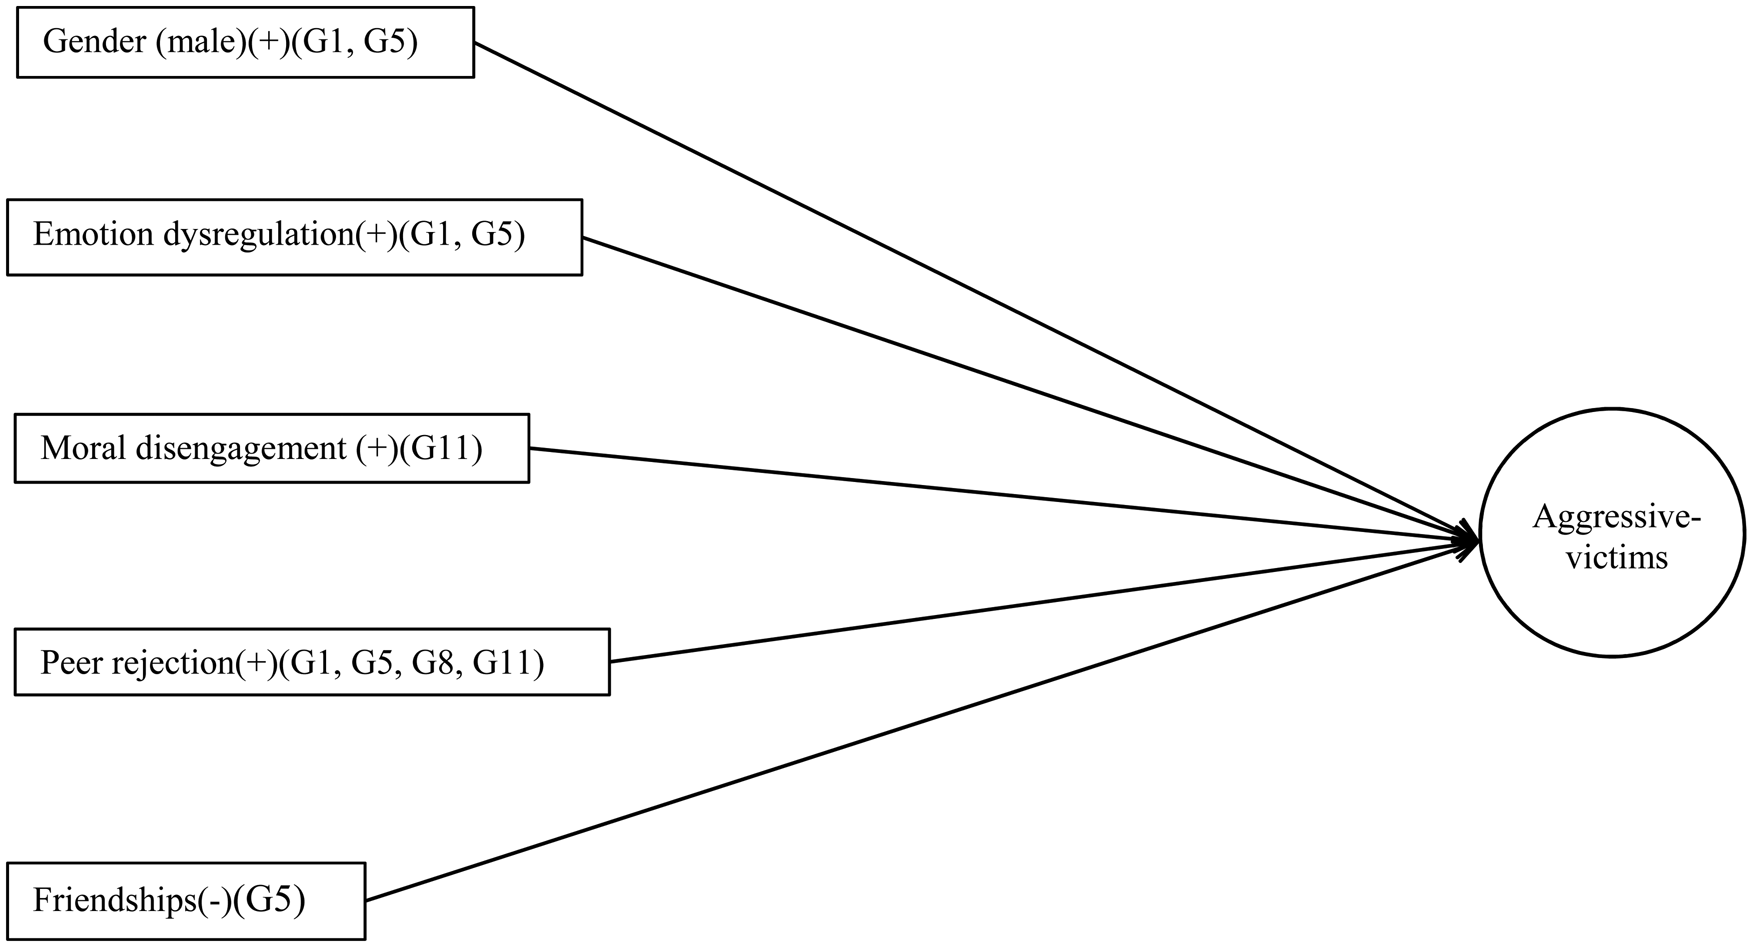
Findings for aggressive-victims indicated they had a unique profile of individual and relational characteristics (Figure 2). Higher levels of emotion dysregulation increased the risks for being an aggressive-victim (compared to the uninvolved group), particularly during the childhood years (see Table 4). It also differentiated aggressive-victims from victims in Grade 5 (OR = 290.62, p < .001) and Grade 8 (OR = 32.43, p = .02), but not from relational aggressive-victims (Grade 5: OR = 31.25, p = .07; Grade 8: OR = 1.44, p = .81; Grade 11: OR = 0.12, p = .31). By late adolescence, moral disengagement increased the chances of being an aggressive-victim compared to the uninvolved group. Peer rejection increased the risk for being an aggressive-victim compared to the uninvolved, relational aggressive-victim (Grade 8: OR = 4.33, p = .02; Grade 11: OR = 2.52, p = .03) and aggressor groups (Grade 8: OR = 9.20, p < .001; Grade 11: OR = 3.18, p = .02), but not compared to victims (Grade 5: OR = 1.93, p = .25; Grade 8: OR = 0.85, p = .66; Grade 11: OR = 2.23, p = .11). By late childhood (Grade 5), having fewer friends also increased the risks for being an aggressive-victim, but it was unexpected that these findings were attenuated in early adolescence (Grade 8). Gender differences indicated that boys were more likely to be aggressive-victims than uninvolved. Because it was highly unlikely for children to transition from being uninvolved to aggressive-victims, it was not possible to investigate late- or adolescent-onset pathways using longitudinal moderation analyses.
The cross-sectional effects for the individual and relational factors for aggressive-victims using the uninvolved group as the referent. Because it was highly unlikely to transition from uninvolved to aggressive-victims, it was not possible to investigate late- (or adolescent-) onset pathways using longitudinal moderation analyses. For this reason, these results are not illustrated here. Grade levels (G) reported next to each variable indicate the time periods these effects were statistically significant at p < .05. Positive (+) and negative (–) associations for each variable are provided, and the corresponding estimates, standard errors, and odds ratios pertaining to these associations are reported in Table 4.

Relational aggressive-victims
Higher levels of emotion dysregulation significantly increased the risks for being a relational aggressive-victim in Grade 8, compared to being uninvolved (Figure 3). Higher levels of moral disengagement significantly increased the risks for being a relational aggressive-victim, compared to being uninvolved, or a victim in Grade 8 (OR = 11.83, p < .001). Lower levels of withdrawn behaviors, greater peer rejection, and having more friendships additively increased the risk for being a relational aggressive-victim than uninvolved. Furthermore, having more friends increased the likelihood of being a relational aggressive-victim compared to being an aggressive-victim in Grade 5 (OR = 7.65, p < .01), and a victim in Grade 5 (OR = 3.43, p < .001) and Grade 8 (OR = 2.21, p = .05). Gender differences indicated that girls were more likely to be relational aggressive-victims.
The cross-sectional and longitudinal moderation effects for the individual and relational factors for relational aggressive-victims. Cross-sectional associations are based on using the uninvolved group as the referent, and longitudinal moderation analyses (i.e., dashed arrows) assessed late-onset pathways to risk (i.e., transitions from uninvolved group to relational aggressive-victims). Grade levels (G) reported next to each variable indicate the time periods these effects were statistically significant at p < .05. Positive (+) and negative (–) associations for each variable are provided. Cross-sectional and longitudinal analyses were performed in separate models, but combined in the figure to facilitate the interpretation of the results. Note that the corresponding estimates, standard errors, and odds ratios pertaining to the cross-sectional associations are reported in Table 4 and the longitudinal estimates are reported in Table 5.

Longitudinal analyses revealed that having more friends also increased the chances of a late-onset pathway to being a relational aggressive-victim (Table 5). Uninvolved children with few friends had a 3%–4% chance of making this transition, and those with many friends had an 8%–9% chance. The associations for moral disengagement were not significant, and the analyses for gender moderation led to estimation problems in the models for Grades 1 to 5 and 5 to 8, and were not significant for Grades 8 to 11.
Associations of the individual and relational factors with aggressors and victims
Although the primary aims of this study revolved around investigating the development of aggressive-victims, additional analyses were performed with the aggressor and victim subgroups. These analyses sought to more clearly discern the extent to which the individual characteristics and relational experiences of aggressive-victims were distinguishable from youth who were primarily aggressors or victims.
Aggressors
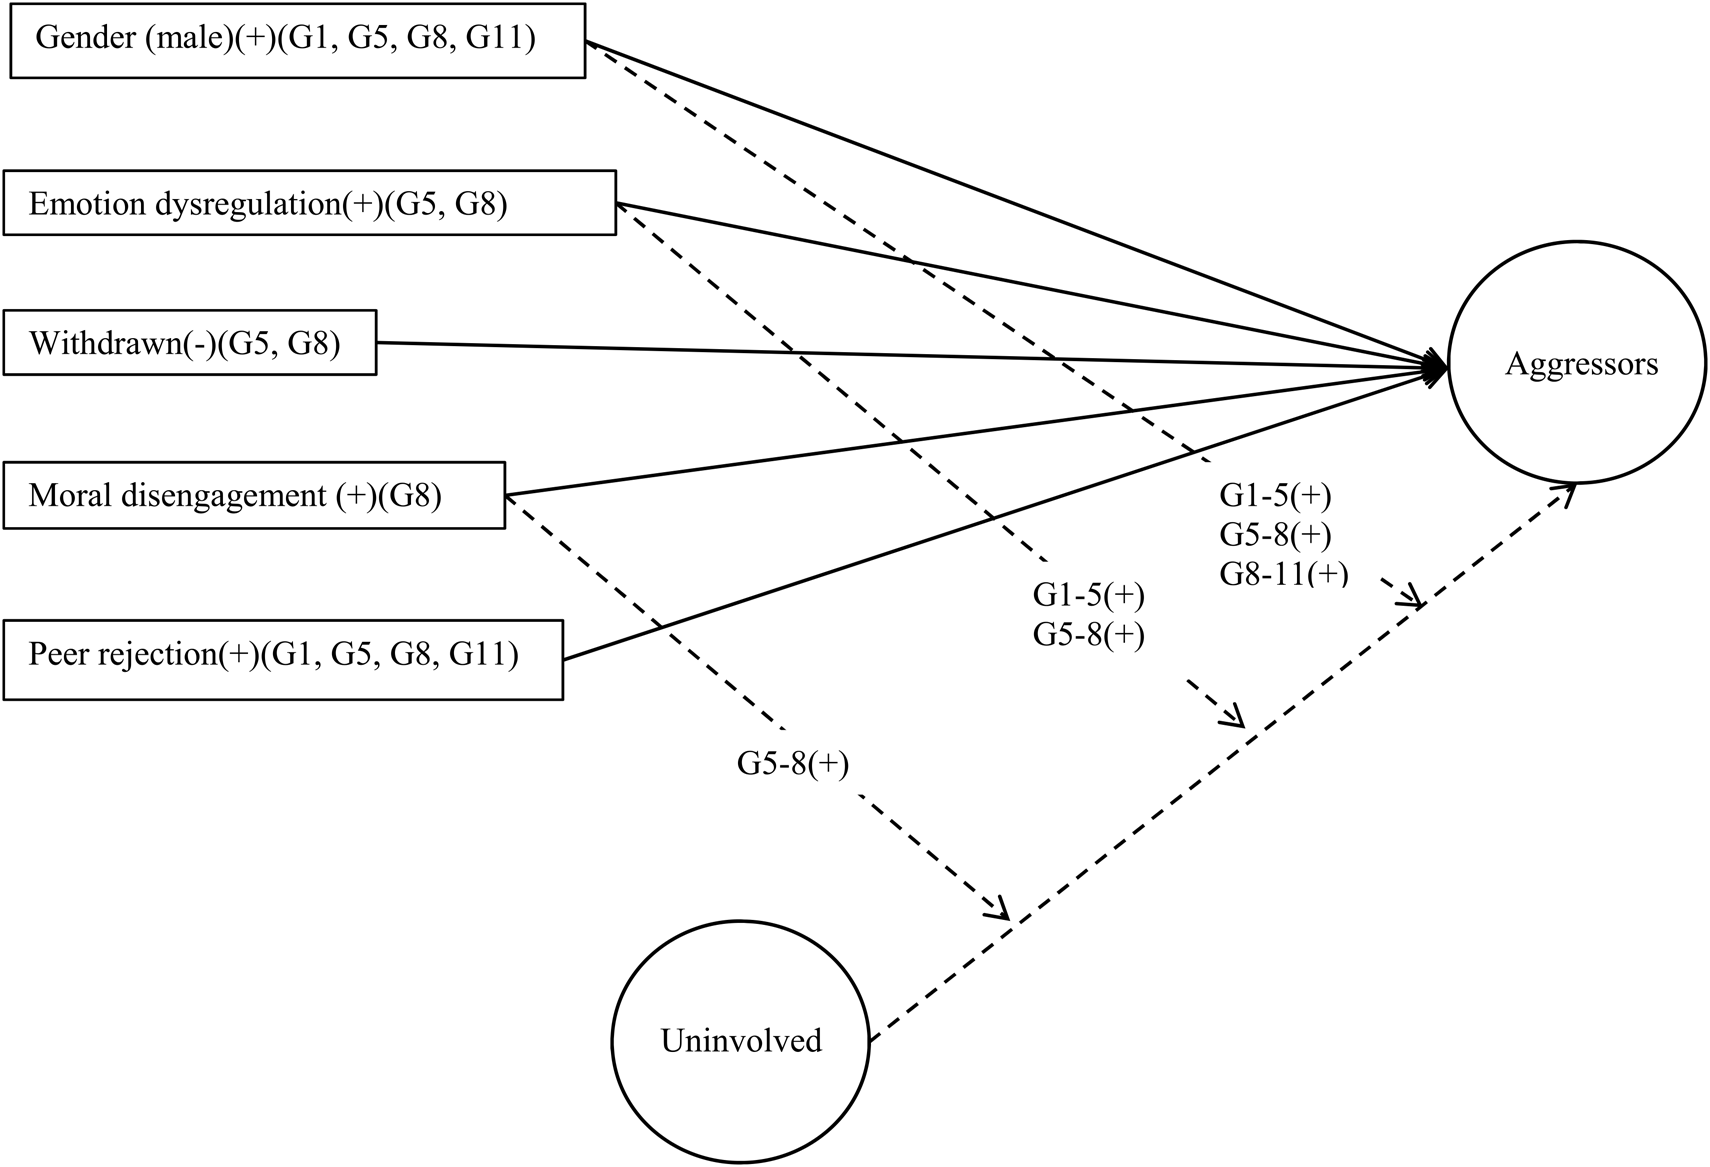
Higher levels of emotion dysregulation increased the risks for being an aggressor (Figure 4), compared to being uninvolved (in Grades 5 and 8), a relational aggressive-victim (in Grade 8: OR = 18.16, p = .03), or a victim from late childhood through adolescence (Grade 5: OR = 14.44, p < .01; Grade 8: OR = 409.53, p < .001; Grade 11: OR = 38.86, p = .05). Moral disengagement increased the chances of being in the aggressor group in early adolescence, compared to the uninvolved group, and compared to the victim group in Grade 5 (OR = 2.52, p = .03) and Grade 8 (OR = 12.64, p < .001). Lower levels of withdrawn behaviors and being male increased the chances of being an aggressor. Finally, peer rejection increased the risk for being an aggressor compared to being uninvolved, associations that persisted through adolescence.
The cross-sectional and longitudinal moderation effects for the individual and relational factors for aggressors. Cross-sectional associations are based on using the uninvolved group as the referent, and longitudinal moderation analyses (i.e., dashed arrows) assessed late-onset pathways to risk (i.e., transitions from uninvolved group to aggressor group). Grade levels (G) reported next to each variable indicate the time periods these effects were statistically significant at p < .05. Positive (+) and negative (–) associations for each variable are provided. Cross-sectional and longitudinal analyses were performed in separate models, but combined in the figure to facilitate the interpretation of the results. Note that the corresponding estimates, standard errors, and odds ratios pertaining to the cross-sectional associations are reported in Table 4 and the longitudinal estimates are reported in Table 5.

The longitudinal analyses indicated that uninvolved children with lower levels of emotion dysregulation had a 3%–4% chance of transitioning into aggressors, and those with higher levels had a 10%–14% chance. Similarly, uninvolved children with lower moral disengagement had a 3% chance of transitioning into aggressors, and those with higher levels had a 14% chance. Consistently across time, uninvolved boys exhibited higher rates of late-onset aggression (about 12%–17%) compared to girls (2%–3%).
Victims
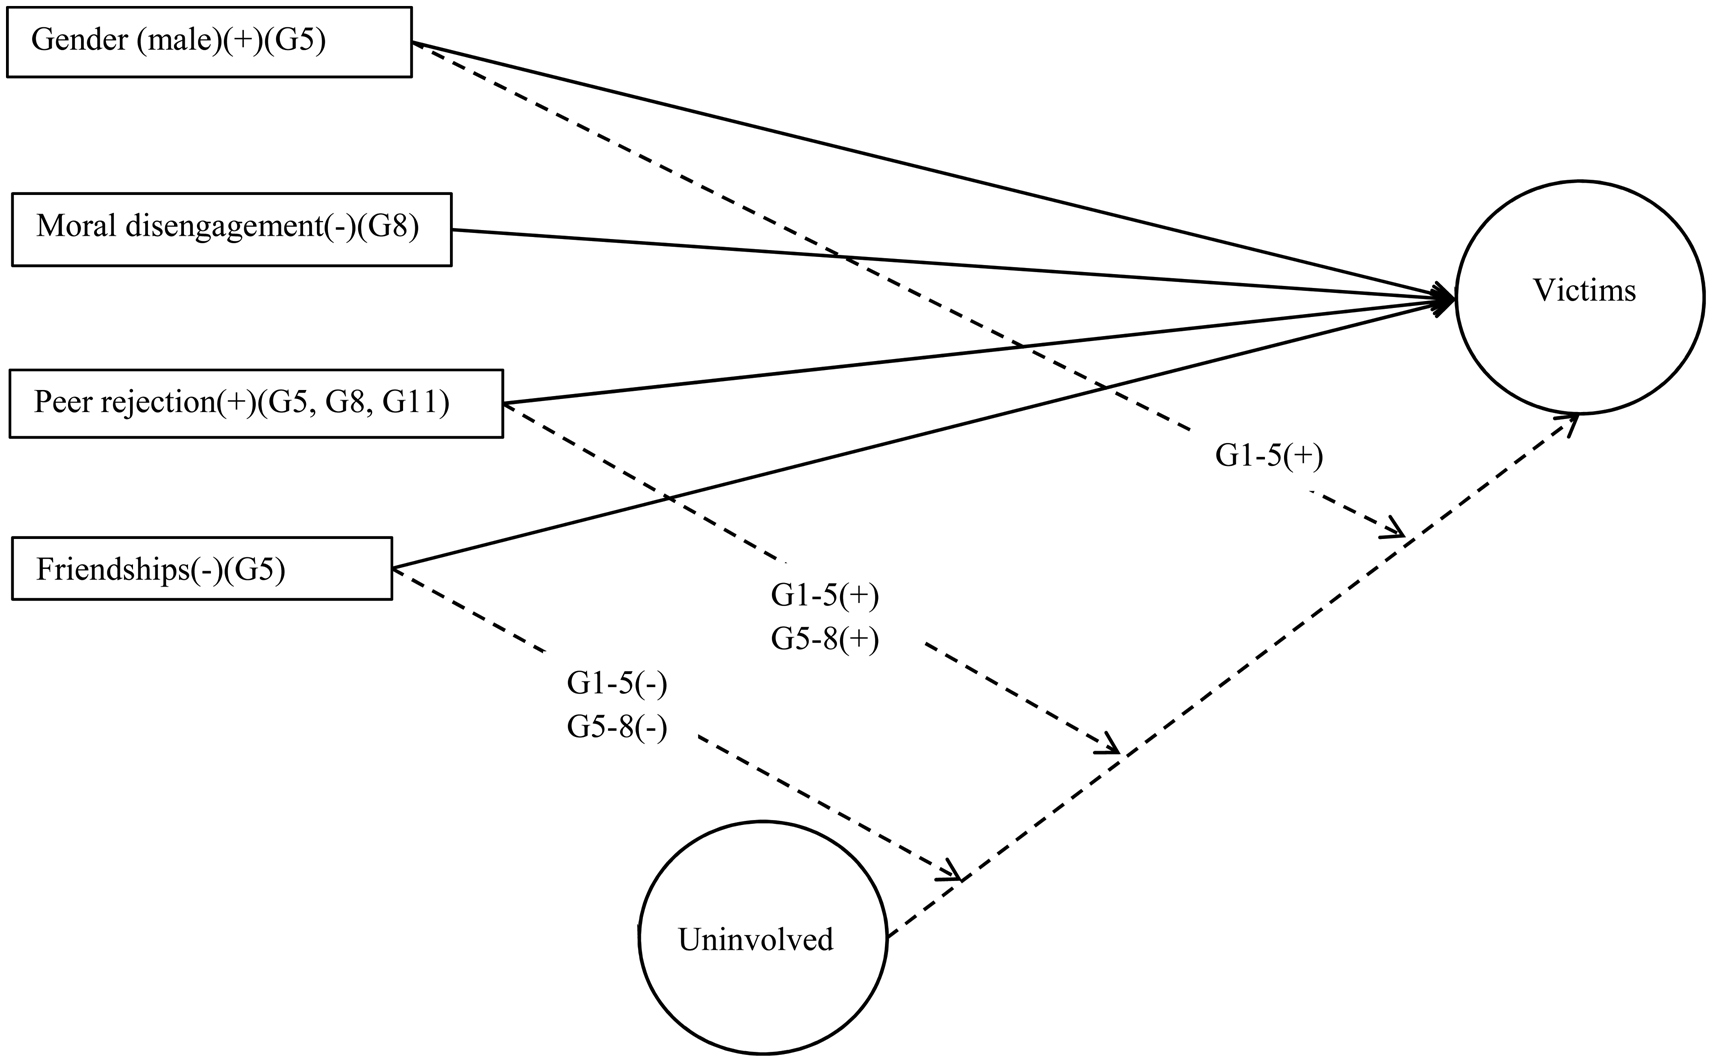
The results for victims indicated that they more consistently exhibited greater relational risks than individual risks (Figure 5). Contrary to expectations, higher levels of withdrawn behaviors were not associated with a significantly higher risk of being a victim compared to being uninvolved. However, it increased the risks for being a victim compared to being a relational aggressive-victim (Grade 5: OR = 1187.97, p < .01; Grade 8: OR = 120.66, p = .02; Grade 11: OR = 23.20, p = .05) and aggressor (Grade 5: OR = 13.05, p = .03; Grade 8: OR = 212.09, p < .01). Peer rejection and fewer friendships in late childhood also increased the risk for being a victim, compared to being uninvolved. Gender differences indicated that boys were more likely to be in the victim group in late childhood.
The cross-sectional and longitudinal moderation effects for the individual and relational factors for victims. Cross-sectional associations are based on using the uninvolved group as the referent, and longitudinal moderation analyses (i.e., dashed arrows) assessed late-onset pathways to risk (i.e., transitions from uninvolved group to the victim group). Grade levels (G) reported next to each variable indicate the time periods these effects were statistically significant at p < .05. Positive (+) and negative (–) associations for each variable are provided. Cross-sectional and longitudinal analyses were performed in separate models, but combined in the figure to facilitate the interpretation of the results. Note that the corresponding estimates, standard errors, and odds ratios pertaining to the cross-sectional associations are reported in Table 4 and the longitudinal estimates are reported in Table 5.

The longitudinal analyses did not reveal a significant association between withdrawn behaviors and a late-onset pathway to victimization. However, greater peer rejection and fewer friendships increased the risks for late-onset victimization. Compared to those with lower peer rejection (1%–6%), those with greater rejection had a significantly higher chance (22%–25%) of transitioning to victims. Furthermore, in contrast to uninvolved children with many friends (1%–6%), having fewer friends significantly increased the likelihood (10%–19%) of transitioning to victims. Gender differences indicated that boys were more likely to exhibit a late-childhood onset pathway to victimization (21%) compared to girls (9%).
Discussion
Findings from this study make four important contributions to current knowledge about the development of aggressive-victims during childhood and adolescence. First, the findings provide a more complete descriptive account of the development of aggressive-victims over a longer developmental period (from middle childhood through late adolescence) than previously studied. Second, although many of the associations reported for the individual and relational factors corroborated existing findings, it has been rare to assess their cumulative effects (controlling for other factors) over multiple developmental periods. Third, this study identified and analyzed a form-specific subgroup of relational aggressive-victims not studied extensively in prior studies (e.g., see findings reported by Bettencourt et al., Reference Bettencourt, Farrell, Liu and Sullivan2013; Giang & Graham, Reference Giang and Graham2008; Williford et al., Reference Williford, Brisson, Bender, Jenson and Forrest-Bank2011). Fourth, in light of the developmental heterogeneity of the identified risk groups, this study provided unique insights into the individual and relational processes associated with patterns of continuity and change. More specifically, late-childhood and adolescent-onset pathways were assessed in which children who were initially uninvolved in aggression and victimization transitioned into one of the identified risk groups over time.
Findings for the investigated individual and relational factors both corroborate and shed new light on the ways in which aggressive-victims and relational aggressive-victims differ from each other and from aggressors and victims. Aggressive-victims appeared to share many similar social–emotional and social–cognitive characteristics as aggressors. These findings are consistent with a shared processes hypothesis (see van Dijk, Poorthuis, & Malti, Reference van Dijk, Poorthuis and Malti2017), according to which aggressive-victims and aggressors have similar psychological profiles. However, it appeared that the distinction between these aggressive subgroups emerged more clearly with respect to their peer relationships such that aggressive-victims also exhibited comparable relational risks as victims. Thus, they faced a combination of individual and relational risks that likely contribute to why they are typically the most at risk for other forms of social and psychological maladjustment. Extant research on relational aggressive-victims, as a distinct group, has been rare. However, the findings indicated that there may be some important qualitative differences between this group and aggressive-victims. Compared to aggressive-victims who have been characterized as ineffectual aggressors, the higher rates of friendships and lower rates of withdrawn behaviors and peer rejection among relational aggressive-victims suggest that children in this group (disproportionately girls) may be using relational aggression in more functional and effective ways to attain their social goals and enhance their social positions.
Individual factors
Emotion dysregulation
As hypothesized, emotion dysregulation was a pervasive individual risk factor associated with membership in the three identified aggressive groups. Taken together, these findings elucidate how emotion dysregulation (anger, irritability, and emotionally reactivity, in particular) functions as a precursor to multiple forms of aggression, and that once children started to engage in aggression, their emotion dysregulation persisted. Emotion regulation has been theorized as a multidimensional construct that is both an essential component of children's social–emotional development more broadly, and coincides with normative declines in aggression (Eisenberg et al., Reference Eisenberg, Spinrad and Eggum2010; Yates et al., Reference Yates, Obradović and Egeland2010). Normatively, as emotion regulation is enhanced, aggressive behaviors tend to decline. Conversely, among children with higher levels of dysregulation across childhood and adolescence, there appeared to be a persistent pattern of aggressive behavior, and a normative decline was not exhibited.
More specifically, the findings implicated distinct mechanisms by which emotion dysregulation co-occurred with the aggressive-victim subgroups, as well as some developmental variations. Among aggressive-victims, emotion dysregulation co-occurred with early-onset aggression, and these associations attenuated to some degree in adolescence. Although emotion dysregulation also increased the risks for being a relational aggressive-victim in early adolescence, they were significantly less dysregulated than aggressors, but not aggressive-victims. Considering these group differences in combination with the gender effects suggests that emotion dysregulation co-occurs with different manifestations of aggression in males and females. That is, a pattern emerged that indicated an association between being male, higher emotion dysregulation, and engaging in multiple forms of aggression (i.e., membership in the aggressor and aggressive-victim groups). In contrast, a second pattern was characterized by being female, higher emotion dysregulation, and engaging in relational aggression.
In addition to its associations with aggressive-victims, the findings for aggressors and victims provided additional insights pertaining to the role of emotion dysregulation. First, the results for aggressors implicated a late-onset pathway, such that emotion dysregulation increased the chances that uninvolved children became aggressors, both during the transition to late childhood and to late adolescence. Second, risk group differences among the aggressive risk groups with victims were more pronounced. Perhaps one of the primary social–emotional determinants of whether children are likely to be aggressive- or nonaggressive-victims is whether they exhibit difficulties in regulating their anger and irritability (Schwartz, Reference Schwartz2000). Experiencing victimization is likely to elicit a strong emotional response. Consistent with reformulated social information processing perspectives, which theorize that emotion processes organize and motivate children's social cognitions and their subsequent behavioral responses (Lemerise & Arsenio, Reference Lemerise and Arsenio2000), how emotionally overreactive children are in response to peer provocations is likely to influence whether they act aggressively or not.
However, it may also be important to consider how low emotional reactivity may further differentiate heterogeneous developmental pathways and subgroups of aggressive children. For instance, low emotional reactively, indicative of callous-unemotional traits, also increases children's aggression (Frick & White, Reference Frick and White2008). In the current study, because it was not possible to investigate callous-unemotional traits, it remains unclear whether any of the aggressive risk groups exhibited this profile. On the one hand, that aggressors had persistently high levels of emotion dysregulation indicates that this group would likely not be characterized as callous-unemotional. On the other hand, the nonsignificant associations between emotion dysregulation and aggressive-victims in adolescence could reflect a heterogeneous group, one in which some children were characterized by emotion dysregulation and others by callous-unemotional traits.
Withdrawn behaviors
Findings pertaining to children's withdrawn behaviors helped to further differentiate the aggressive-victim subgroups. In contrast to the findings for aggressive-victims, which indicated nonsignificant associations with withdrawn behaviors, the findings for relational aggressive-victims revealed that this subgroup was highly unlikely to be withdrawn. These findings corroborate the premise that relational aggressive-victims are motivated by reputational social goals, and engaging in behaviors such as social exclusion to enhance their social standing, thus unlikely to display withdrawn behaviors with peers.
Conversely, because nonaggressive-victims have typically been characterized as passive and submissive (Schwartz, Reference Schwartz2000; Schwartz et al., Reference Schwartz, Dodge and Coie1993), it was unexpected that this group did not exhibit higher rates of withdrawn behaviors. Considering that these analyses controlled for co-occurring effects, one possible explanation is that the associations between withdrawn behaviors and victimization would have been more pronounced had peer rejection not been included in the same model. Such an interpretation is consistent with process models, which postulate that peer rejection functions as a mediating mechanism linking withdrawn behaviors and peer victimization (Boivin & Hymel, Reference Boivin and Hymel1997; Buhs, Ladd, & Herald, Reference Buhs, Ladd and Herald2006). Although it was not possible to explicitly test a mediation model in the current study, the strong associations between peer rejection and the victim group may have attenuated the effects of withdrawn behaviors. Alternatively, these nonsignificant associations may reflect a potential methodological limitation. The items used in the CBCL and TRF tap a broad range of withdrawn behaviors with distinct underlying motivations. However, research on social withdrawal has increasingly focused on its distinct motivations and subtypes (e.g., social anxiety and avoidance, shyness, preference for solitude, and unsociability), some of which are more consistently associated with peer victimization than others (see Coplan, Ooi, Xiao, & Rose-Krasnor, Reference Coplan, Ooi, Xiao and Rose-Krasnor2018; Coplan et al., Reference Coplan, Rose-Krasnor, Weeks, Kingsbury, Kingsbury and Bullock2013; Ladd, Ettekal, & Kochenderfer-Ladd, Reference Ladd, Ettekal and Kochenderfer-Ladd2018). Thus, the measure used in the current study may have obfuscated the associations between specific subtypes of withdrawn behaviors and being a victim.
Moral disengagement
The significant associations between moral disengagement and being a relational aggressive-victim support the premise that moral disengagement is associated with distinct forms of aggression. Across the three aggressive risk groups, the cross-sectional findings implied that moral disengagement had a more pervasive influence in adolescence, and the longitudinal analyses indicated that moral disengagement also functioned as a precursor to adolescent-onset aggression among children who were initially uninvolved in aggression.
Considering the findings on moral disengagement in combination with emotion dysregulation may provide additional insights into the individual characteristics and continuity of the aggressive risk groups from childhood through adolescence. Theoretical frameworks on moral development suggest that it is intricately tied to children's emotion processing and empathy (Eisenberg, Reference Eisenberg2000; Hyde, Shaw, & Moilanen, Reference Hyde, Shaw and Moilanen2010). Reformulations of the social information processing framework postulate that both emotion and moral processing are likely to contribute to adolescent aggression (Arsenio & Lemerise, Reference Arsenio and Lemerise2004). Consistent with these perspectives, the findings indicated that the combination of these emotion and moral processing factors were additively associated with membership in the three aggressive risk groups in childhood and adolescence, as well as adolescent-onset pathways.
Relational factors
Peer rejection
Taken together, the findings on peer rejection provided several insights pertaining to the development of aggressive-victims. Although higher levels of peer rejection increased the likelihood of being in all four of the risk groups, these attitudes were the most pervasive among aggressive-victims. From a developmental perspective, it continued to have a persistent association with the aggressive subgroups from middle childhood through adolescence. Moreover, the longitudinal analyses supported the premise that peer rejection exacerbates children's risks for victimization (Buhs et al., Reference Buhs, Ladd and Herald2006; Cillessen & Lansu, Reference Cillessen and Lansu2015), and among children who were initially uninvolved, it was associated with late childhood and adolescent-onset pathways to the victim group.
Collectively, the pervasive influence of peer rejection in combination with the individual characteristics of each subgroup elucidates the social–interactional processes by which individual-level and relational processes cumulatively function to differentiate each of the identified risk groups. Among aggressive-victims and aggressors, their individual characteristics were fairly comparable, consisting of a profile of high emotion dysregulation and moral disengagement. However, aggressive-victims also experienced a more stressful relational environment such that they had the highest rates of peer rejection and fewer friendships, in combination with being victimized. This combination of individual and relational risks likely exacerbated their aggressive behavioral styles and continuities in victimization over time. Developmental theories highlight the essential role of socialization processes in contributing to normative declines in aggression (Patterson, DeBaryshe, & Ramsey, Reference Patterson, DeBaryshe and Ramsey1989; Tremblay, Reference Tremblay2010). Among children who were aggressive, experiencing peer rejection (for aggressors) and victimization (for aggressive-victims) likely created a social context in which they were deprived of more normative prosocial socialization experiences, and their aggressive behaviors and maladaptive social–emotional and social–cognitive processing were exacerbated.
Friendships
The findings on children's friendships appeared to further differentiate aggressive-victims and relational aggressive-victims. Although having more friends increased the likelihood of being a relational aggressive-victim, having fewer friends was associated with aggressive-victims and victims in late childhood. Moreover, the longitudinal analyses revealed that uninvolved children who had more friends were at increased risk for late childhood- and adolescent-onset pathways to the relational aggressive-victim group. Those who had fewer friends had an increased risk for late-onset pathways to the victim group.
On the one hand, the findings for victims support the premise that having more friends is a protective factor for peer victimization (Hodges et al., Reference Hodges, Boivin, Vitaro and Bukowski1999), particularly children's exposure to multiple forms of victimization. On the other hand, the results for relational aggressive-victims suggest that other mechanisms may be operative. For youth in this group, having more friends co-occurred with greater relational victimization and peer rejection, a pattern indicative of having a controversial social status in which there appeared to be social costs and benefits associated with membership in this subgroup (Ettekal & Ladd, Reference Ettekal and Ladd2015). Moreover, it is possible that their higher rates of friendships not only offset some of the negative effects of peer rejection and relational victimization but also positively reinforced their motivations for maintaining a relationally aggressive behavioral style. To further assess some of the potential social costs and benefits of relational aggressive-victims, one direction for future research would be to examine other aspects of their relational experiences such as their friendship quality (e.g., support or intimacy) or whether they affiliate with deviant peers (Bettencourt & Farrell, Reference Bettencourt and Farrell2013).
Implications for intervention
Taken together, the findings have several implications for intervention efforts aimed to reduce peer-directed aggression and victimization, and provide insights pertaining to the timing of such efforts, their scope and focus, and evaluation designs. With respect to their timing, in light of findings that demonstrated early-onset patterns of aggression and peer victimization, intervention efforts that begin earlier in development may be appropriate to disrupt developmental continuity over time. Furthermore, in order to target children at risk for late- and adolescent-onset pathways, intervention efforts need to be sustained into adolescence. However, considering some of the developmental differences found, and potential age-varying differences in program effectiveness (Yeager, Fong, Lee, & Espelage, Reference Yeager, Fong, Lee and Espelage2015), intervention efforts may need to modify their content and delivery methods when targeting adolescent samples.
With respect to their scope, the findings imply a need for combining universal and more selected intervention strategies. In light of findings that demonstrated that aggressive-victims and aggressors exhibited persistent individual and relational risks, these children may benefit the most from targeted (i.e., selected) interventions that enhance their emotion regulation, empathy, and social skills. However, considering that uninvolved children were at risk for late-onset pathways, universal prevention efforts may be more effective in fostering children's social–emotional, social–cognitive, and interpersonal assets to reduce subsequent risks. Consistent with this viewpoint, there are several existing programs (e.g., see Ansary, Elias, Greene, & Green, Reference Ansary, Elias, Greene and Green2015) that have shown promising results by integrating a combination of these approaches. These programs share several common features, including the utilization of whole-school based approaches to create a more supportive school climate that enhances children's relational supports, while working with students to promote their social, emotional, and cognitive skills.
However, one-size-fits-all approaches may not work for all at-risk children (e.g., relational aggressive-victims had many friends, and were not at risk in similar ways as other aggressive-victims). Evaluation designs would benefit from assessing intervention effects across distinct risk groups (e.g., Yang & Salmivalli, Reference Yang and Salmivalli2015). Toward this end, Farrell, Henry, and Bettencourt (Reference Farrell, Henry and Bettencourt2013) have recommended using person-centered methods (such as latent class analysis) within intervention evaluations to more specifically assess subgroup differences in program effects.
Limitations and future directions
There were several limitations with respect to the measurement of focal constructs. First, because relational aggression and victimization were not assessed at Grade 1, the differences in subgroup identification during this wave could have been the result of measurement differences. Second, it was not possible to further investigate the different functions of aggression (e.g., proactive or reactive aggression). Thus, functional distinctions among the subgroups may not have clearly emerged. Considering that proactive and reactive aggression tend to co-occur, it is plausible that the aggressive-victim subgroups were engaging in a combination of these functions. Nonetheless, future studies should continue to disentangle the forms and functions of aggression among the risk subgroups. Third, although the emotion dysregulation subscales had adequate reliability and have been used by other researchers (Olson et al., Reference Olson, Sameroff, Lansford, Sexton, Davis-Kean, Bates and Dodge2013), in light of advances in the measurement of this construct, its validity requires further investigation. Some items appeared to have poor face validity (e.g., “jealous behavior”), and the use of a subset of items from the CBCL and the TRF to differentiate emotion dysregulation from more general problem behaviors requires additional scrutiny. Fourth, as previously noted, the withdrawn behaviors subscales of the CBCL and the TRF assess a broad range of behaviors that do not differentiate its specific subtypes or underlying motivations. Thus, additional research examining the associations between aggressive-victims and different subtypes of withdrawn behaviors may provide additional insights. Fifth and finally, a measure of Grade 9 moral disengagement was used to maintain the same set of indicators over time. Although moral disengagement appears to exhibit moderate stability over time (Paciello et al., Reference Paciello, Fida, Tramontano, Lupinetti and Caprara2008), the timing of this measure raises questions about whether it could serve as a valid proxy for Grade 8 moral disengagement.
There were also several analytic limitations. Although one of the strengths of this study was the investigation of late- or adolescent-onset pathways (i.e., transitions from the uninvolved group to a risk group over time), it was not possible to further investigate if the individual and relational factors moderated pathways to desistance over time (i.e., transitions from the aggressive-victim groups to the uninvolved group). Because the risks groups tended to be relatively smaller in size (compared to the uninvolved group), the number of children who exhibited desistance pathways was insufficient to systematically assess these pathways. Thus, replication studies in large-scale longitudinal samples would allow for greater statistical power to assess group transitions that had low likelihoods or consisted of a small proportion of children.
Conclusions
Collectively, the findings of this study contribute to ongoing research on the development of aggressive-victims in childhood and adolescence. For the most part, the findings demonstrated that children who were either perpetrators (aggressors) or victims of peer aggression, or both (aggressive-victims), engaged in multiple forms of these behaviors (physical, verbal, and relational). However, there was one exception, a subgroup of mostly girls that was more form specific and characterized as relational aggressive-victims. Across the risk groups, intraindividual continuity was demonstrated as many children maintained the same group status over time. Developmental change was also observed as many children transitioned between different groups over time and exhibited pathways that could be characterized as late- or adolescent-onset pathways. Pathways of continuity and change were significantly associated with children's individual characteristics (i.e., emotion dysregulation and moral disengagement) and their relational experiences (i.e., peer rejection and friendships), and several developmental differences emerged across childhood and adolescence. This heterogeneity in the development of aggressive-victims was attributable to multiple child-and-environment transactional processes co-occurring across childhood and adolescence.
Funding Statement
This investigation was conducted as part of the Pathways Project, a larger longitudinal investigation of children's social/psychological/scholastic adjustment in school contexts that is supported by the National Institutes of Health Grants RO1MH-49223, RO1MH-49223, and R01HD-045906 (to G.W.L.).
Author ORCIDs
Idean Ettekal, 0000-0003-3306-9330
Acknowledgments
Portions of this article are based on a dissertation submitted by Idean Ettekal to Arizona State University while under the advisement of Gary Ladd. The authors thank committee members Larry Dumka, Justin Jager, Karen Kochel, and Becky Kochenderfer-Ladd for their valuable feedback and contributions. Special appreciation is expressed to all the children and parents who made this study possible, and to members of the Pathways Project for assistance with data collection.