INTRODUCTION
Toxoplasmosis is a worldwide zoonosis caused by the ubiquitous parasite, Toxoplasma gondii. Due to the various possible transmission routes of this protozoan, the management and prevention of human infections requires a fine understanding of the dynamics of its life cycle (Gilot-Fromont et al. Reference Gilot-Fromont, Lélu, Dardé, Richomme, Aubert, Afonso, Mercier, Gotteland, Villena and Djurkovic-Djakovic2012). Felids (domestic cats and their relatives) are the only known definitive hosts for the parasite T. gondii. Cats shed unsporulated oocysts in their feces and, once in the environment, oocysts become sporulated and infectious to new hosts. These oocysts constitute both a significant source of infection for humans (Boyer et al. Reference Boyer, Hill, Mui, Wroblewski, Karrison, Dubey, Sautter, Noble, Withers, Swisher, Heydemann, Hosten, Babiarz, Lee, Meier and McLeod2011) and the main route of infection for intermediate hosts (all warm-blooded animals) (Dubey and Beattie, Reference Dubey and Beattie1988). The risk of contamination for intermediate hosts and humans by T. gondii remains difficult to assess as it depends on both the frequency and spatial distribution of oocysts. It is notably unclear how infection risk varies spatially at a local scale and whether there are specific foci of contamination within, or near, inhabited areas where domestic cats are more abundant.
Rodents, being major prey of felids, are considered to play a key role as intermediate hosts in the maintenance of the T. gondii life cycle (Dubey et al. Reference Dubey, Weigel, Siegel, Thulliez, Kitron, Mitchell, Mannelli, Mateuspinilla, Shen, Kwok and Todd1995; Hejlicek et al. Reference Hejlicek, Literak and Nezval1997). For this reason, rodents as generally considered as relevant markers to assess environmental contamination by toxoplasmosis and other pathogens and to estimate the risk of infection for definitive hosts (Afonso et al. Reference Afonso, Poulle, Lemoine, Villena, Aubert and Gilot-Fromont2007a ; Reperant et al. Reference Reperant, Hegglin, Tanner, Fischer and Deplazes2009; Antoniou et al. Reference Antoniou, Psaroulaki, Toumazos, Mazeris, Ioannou, Papaprodromou, Georgiou, Hristofi, Patsias, Loucaides, Moschandreas, Tsatsaris and Tselentis2010).
Before considering toxoplasmosis in rodents as a meaningful indicator to predict environmental contamination by T. gondii, it is important to account for potential biological and ecological differences within and between species. For instance, a positive relationship between rodent body mass and their probability to be seropositive for T. gondii has been found both within species (due to age) (Reperant et al. Reference Reperant, Hegglin, Tanner, Fischer and Deplazes2009) and between species (larger species having a longer life span) (Afonso et al. Reference Afonso, Thulliez, Pontier and Gilot-Fromont2007b ; Dabritz et al. Reference Dabritz, Miller, Gardner, Packham, Atwill and Conrad2008). Species-specific ecological requirements have also been found to influence T. gondii prevalence, due to variation in oocyst–rodent contact patterns (Ruiz and Frenkel, Reference Ruiz and Frenkel1980; de Thoisy et al. Reference De Thoisy, Demar, Aznar and Carme2003). For example, fossorial species that live in burrows (such as Arvicola terrestris scherman) are always in contact with soil and eat paratenic hosts of T. gondii (such as earthworms); they are therefore thought to be more at risk than other vole species such as Microtus species (Afonso et al. Reference Afonso, Thulliez, Pontier and Gilot-Fromont2007b ). In addition to biological and ecological species-level features, the local environment around captured individuals may also influence their probability of infection. In rural areas, T. gondii prevalence in mammals and birds is particularly high around farms (Smith et al. Reference Smith, Zimmerman, Patton, Beran and Hill1992; Dubey et al. Reference Dubey, Weigel, Siegel, Thulliez, Kitron, Mitchell, Mannelli, Mateuspinilla, Shen, Kwok and Todd1995; Weigel et al. Reference Weigel, Dubey, Siegel, Kitron, Mannelli, Mitchell, Mateuspinilla, Thulliez, Shen, Kwok and Todd1995; Meerburg et al. Reference Meerburg, De Craeye, Dierick and Kijlstra2012). Lehmann et al. (Reference Lehmann, Graham, Dahl, Sreekumar, Launer, Corn, Gamble and Dubey2003) found the probability of infection of intermediate hosts (rodents and birds) to be lower at distances further away from pig farms. However, no study has combined an analysis of species-level factors (biology and ecology) with individual-level characteristics (mass and local environment of the captured individual).
This study was designed to examine the effects of these factors. We conducted a serological survey of the local rodent community in two sites in a rural area of Eastern France. Each site corresponded to a village with farms, residential houses, peripheral fields and forests. We expected to capture rodents with different ecological requirements: commensal species (rats), fossorial meadow species (field voles and water voles) and forest species (bank voles, yellow-necked and wood mice). Based on previous findings, we expected the prevalence of T. gondii antibodies in rodents to vary between species according to specific ecological requirements, individual biology (mass) and the local environment of each individual (distance to the nearest farm and habitat).
MATERIALS AND METHODS
Study areas and sampling
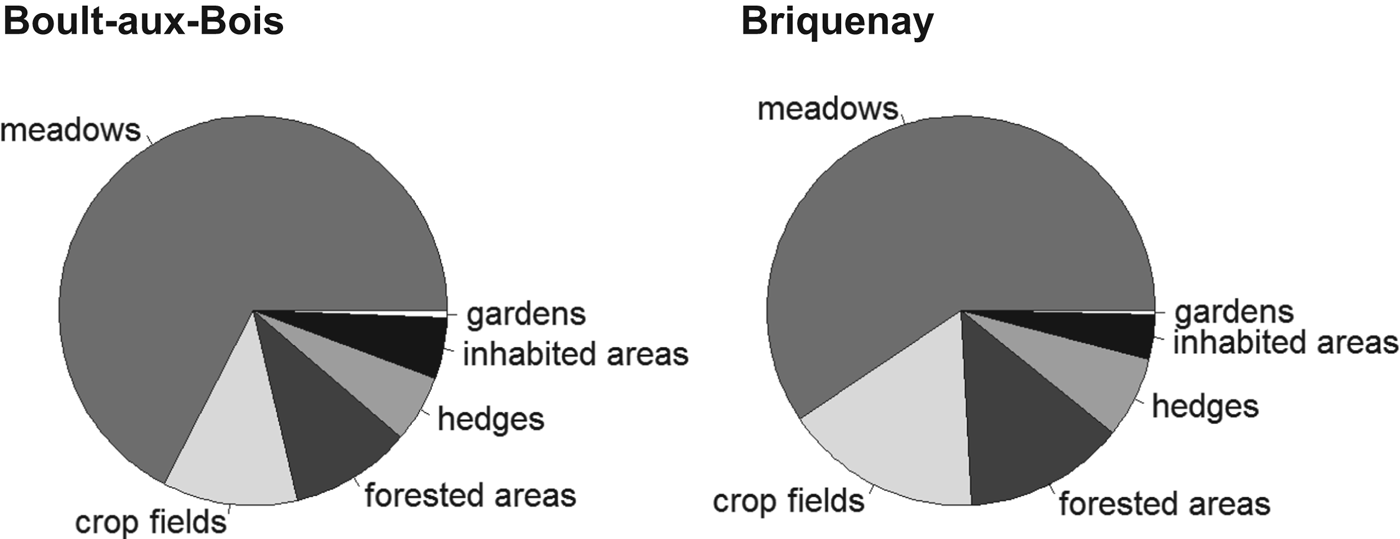
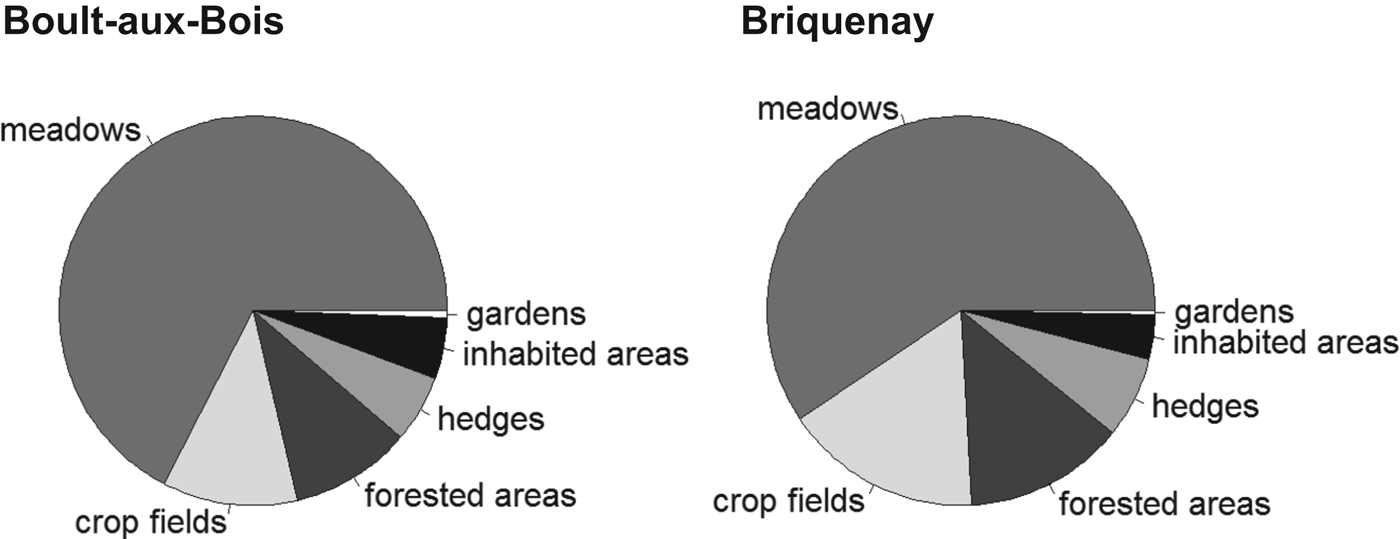
The study was carried out at two sites located in the French Ardennes (North-Eastern France): Boult-aux-bois (49°25′52″N, 4°50′33″E) and Briquenay (49°24′19″N, 4°52′41″E). Each 1·5×1·5 km site was centred on a village; the two village centres were 3·2 km apart. We used aerial views processed in the software QGIS (v. 1.8.0 http://www.qgis.org/) and direct visual assessments to classify the land cover according to the following categories: meadows, crop fields, forests, hedgerows, vegetable gardens and inhabited areas (Fig. 1). The study areas showed equivalent proportions of the different habitat categories: 59–67% meadows, 11–17% crop fields, 10–13% forests, 5–7% hedges, 3–5% inhabited habitats and less than 1% vegetable gardens (Fig. 2). We considered the two study sites as sampling replicates.
Distribution of T. gondii antibody (seropositive (white circles) and seronegative (white stars)) in samples taken from rodents in two villages of the French Ardennes. The map shows the localization of inhabited areas (black), gardens (white), meadows (grey), crop fields (white-hatched), hedges (fine black hatched) and forested areas (black double-hatched). Farm buildings are identified by white crosses.

Distribution of the proportion of each habitat within Boult-aux-bois (left) and Briquenay (right).
Two 10-day trapping sessions were carried out in October 2010 and October 2011. Live traps were set up in the different rodent habitats within each site: hedgerows and forests (for forest species), meadows, pastures and gardens (for fossorial species) and inhabited areas such as areas within and around buildings or along streams running through villages (for commensal species). Trapping efforts were designed to catch at least 30 individuals per species at each site during each field session. Between 19 and 23 lines of live traps were used to catch wood mice and yellow-necked mice, field voles and bank voles during each session. Lines were set up for at least three nights and checked once a day. Sherman traps, placed within galleries under earth mounds, were used to trap the fossorial water vole. Rat traps were mainly used in the villages and around farm buildings. These two types of traps were checked every 2–4 hours or in some case left overnight. All traps were set at a minimum spacing of five metres to target distinct colonies. We recorded the geographical coordinates of each individual trapped using a global positioning system (GPS).
Rodents were euthanased by isoflurane inhalation, weighed, sexed and dissected. Blood samples collected from the clot or heart were centrifuged and the serum separated. Sera were stored in microtubes at −20 °C until analysis. Hearts were placed in sterile plastic collectors containing a suspension of 0·9% (w:v) saline with antibiotics added (120 000 U L−1 penicillin-G and 120 mg L−1 streptomycin). Species that could not be easily identified using morphological criteria (Apodemus species, Microtus species and Myodes glareolus) were discriminated using a DNA barcoding approach (Galan et al. Reference Galan, Pagès and Cosson2012) and specific primer test (Michaux et al. Reference Michaux, Kinet, Filippucci, Libois, Besnard and Catzeflis2001).
We used individual GPS coordinates to compute the distance to the nearest farm building containing either domestic animals or food that may attract rodents and hunting cats (Fig. 1).
Serological and parasitological data
Sera were tested for the presence of T. gondii antibodies using a modified agglutination test (MAT) for the detection of T. gondii-specific IgG antibodies (Dubey and Desmonts, Reference Dubey and Desmonts1987). The antigen was prepared at the Laboratoire de Parasitologie-Mycologie, EA 3800, Reims. Sera were diluted two-fold, starting at 1:3 dilution. Hearts of all seropositive rodents, and of a few seronegative animals, were used for individual bioassays in mice to confirm T. gondii infection (Villena et al. Reference Villena, Aubert, Gomis, Ferte, Inglard, Denis-Bisiaux, Dondon, Pisano, Ortis and Pinon2004). Hearts were mixed with a 0·25% trypsin suspension (1 h 30 at 37 °C), the mixture filtered through gauze and centrifuged. Supernatant was suspended in saline solution containing penicillin G, streptomycin and amoxicillin. This solution was injected into the peritoneum of two mice. Mice were tested for seroconversion with the MAT test 4 weeks postinoculation (pi) and euthanased at 60 days pi. Tissue cysts in brains of seropositive mice were detected by microscopic examination. Brain cysts from seropositive mice were isolated by Percoll gradient centrifugation and DNA was extracted using a QIAamp DNA minikit (Qiagen, Courtaboeuf, France). Real-time quantitative PCR (iQ5 instrument, BIORAD) were conducted to detect T. gondii DNA by targeting a specific sequence of 529 bp (Reischl et al. Reference Reischl, Bretagne, Kruger, Ernault and Costa2003; Lélu et al. Reference Lélu, Gilot-Fromont, Aubert, Richaume, Afonso, Dupuis, Gotteland, Marnef, Poulle, Dumetre, Thulliez, Dardé and Villena2011). All laboratory procedures were performed at the Laboratoire de Parasitologie-Mycologie, EA 3800, Reims.
Statistical analyses
We expected a low number of infected rodents and a high number of variables and modalities that could be considered as explanatory variables of seroprevalence (eight species and six different habitats). We therefore chose not to test the relationships between serology results and all possible variables to minimize the risk of spurious correlations. We then described the dataset to (i) assess which variables were correlated (using correlated variables to explain serology may further lead to confusion) and (ii) identify the factors (variables and modalities) that were most strongly associated with serological status. We used a mixed multivariate descriptive analysis combining quantitative and qualitative variables (Hill and Smith, Reference Hill and Smith1976) which included: species (eight modalities, hereafter called SPECIES), sex (SEX), individual body mass normalized by species and used as a proxy for age (MASS), habitat (six categories: meadows, crop fields, forests, hedges, vegetable gardens and inhabited areas; HABITAT), year (2010 or 2011; YEAR), site (Boult-aux-bois or Briquenay; SITE) and distance to the nearest farm in metres (DISTANCE). This analysis highlighted variables that were correlated and factors (variables and modalities) that were associated with T. gondii serological status. We then carried out a discriminant analysis to identify which of these variables and modalities mostly strongly correlated with serological status. The multivariate descriptive analysis was performed in order to limit the probability to find association of serostatus with several correlated factors, and thus to limit type 1 errors. It was done with the R package (ade4; Chessel et al. Reference Chessel, Dufour and Thioulouse2004).
We performed a logistic regression to analyse the potential explanatory variables of T. gondii seroprevalence. Species (here transformed as a dichotomous variable, commensal vs non-commensal following the Hill and Smith analysis; thereafter called SPECIES2), habitat (transformed as village vs other habitats; HABITAT2), DISTANCE, SEX, MASS, YEAR and SITE were considered. We used an information-theoretic approach for the model selection procedure. We defined a priori candidate models and used the corrected Akaike criterion (AICc) to identify the most likely model (Burnham and Anderson, Reference Burnham and Anderson2002; Hobbs and Hilborn, Reference Hobbs and Hilborn2006). Model averaging was performed using R package (MuMIN; Bartoń, Reference Bartoń2009) for models with ΔAICc<2. Akaike weights (wi) were used to obtain robust estimates of model parameters (Welch and MacMahon, Reference Welch and MacMahon2005; Hobbs and Hilborn, Reference Hobbs and Hilborn2006; Burnham et al. Reference Burnham, Anderson and Huyvaert2011). A priori candidate models included between one and three potentially explanatory variables, as well as the interaction between distance and species. This interaction seemed important, as these variables were strongly associated in the Hill and Smith analysis. We therefore checked that the impact of distance on T. gondii was the same for commensal rats and for other species. All statistical analyses were performed using R software (R Development Core Team, 2012).
RESULTS
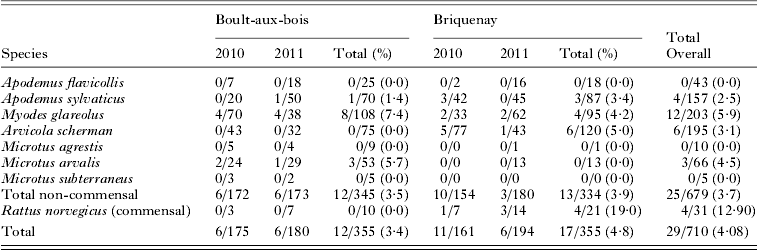
We trapped 710 rodents from eight species. This included forest species (M. glareolus ; n = 203 and Apodemus sp. ; n = 200), meadow species (A. terrestris scherman; n = 195 and Microtus sp.; n = 81) and one commensal species (Rattus norvegicus; n = 31) (Table 1). Despite a significant trapping effort in the villages, we did not capture any domestic mice (Mus musculus domesticus). The spatial location of all individuals trapped is shown in Fig. 1.
Presence of T. gondii antibodies in rodents trapped in Ardennes, France. The number of positive individuals/total number of individuals trapped are given for each species and year

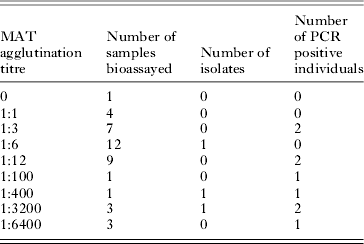
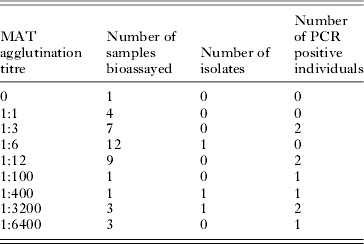
Toxoplasma gondii antibodies were found in 29 of the 710 (4·1%, 95% IC: [2·8; 5·8]) rodents trapped, with titres ranging between 1:6 and 1:6400 (Table 2). We performed bioassays and PCR on 41 individuals (including 12 rodents which were seronegative or had a titre lower than 1:6); isolation was successful in 3 animals with titres of 1:6, 1:400 and 1:3200. Samples taken from 9 individuals, whose titres ranged from 1:3 to 1:6400, gave positive PCR results (Table 2). As T. gondii was isolated from 1 individual with titre 1:6, we used this titre as the threshold for the analysis of serological results. Two individuals with serological titres of 1:3 gave positive PCR results and negative inoculation results but, considering inoculation as the gold standard, we retained the titre threshold f 1:6. We checked that using 1:6 or 1:3 as the threshold value did not change the results of the model selection procedure or the estimates of the final odds ratios.
Results of T. gondii isolation and PCR from rodents captured in both sites
The Hill and Smith analysis was performed on 697 individuals (no MASS and SEX information available for 13 rodents). Two main axes were identified (Fig. 3). The first axis accounted for 12·77% of the total variation and indicated that R. norvegicus presence was positively associated with inhabited areas and vegetable gardens but negatively associated with the distance to the nearest farm. This result was expected since rat traps were set in the surroundings of inhabited and farm areas. The second axis accounted for 11·93% of the variation. This axis highlighted differences between voles trapped in meadows and forest species, reflecting the specific ecology of different wild rodent species.
Factorial map of the Hill and Smith factorial analysis: first (x-axis) and second (y-axis).

Our discriminant analysis revealed three main variables that were strongly related with rodent T. gondii serological status: distance to the nearest farm (correlation between variable and canonical score: −0·65), species (R. norvegicus, r = 0·58) and habitat (inhabited areas, r = 0·49). Based on these results, we converted the variables SPECIES and HABITATS into dichotomous variables. We considered R. norvegicus vs non-commensal species (SPECIES2), and habitats located within the village vs others (HABITAT2).
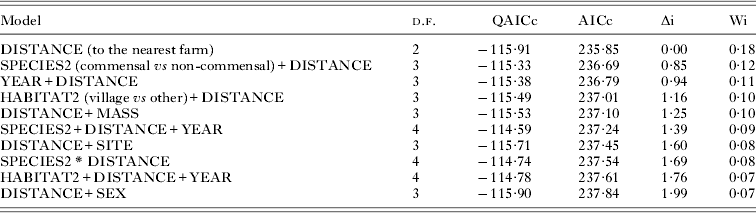
We adjusted all models that included three or less of the potential explanatory variables (DISTANCE, SPECIES2, HABITAT2, SEX, SITE, YEAR, MASS and the interaction SPECIES2 * DISTANCE). Models with ΔAICc<2 included the following variables with decreasing relative importance: DISTANCE, SPECIES2, YEAR, HABITAT2, MASS, SITE, interaction SPECIES2 * DISTANCE and SEX (Table 3). The most highly supported model included the effect of distance only (wi = 0·18). This variable was present in all models with ΔAICc<2 (Table 4). Parameter estimation confirmed that only the effect of DISTANCE was significant (OR = 0·75, 95% IC: 0·60–0·94, Fig. 4, Table 4). As rats, the most prevalent, were only trapped near farms we checked whether the effect of distance was significant when considering other species only. We thus repeated the analysis without rats (data not shown). The best likely model again included the effect of distance only, with the risk for a rodent to be positive decreasing significantly by 0·75 every 100 m (95% IC: 0·62–0·97). From model parameters, the predicted seroprevalence at distance = 0 (i.e. beside a farm building) was 1/(1+exp(−(−2·33))) = 0·089.
Proportion of positive rodents observed within each distance class of 100 m with 95% confidence interval calculated following Clopper and Pearson (Reference Clopper and Pearson1934). The probability to be seropositive for rodents, as predicted by the best model, is represented as a function of distance to the nearest farm (black line).

Model selection results using Akaike information criterion. Each row represents a candidate model to explain T. gondii seroprevalence in rodents as a function of potential explanatory variables. For each model tested, the table indicates the number of degrees of freedom (d.f.), corrected quantitative AICc (QAICc) and corrected AIC (AICc). The model with the minimum AICc (denoted AICmin) was considered as the best model to explain the data; all others models were evaluated based on the difference from this minimum (Δi = AICi−AICmin). All these models have an ΔAIC<2. The Akaike weight (Wi) represents the relative likelihood for a given model to be the best among all other models. Akaike weight values which range from 0 to 1 can be interpreted as the probability for a model i to be the best model given the data and the numerous repetitions of the model selection exercise. The best model selected using this procedure is indicated in bold

DISCUSSION
Several studies have described the level of T. gondii infection in rodents (reviewed in Afonso et al. Reference Afonso, Thulliez, Pontier and Gilot-Fromont2007b ; Dabritz et al. Reference Dabritz, Miller, Gardner, Packham, Atwill and Conrad2008; Mercier et al. Reference Mercier, Garba, Bonnanau, Kane, Rossi, Dardé and Dobigny2013). However, explanatory factors were most often searched for at the species level, while the local environment of individual rodents was not considered. We present the first study accounting for the potential interplay between biological, ecological and spatial factors when investigating the level and spatial distribution of T. gondii infection in rodents. In this study, the overall seroprevalence of the rodent community was low (4%). This value is in line with previous studies (e.g. Jeon and Yong, Reference Jeon and Yong2000; Afonso et al. Reference Afonso, Thulliez, Pontier and Gilot-Fromont2007b ; Dabritz et al. Reference Dabritz, Miller, Gardner, Packham, Atwill and Conrad2008), and especially with the one conducted in the same area by Afonso et al. (Reference Afonso, Poulle, Lemoine, Villena, Aubert and Gilot-Fromont2007a ). The general pattern was stable over two years and at the two sites. Such low prevalence of T. gondii and stability of infection patterns are far from being a generality in rodents, and a review of recent works strongly suggests that species and geographic variability is rather a common fact in rodents.
For instance, for small species such as Apodemus sylvaticus and M. glareolus, T. gondii prevalence has been found to be low (<5%, e.g. this study, Afonso et al. Reference Afonso, Poulle, Lemoine, Villena, Aubert and Gilot-Fromont2007a ), intermediate (10–20%, e.g. Jackson and Siim, Reference Jackson and Siim1986; Kijlstra et al. Reference Kijlstra, Meerburg, Cornelissen, De Craeye, Vereijken and Jongert2008) or high (30–40%, e.g. Fuehrer et al. Reference Fuehrer, Bloschl, Siehs and Hassl2010; Thomasson et al. Reference Thomasson, Wright, Hughes, Dodd, Cox, Boyce, Gerwash, Abushahma, Lun, Murphy, Rogan and Hide2011) depending on the study. Commensal species (mice and rats) even exhibit the largest range of prevalence, varying from 0 to 60–70% across studies (Kuticic et al. Reference Kuticic, Wikerhauser and Gracner2005; Salibay and Claveria, Reference Salibay and Claveria2005; Dubey et al. Reference Dubey, Bhaiyat, Macpherson, de Allie, Chikweto, Kwok and Sharma2006; Murphy et al. Reference Murphy, Williams, Hughes, Hide, Ford and Oldbury2008; Vujanic et al. Reference Vujanic, Ivovic, Kataranovski, Nikolic, Bobic, Klun, Villena, Kataranovski and Djurkovic-Djakovic2010; Yin et al. Reference Yin, He, Zhou, Yan, He, Wu, Zhou, Yuan, Lin and Zhu2010; Jittapalapong et al. Reference Jittapalapong, Sarataphan, Maruyama, Hugot, Morand and Herbreteau2011; Thomasson et al. Reference Thomasson, Wright, Hughes, Dodd, Cox, Boyce, Gerwash, Abushahma, Lun, Murphy, Rogan and Hide2011; Ahmad et al. 2012; Mosallanejad et al. Reference Mosallanejad, Avizeh, Razi Jalali and Hamidinejat2012). Altogether these results suggest that the interplay between biological, ecological and spatial factors strongly shape the patterns of T. gondii prevalence in rodents and that the interpretation of these patterns is not straightforward, as illustrated by the study of Thomasson et al. (Reference Thomasson, Wright, Hughes, Dodd, Cox, Boyce, Gerwash, Abushahma, Lun, Murphy, Rogan and Hide2011) who found an unexpected high level of T. gondii prevalence (41%) in a population of A. sylvaticus in an area where the density of cats was very low (<2·5 individuals km−2).
Numerous factors can play a role in this high variability of prevalence of T. gondii in rodents. Between-studies differences may partly result from variation in detection success of T. gondii, due to the sensitivity of methods used. Several cases of truly infected mice or rats detected as negative using serological tests have been reported in the literature (Dubey et al. Reference Dubey, Shen, Kwok and Thulliez1997; Owen and Trees, Reference Owen and Trees1998; Araujo et al. Reference Araujo, da Silva, Rosa, Mattei, da Silva, Richini-Pereira and Langoni2010). Araujo et al. (Reference Araujo, da Silva, Rosa, Mattei, da Silva, Richini-Pereira and Langoni2010) isolated T. gondii from a rat which was identified as seronegative using MAT test with a low cut-off threshold. This suggests that serological tests, especially when using a high threshold, may underestimate pathogen prevalence. In our study PCR results suggest that we indeed missed some positive individuals by excluding 1:3 dilutions. However, bioassays in 1:3 positive individuals were negative, thus we kept the 1:6 threshold. Direct methods (PCR and bioassay) may also be negative in seropositive individuals and thus could not be used as a gold standard method. Altogether, all these observations suggest that direct and indirect approaches should be combined to detect T. gondii and assess prevalence in rodents.
Biological mechanisms such as variability in vertical transmission or susceptibility may also explain the difference of prevalence found between species and/or geographical areas (Thomasson et al. Reference Thomasson, Wright, Hughes, Dodd, Cox, Boyce, Gerwash, Abushahma, Lun, Murphy, Rogan and Hide2011; Li et al. Reference Li, Zhao, Zhu, Ren, Nie, Gao, Gao, Yang, Zhou, Shen, Wang, Lu, Chen, Hide, Ayala and Lun2012). High levels of vertical transmission have been documented in M. domesticus, M. musculus and A. sylvaticus (Owen and Trees, Reference Owen and Trees1998; Marshall et al. Reference Marshall, Hughes, Williams, Smith, Murphy and Hide2004). Between-species variation in susceptibility to T. gondii, which so far has only been observed in commensal species, with rats being more resistant to infection than mice (Li et al. Reference Li, Zhao, Zhu, Ren, Nie, Gao, Gao, Yang, Zhou, Shen, Wang, Lu, Chen, Hide, Ayala and Lun2012), should also be assessed in order to better understand T. gondii infection patterns in rodent species. Altogether, the results of the studies conducted during the last decade highlight our current lack of understanding of the sources of variability of T. gondii prevalence in rodents. The low observed prevalence also limits the use of rodents as indicators to analyse environmental contamination and direct measures should be preferred.
Besides estimating prevalence, we aimed at disentangling the effects of biological, ecological and spatial factors expected to significantly impact the level and spatial distribution of T. gondii infection in rodents in rural areas. As the overall value of seroprevalence was low, we were unable to compare all variables and modalities together. For example, species other than rats and habitats other than villages could not be discriminated in our dataset. The preliminary multivariate analysis revealed a potential confounding effect of species (non-commensal vs commensal species) and habitat or distance to the nearest farm. These three variables strongly correlated with rodent T. gondii serostatus.
Taking these results into account, the logistic regression and selection model procedure highlighted the explanatory power of the distance to the nearest farm but failed to confirm the other effects previously found. Individual body mass or fossorial lifestyle did not influence the probability of T. gondii infection, as previously suggested (Afonso et al. Reference Afonso, Poulle, Lemoine, Villena, Aubert and Gilot-Fromont2007a ; Reperant et al. Reference Reperant, Hegglin, Tanner, Fischer and Deplazes2009). However, these studies did not account for potential confounding effects with the local environment of captured individuals. It is then difficult to make a full conclusion as to any potential interaction between ecology and local environment.
The risk of T. gondii infection showed non-significant variations according to the site and year considered. The general pattern was stable over two years and at the two sites, although spatio-temporal variability could be explored further.
Distance to the nearest farm was the variable most clearly related to serological status when considering either all rodents or the subset of non-commensal species. The chance of a rodent testing positive for T. gondii decreased by 0·75 with every 100 m increase in distance from the nearest farm (95% IC: 0·60–0·94). This decrease was less pronounced than in a study by Lehmann et al. (Reference Lehmann, Graham, Dahl, Sreekumar, Launer, Corn, Gamble and Dubey2003): their estimate of −0·01 per m gave an OR of 0·37 per 100 m. The effect of distance to the nearest farm was confounded with, and probably explained by, the difference between commensal and non-commensal species and the contrast between village areas and other habitats. A similar confounding effect between rodent species and habitat was found in a recent study on T. gondii prevalence in a tropical area (Mercier et al. Reference Mercier, Garba, Bonnanau, Kane, Rossi, Dardé and Dobigny2013). A high presence of cats near and within farms may explain this spatial pattern: Ferreira et al. (Reference Ferreira, Leitao, Santos-Reis and Revilla2011) showed that areas around farms were favoured by cats, probably due to the abundance of resources provided by people. Juveniles and stray cats, that are particularly at risk of toxoplasmosis, are particularly common on farms (Dubey et al. Reference Dubey, Weigel, Siegel, Thulliez, Kitron, Mitchell, Mannelli, Mateuspinilla, Shen, Kwok and Todd1995; Gauss et al. Reference Gauss, Almeria, Ortuno, Garcia and Dubey2003). Lehmann et al. (Reference Lehmann, Graham, Dahl, Sreekumar, Launer, Corn, Gamble and Dubey2003) suggested that farms could be considered as a source of T. gondii from which the surrounding environment is contaminated.
We detected a species effect which was confounded with distance: R. norvegicus exhibited the highest level of infection by T. gondii (12·9 vs 3·7% on average for other species). This result is also consistent with Lehmann et al. (Reference Lehmann, Graham, Dahl, Sreekumar, Launer, Corn, Gamble and Dubey2003) who also found a higher seroprevalence in R. norvegicus (50%) than in other wild rodents (0–6%). However, seroprevalence varied between our two sampling sites (0/10 and 4/21 of the trapped rats were infected in Boult-aux-bois and Briquenay, respectively), and the total prevalence did not reach the same level found by Lehmann et al. (Reference Lehmann, Graham, Dahl, Sreekumar, Launer, Corn, Gamble and Dubey2003). These results add to the list of inconsistencies found in the literature on both the prevalence of T. gondii in R. norvegicus and its potential importance in the local maintenance of T. gondii (Salibay and Claveria, Reference Salibay and Claveria2005; Dubey et al. Reference Dubey, Bhaiyat, Macpherson, de Allie, Chikweto, Kwok and Sharma2006; Vujanic et al. Reference Vujanic, Ivovic, Kataranovski, Nikolic, Bobic, Klun, Villena, Kataranovski and Djurkovic-Djakovic2010; Yin et al. Reference Yin, He, Zhou, Yan, He, Wu, Zhou, Yuan, Lin and Zhu2010; Jittapalapong et al. Reference Jittapalapong, Sarataphan, Maruyama, Hugot, Morand and Herbreteau2011; Mosallanejad et al. Reference Mosallanejad, Avizeh, Razi Jalali and Hamidinejat2012). When making inferences on the role of R. norvegicus in the T. gondii life cycle, one should keep in mind that its ecology strongly differs from that of other rodents such as voles. Rattus norvegicus is a widespread and opportunistic species considered to be a true commensal, as it almost only lives in close proximity to humans where cats are more abundant (Aplin et al. Reference Aplin, Brown, Jacob, Krebs and Singleton2003; Ferreira et al. Reference Ferreira, Leitao, Santos-Reis and Revilla2011). Rattus norvegicus lives in colonies which are generally established close to food resources and which defend their territory against alien rats (Barnett and Spencer, Reference Barnett and Spencer1951). Rats are therefore likely to be highly exposed to the oocysts present in anthropized areas where cats are abundant, as was the case in the farms sampled in this study. Moreover, within rat colonies, reproduction is mostly due to a few dominant females (Ziporyn and McClintock, Reference Ziporyn and McClintock1991) and females could be more infected by T. gondii than males (Yin et al. Reference Yin, He, Zhou, Yan, He, Wu, Zhou, Yuan, Lin and Zhu2010). Other recent works also revealed that T. gondii may manipulate rodents by enhancing the sexual attractiveness of infected males and reducing the innate fear of cat odour in infected individuals (Berdoy et al. Reference Berdoy, Webster and Macdonald2000; Lim et al. Reference Lim, Kumar, Hari Dass and Vyas2013; Vyas, Reference Vyas2013). Altogether, these particularities could generate a strong variability in the level of infection between rat colonies. For instance, vertical transmission could be particularly high within colonies where dominant females are contaminated, since they are the ones mainly involved in reproduction and because their avoidance of infected males may be relaxed though parasitic manipulation. A reduction of innate fear to cat odours could also increase the risk of rats to be predated during their whereabouts within and around farm buildings, further enhancing between-hosts transmission.
CONCLUSION
We presented the first study accounting for the potential interplay between biological, ecological and spatial factors in shaping the pattern of T. gondii infection in rodents. We found that the proximity of individuals to farm buildings is a major determinant of T. gondii rodent infection in rural areas, where farm buildings are located within villages. The key role of farms in T. gondii epidemiology needs however to be confirmed in other contexts, such as when farms are located far away from residential areas. Our results suggest that oocyst contamination may decreases with increasing distance from the farms. This parameter could therefore be relevant when estimating the risk of human contamination from the environment. As oocysts are becoming increasingly acknowledged as a source of human infection (Boyer et al. Reference Boyer, Hill, Mui, Wroblewski, Karrison, Dubey, Sautter, Noble, Withers, Swisher, Heydemann, Hosten, Babiarz, Lee, Meier and McLeod2011), measuring levels of T. gondii soil contamination, and the presence of cats in different habitats, could improve our understanding of the spatial dynamics of oocysts. This would enable us to better estimate the risk of human contamination and design preventive measures against toxoplasmosis.
Model-averaged parameter estimate (β) with standard error (s.e.) and the odds ratio with 95% confidence interval (CI) for variables included in models with ΔAIC<2. The variable ‘species’ differentiates commensal and non-commensal species

ACKNOWLEDGEMENTS
We thank Audrey Rohfritsch, Anne Xuereb, Karine Berthier, Jean Le Fur, Marie-Amélie Forin-Wiart, Jordan Carvalho and Jean-François Cosson for their help during rodent sampling.
FINANCIAL SUPPORT
This study was supported by the Région Champagne Ardennes, the Agence Française de Sécurité Sanitaire de l'Environnement et du Travail (AFSSET) and the Agence de l'Environnement et de la Maîtrise de l'Energie (ADEME). It was partly funded by the European programmes GOCE-CT-2003-010284 EDEN and FP7-261504 EDENext. The manuscript is registered with the EDENext Steering Committee as EDENext130 (http://www.edenext.eu/).