INTRODUCTION
Water scarcity is a problem in many parts of Ethiopia, where it limits crop and feed production, and impairs agricultural productivity. With irregular and unreliable rainfall as the major source of agricultural water, the lack of storage capacity is the major reason for water scarcity (Awulachew et al., Reference Awulachew, Merrey, Kamara, Van Koppen, Penning de Vries, Boelee and Makombe2005) causing strong annual variability in agricultural production and productivity. The drought-prone mixed crop-livestock farming systems, which are the predominant farming systems in the highland areas, largely depend on animal draught power for land cultivation. The crop and livestock production components are further integrated because of the use of crop residues for animal feeding and the use of animal manure as fertilizer. With low agricultural productivity impairing both people's livelihoods and the environment, there is an urgent need to improve water productivity in mixed systems.
There is limited knowledge on the impact of livestock keeping on water resources and the water requirements for livestock feed production, especially in developing countries (Descheemaeker et al., Reference Descheemaeker, Amede and Haileslassie2010a; Peden et al., Reference Peden, Tadesse, Misra and Molden2007; 2009). Moreover, livestock production is often ignored in mostly sectoral water management approaches (Peden et al., Reference Peden, Taddesse and Haileslassie2009). However, according to Peden et al. (Reference Peden, Tadesse, Misra and Molden2007), improving livestock water productivity (LWP) may lead to some of the greatest improvements in efficiency of future agricultural water use in developing countries. It is further asserted that improvements in LWP can benefit both people's livelihoods and environmental resilience (Peden et al., Reference Peden, Taddesse and Haileslassie2009). Livestock water productivity is defined as the ratio of livestock outputs, including milk, meat, manure, draught power and transport, over the volume of water used to produce them. Interventions to improve LWP can be grouped into three biophysical categories, namely interventions targeting feed management, water management and animal management (Descheemaeker et al., Reference Descheemaeker, Amede and Haileslassie2010a). To ensure adoption, these technical interventions should go hand in hand with institutional and policy measures (Amede et al., Reference Amede, Geheb and Douthwaite2009).
Specific interventions that might work in a certain environment can be identified based on a thorough understanding of the farming system functioning and LWP. For a typical case of the water-stressed mixed crop-livestock systems in the Ethiopian highlands, this study set out to contribute to a better understanding of the prevailing farming system and to apply the theoretical LWP concept developed by others (Amede et al., Reference Amede, Geheb and Douthwaite2009; Descheemaeker et al., Reference Descheemaeker, Amede and Haileslassie2010a; Peden et al., Reference Peden, Taddesse and Haileslassie2009) to a specific example. The purpose was not to conduct a rigorous econometric analysis, but an exploratory assessment of LWP variables, and the potential differences between farmers' wealth classes. To this end, the study objectives were: (i) to characterize the current farming system in terms of crop and livestock production, livestock feed and water consumption for feed production, and (ii) to estimate LWP at the household level through the assessment of livestock products and services, and the water used to produce them.
MATERIAL AND METHODS
Site description
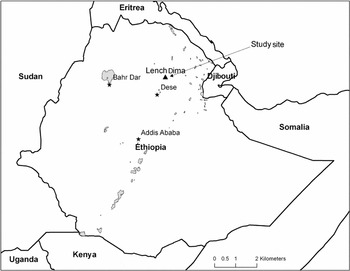
The study was conducted in Lenche Dima watershed (1546 ha), which is located 16 km east of Weldiya town in North Wollo Zone, Amhara Regional State (Figure 1). The site is characteristic of the lower lying semi-arid highlands where subsistence agriculture dominates and land degradation is common.
Location of the Lencha Dima watershed in Ethiopia.

Lenche Dima watershed is a densely populated (218 persons per km2) rural area located at 11.81–11.86°N and 39.67–39.73°E in the dry sub-humid warm temperate highlands (1520–1890 m asl). The average annual rainfall is 850 mm. The rainfall distribution in the area is bimodal, with an average rainfall of 483 mm in the main rainy season (kremt, July to September), 208mm in the small rainy season (belg, March to May) and the remaining rain falling in scattered showers during the dry season. The mean monthly temperature ranges from 20 °C in the winter months of December to February to 28 °C in the hottest months of May to July (McHugh, Reference McHugh2006).
The geology of the watershed comprises trap series of tertiary volcanic rocks, quaternary graben fill sediments and valley-floor granite intrusions (Gizaw et al., Reference Gizaw, Mekonnen and Desta1999). Steep hills and mountains with Regosols and Leptosols cover one third of the land. Valley bottoms with Vertisols occupy 35% of the land while footslopes with Regosols occupy 25% of the land (Gizaw et al., Reference Gizaw, Mekonnen and Desta1999).
Land use of the watershed is dominated by rainfed cropland occupying 60% of the land. Communal grazing land, mostly on hillslopes, can be found on 22% of the land and exclosures (hillslopes closed for grazing) cover 13% of the land (Mekonnen, Reference Mekonnen2010). More information on exclosures is provided by Descheemaeker et al. (Reference Descheemaeker, Raes, Nyssen, Poesen, Haile and Deckers2009) and Yayneshet et al. (Reference Yayneshet, Eik and Moe2009). The major crops are teff and sorghum, while chickpea and maize are also found to a lesser extent. The livestock population is dominated by cattle, but goats, donkeys and camels are also important.
The study site forms part of the food insecure zone of Ethiopia and most people rely on food aid. Remittances from family members abroad have become very important for people's livelihoods as well.
Farming systems characterization
The farming system in the study area and the household level LWP variables were characterized based on information collected through a household survey, discussions with key informants, observations and measurements. The household survey was administered to a relatively small sample of 54 households and was conducted using a pre-tested, detailed questionnaire by trained enumerators. The questionnaire comprised questions on family composition, household socio-economic factors, livestock holding and herd composition, production of livestock products (milk, live animals, manure, hides and skins) and services (transport, draught power), land holding, cropping patterns, crop yields, feed sources and feed production. The survey dealt with the cropping season of 2007–2008, and was complemented by data from McHugh (Reference McHugh2006) and Descheemaeker et al., (Reference Descheemaeker, Mapedza, Amede and Ayalneh2010c). The questionnaire did not include issues of land management and agronomic practices. During a participatory exercise with a representative group of about 10 farmers criteria for three wealth classes (poor, medium, better-off) were determined, including land and livestock holding, and dwelling type. Based on that, all farmers in the study area were assigned to one of the three wealth classes. Using a stratified random sampling technique farmers were picked from each wealth category. Key informant discussions were held on topics like land management, feed practices, value of livestock products and services, and constraints and opportunities in livestock health. Key informants included the district livestock expert, the development agents, the chairmen of the farmers association and knowledgeable farmers from the different wealth categories.
Determination of livestock water productivity
Livestock water productivity was determined at the household level by taking into account all livestock products and services and unifying them based on their market value. For the denominator of the equation, the consumptive use of water, or evapotranspiration, to produce feed is considered. As in Haileslassie et al. (2009a;b) and Van Breugel et al. (Reference Van Breugel, Herreor, van de Steeg and Peden2010), livestock drinking was not considered as it amounts to only 2% of the total water used in small-scale mixed farming systems (Peden et al., Reference Peden, Tadesse, Misra and Molden2007).
The following equation was used to calculate livestock water productivity:
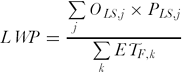
where:
OLS,j = the livestock output j (several different units);
PLS,j = the local market price of the output j (USD/unit)
ETF,k = the water used by evapotranspiration to produce feed type k (m3).
Determination of water consumption for feed production
Feed production was assessed using different methods. For crop residues, dry matter production was determined based on the average grain yields derived from the survey, and the harvest indices and feed use factors derived from literature and key informant data. Grazed biomass was estimated by weekly harvests of the herbaceous biomass from two fenced areas in two grazing lands of the watershed. Hay biomass production was measured at harvesting time in three 1 m × 1 m quadrants in each of 10 exclosure areas.
The information gathered from key informants indicated that crop residues, grazing and hay from exclosures were the dominant feed types. The water used for feed production was therefore determined in terms of evapotranspiration (ET) from the croplands on the one hand and the rangelands (open access grazing lands and exclosures) on the other hand. The ET was computed using the FAO-56 approach (Allen et al., Reference Allen, Pereira, Raes and Smith1998), multiplying the reference evapotranspiration (ET0) by a crop coefficient (Kc, dimensionless). ET0 was computed with the Penman-Monteith method (Allen et al., Reference Allen, Pereira, Raes and Smith1998) based on daily weather data. The meteorological data from the nearby Kobo weather station (12°10′N, 39°38′E, altitude 1530 m asl) included minimum and maximum temperature, rainfall, wind speed, air humidity and sunshine hours. The crop coefficients were adopted from Allen et al. (Reference Allen, Pereira, Raes and Smith1998), and the length of growth stages was evaluated based on field observations.
As crop residues are not a mere by-product in mixed farming systems, the total water used for crop production was partitioned into water for grain and water for residue production, based on the harvest index. The feed use factor (i.e. the percentage of the total biomass that was actually consumed by animals) was used to further adjust the water consumed for feed production. Water partitioning based on biomass was applied here, as other approaches that use monetary values of residues and grains (as in Singh et al., Reference Singh, Sharma, Singh and Shah2004) have the drawback of fluctuating water flows with changing prices.

where:
ETFres,i = the ET to produce the residues of crop i used for feed;
ETc,i = the overall ET for crop i;
HIi = the harvest index of crop I;
FUres,i = the feed use factor of the residues of crop i.
To calculate the water consumption from the rangelands the procedures outlined in Descheemaeker et al. (Reference Descheemaeker, Raes, Nyssen, Poesen, Haile and Deckers2009) were followed. In rangelands, only part of the total biomass production is actually consumed by animals (van Breugel et al., 2010). This percentage, the feed use factor, was used to derive the ET used for feed production. As no actual measurements of the non-consumable biomass were carried out, a grazing land feed use factor of 0.6 was assumed in accordance to reported values for grazing lands in similar agro-ecological conditions in northern Ethiopia (Yayneshet et al., Reference Yayneshet, Eik and Moe2009). This further agreed with a 30–90% off-take range for East African savannas (McNaughton, Reference McNaughton1985) and with the range of 30–70% non-consumable rangeland biomass reported by Le Houérou and Hoste (Reference Le Houérou and Hoste1977). In exclosures, livestock grazing is prohibited and feed is derived only from cut and carry of grasses. Therefore, it was assumed that the feed use factor is about half the feed use factor of the grazing lands, i.e. 0.3. As there were no measurements of total biomass production, this is an arbitrary value that in reality would depend on the management of the area. However, it reflects the fact that in conserved areas more water is used for restoring ecosystem services and woody biomass production, as compared to open-access grazing land.
The ET expressed in mm for each land use type and crop type was multiplied by the respective areas of the latter to obtain the total household level volume of water consumption. The crop and exclosure areas for each household were derived from the survey results. Assuming equal access, the households’ share of the communal grazing land was determined by multiplying the watershed's area of communal grazing land with the households’ share of the total livestock herd, expressed in tropical livestock units (TLU).
Determination of livestock beneficial outputs
For the assessment of livestock outputs, the livestock services and products were assessed based on the household survey results and unified using their market value.
Livestock products
Benefits from milk production were determined based on the annual milk production per household as captured by the survey and the market value of milk. The annual meat production per household was assessed based on the actual number of animals slaughtered, which was derived from the survey results. A dressing percentage of 50% was used for cattle (Tolla et al., Reference Tolla, Mirkena and Yimegnuhal2002) and 45% for small ruminants (Negussie et al., Reference Negussie, Rottmann, Pirchner and Rege2004). For each animal type, the actual number of traded animals, together with their market value, was used to calculate the benefit derived by the household from trading live animals. The benefits from hides and skins were estimated based on the combined number of animals slaughtered and dying of natural causes and the market prices for the different types of skins.
Livestock services
The animal traction service obtained per household was estimated by the number of days the animals worked to plough the land and thresh the crops. The local hiring price for each service was then used to calculate the value. For transport service by donkeys, different activities such as transporting crops to the homestead, the market and the mill, and fetching water were considered together with the local hiring price for these activities.
Manure
In Ethiopia, part of the manure is used for fuel in the form of dried dung cakes, which are collected from the grazing lands (Lupwayi et al., Reference Lupwayi, Girma and Haque2000; Mekonnen and Köhlin, Reference Mekonnen and Köhlin2008). Manure collected from the stable is mostly applied to the fields to replenish soil fertility, and also the droppings in fields and rangelands that are not collected contribute to soil fertility.
In this study, manure was valued according to its use, while carefully interpreting the results according to the recycling function of the livestock. Total manure obtained was estimated based on the TLU holding of each household and the daily manure production per TLU for each livestock type on a dry matter basis. The latter were 3.3, 2.5 and 2.4 kg dry matter (DM) day−1 TLU−1 for cattle, small ruminants and equines, respectively (Haileslassie et al., Reference Haileslassie, Peden, Gebreselassie, Amede and Descheemaeker2009a). A dried dung cake, with average weight of 1.2 ± 0.2 (s.d.) kg, used for fuel had a market value of 0.5 ETB. The manure nutrient content was 15, 4 and 18 g kg−1 DM for N, P and K, respectively (Haileslassie et al., Reference Haileslassie, Priess, Veldkamp and Lesschen2006; Lupwayi et al., Reference Lupwayi, Girma and Haque2000). The 2008 market prices of locally used fertilizers (di-ammonium phosphate and urea) were converted in nutrient prices of US$ 1.35, 0.99 and 0.72 per kg of P, N and K, respectively. These were then used to value the manure that was not used for fuel.
In valuing the manure it is important to consider that livestock are not producing nutrients, but merely recycling them. Therefore, attributing the equivalent fertilizer value to the livestock actually results in an overestimation of their beneficial outputs. Using the manure as fuel results in a net export of nutrients out of the system, which is an unsustainable practice if not compensated by fertilizer application. Based on this, it is recognized that the employed method of manure valuation results in an overestimation of livestock productivity, which has to be taken into account when interpreting the results.
RESULTS
Land and livestock holding
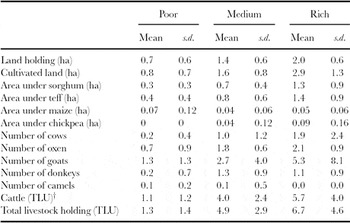
The average land holding size varied from 0.7 to 2 ha for poor and rich farm households, respectively. As farmers lease land from emigrants, elders, divorced and widowed female-headed households, the total size of the cultivated land was usually larger than the land holding (Table 1). This difference amounted to about 15% and 45% of the land holding of the poor and the better-off farmers respectively, with the latter having more means to lease and cultivate the extra land. Farmers mainly planted sorghum and teff, whereas chickpea and maize were cultivated to a lesser extent (Table 1).
Mean landholding, cropland and livestock holding for poor, medium and rich households in Lenche Dima (n = 54).

†TLU: Tropical livestock unit: 250 kg live weight.
Cattle TLU includes oxen, cows, heifers, steers, bulls and calves.
The livestock herd size largely depended on the household's wealth status (Table 1), ranging from 1.3 TLU for poor households to 6.7 TLU for rich households. Cattle were mainly kept to meet the demand for draught power, whereas milk and meat were less important. Goats were kept as a source of cash and as a means to relieve debts. Camels and donkeys were used for transport of products. Farmers commented that there had been a tendency towards reduced animal herd sizes per household, because of the decline in grazing land quality and area.
Crop and feed production
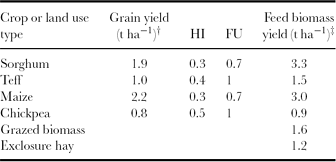
In the production year 2007/08, the grain yields, averaged over the three wealth classes were the greatest for maize at 2.2 t ha−1 and the smallest for chickpea at 0.8 t ha−1 (Table 2). Feed production in terms of crop residues from cropland varied from 1 to more than 3 t ha−1 depending on the crop type (Table 2). Hay production in exclosures amounted to 1.2 t biomass DM ha−1, which was slightly less than the 1.6 t biomass DM ha−1 removed by grazing animals from the open access rangelands.
Grain yield, harvest index (HI), feed use factor (FU) and feed biomass production from different crops and land use types, averaged over the three farmers' wealth classes.
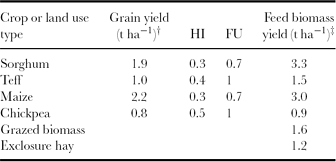
†Grain yield is derived from the survey.
‡Feed biomass concerns crop residues consumed by the animals for the crops (feed biomass = grain yield × FU × (1−HI)/HI) and herbaceous biomass for hay and grazing (measured).
Livestock products and services
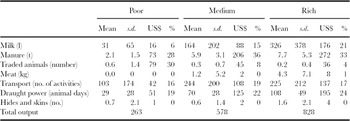
The survey results indicated that milk production in the study area was very low across the wealth classes, with an overall average calving interval of 24 months, daily milk yield ranging from a maximum of 2 l to a minimum of 1.3 l, and a lactation period of less than seven months. On average, poor households produced about 30 l of milk per year, whereas milk production exceeded 300 l in rich households (Table 3). Off-take and slaughter rates were also rather low at an average combined rate of 4% for cattle and 9% for goats. The great importance of livestock keeping for the supply of draught power was evidenced by the average 42 days of draught power supply per ox per year and the average contribution of about 20% to the total livestock output across the wealth classes (Table 3). Depending on the crop and the soil type, land cultivation of 1 ha of land required about 13 to 26 days of ploughing with a pair of oxen, using the local maresha plough. Threshing of the crops was also done by animals (mostly a mixture of different cattle) and took about 13 to 16 animal days for the crop produce coming from 1 ha. In the study area, transport animals performed about 100 activities per year in poor households and more than 200 activities in medium and rich households (Table 3). Expressed in monetary terms, transport of water contributed more than half of the total transport service value generated by donkeys. Transporting crops from the field to the homestead, and to and from the grain mill each contributed about 20%. Market transport contributed only 6% of the total and money generated from transport of people was negligible. Differences between household wealth classes in terms of livestock outputs (Table 3) mainly stem from the differences in livestock holding and herd composition (Table 1). Together with the higher number of oxen in the herd, the larger land holding of rich households explained the higher number of draught working days as compared to poorer households. There was a remarkable difference in the contribution of traded animals to the total livestock output across the wealth classes (Table 3). This reflected the fact that poor households relied more on selling animals for buying food and direct cash needs, whereas better-off households could keep animals within the herd. Also the contribution of milk production to the total output was considerably different between the wealth classes (Table 3), indicating that poor households focused their limited resources on keeping oxen for land cultivation, but better-off households could afford to keep dairy animals. When entirely valued, manure contributed strongly to the total animal outputs, but given that animals are just recycling and not producing nutrients, this has to be interpreted carefully. Averaged over the different wealth classes, draught power was second in importance, followed by transport services, milk production and trading of live animals. Meat and hides and skins were of minor importance in all wealth classes.
Mean annual production of livestock products and services for households in different wealth categories value in US$ and% contribution to the total value.

Livestock productivity was hampered by high mortality rates, amounting to at least 10% for cattle and about 9% for both goats and donkeys. In addition, although no quantitative data was collected, morbidity was ubiquitous, resulting in low performing animals. Major livestock disease types listed by key informants were external parasites (ticks, lice), anthrax and pasteurellosis in the dry season. Bloating, internal parasites, coccidiosis (attacking poultry), foot rot (attacking sheep), diarrhoea and faciolosis, causing swelling of the mandibular area, were common problems mostly in the rainy season. There was one veterinary clinic in Hara town, adjacent to the Lenche Dima watershed, and investment in veterinary inputs and services was very low. In addition, farmers' awareness of disease control measures was low.
Water depletion for livestock feed production
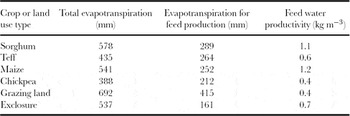
Crop evapotranspiration during the growing period ranged from 388 mm for chickpea to 578 mm for sorghum (Table 4). For grazing land and exclosures, annual water consumption per hectare was about 700 mm and 537 mm, respectively. Taking into account the harvest indices and feed use factors (Table 2), the water consumption for actual feed production was considerably lower. Exclosures, with the lowest feed use factor, used only 161 mm of water for feed production. Grazing land had the highest evapotranspiration for feed production, whereas the water depletion for the production of crop residues was in between those two extremes (Table 4). Feed water productivity (i.e. the ratio of feed biomass over the water used to produce it) was highest for maize and sorghum residues, following by hay from the exclosures and teff straw. The lowest feed water productivity was found for chickpea and grazing land (Table 4). Multiplying the land area under the different crops with their water consumption allowed to calculate the overall water used per household for livestock production. This ranged from 3079 ± 2335 (s.d.) m3 per year for poor households to 11 975 ± 4080 (s.d.) m3 per year for better-off households.
Growing season water consumption for the different crops and land use types and for the feed derived from those.

Livestock water productivity
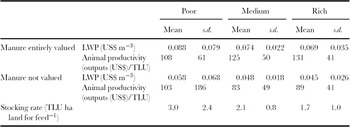
Livestock water productivity varied between US$ 0.07 m−3 for rich farmers and US$ 0.09 m−3 for poor farmers when manure was entirely valued (Table 5). No significant (p > 0.10) differences were observed between the wealth categories. The similarity between the LWP values masked two other trends related to wealth. Firstly, animal productivity, expressed as the total monetary value of livestock outputs over the herd size in TLU, increased with the wealth status of the household (Table 5). Secondly, the stocking rate on feed producing land was higher for poorer households (Table 5). When manure was not valued, LWP was about 30% lower, ranging from 0.05 to 0.06 (Table 5). In this case, animal productivity was higher for poor households, where manure was less important than in better-off households with larger herds (Table 3). These results indicated that LWP was most strongly related to herd size and land holding, as there were no considerable differences between wealth classes in terms of access to inputs or interventions that might improve LWP, such as fertilizers, veterinary services, feed quality improvements and improved breeds.
Mean livestock water productivity (LWP), animal productivity and stocking rate for different wealth categories, under the scenario of entirely valuing manure and not valuing manure.

DISCUSSION
In small-scale mixed systems, livestock provide farmers with several products and assets, including more than the obvious products like milk and meat (Cecchi et al., Reference Cecchi, Wint, Shaw, Marletta, Mattioli and Robinson2010). Similarly to Haileslassie et al. (Reference Haileslassie, Peden, Gebreselassie, Amede, Wagnew and Taddesse2009b), this study revealed that manure (if entirely valued) and draught power were the most important livestock outputs, emphasizing the interactions between the crop and the livestock components in the studied mixed farming systems. The LWP methodology, employing monetary values to unify the different livestock outputs, allowed taking these multiple benefits into account. Another feature of the LWP methodology is the partitioning of water. This is particularly important in mixed-crop livestock systems, where part of the total water used to produce a crop is used for grain production and part is used for the crop residues that are used as feed. As in Haileslassie et al. (Reference Haileslassie, Peden, Gebreselassie, Amede and Descheemaeker2009a), the water partitioning in this study is based on biomass using the harvest index.
The variation in the reported values for the different variables was very high in all wealth categories. This reflected the huge variation between farmers, even within a particular wealth category. One of the drawbacks of the small sample size is that the standard deviation was relatively large making it impossible to detect significant differences between the wealth classes. Notwithstanding this variation, general conclusions on productivity can be drawn. Animal productivity in the study site was relatively low. Milk production was mainly determined by the calving interval of 24 months, the average daily milk yield of 1.7 litres and the lactation period of 200 days. These parameters were worse than the average values for indigenous cattle in Ethiopia reported by Descheemaeker et al. (Reference Descheemaeker, Amede, Haileslassie and Bossio2010b). The same is true for the off-take rates, which were below the average of 10–15% for cattle and 25–35% for small ruminants in Ethiopia (Negassa and Jabbar, Reference Negassa and Jabbar2008). With respect to mortality and morbidity, the rates obtained in this study were similar to what other studies found (e.g. Bekele, Reference Bekele2008). However, these mortality rates of around 10% seriously undermine livestock (water) productivity (Descheemaeker et al., Reference Descheemaeker, Amede and Haileslassie2010a). Also diseased and stressed animals lead to low livestock productivity, as production and service delivery is depressed while sick animals still consume feed and water.
Total annual ET for the different crops and land use types was similar to other areas in the Ethiopian highlands (Haileslassie et al., Reference Haileslassie, Peden, Gebreselassie, Amede and Descheemaeker2009a). The water used for feed production was lower than the total water consumption because of the water partitioning into water for feed and water for grain production. When reporting feed water productivity values, most studies are not following the same partitioning method, as they might not be dealing with mixed crop-livestock systems. Notwithstanding this fact, our range of 0.4–1.2 kg m−3 roughly lay within the much wider range of global feed water productivity values (0.5–8 kg m−3) summarized by Peden et al. (Reference Peden, Tadesse, Misra and Molden2007). However, it is considerably lower than the global value of 2.2 kg m−3 for roughage and pasture used by Chapagain and Hoekstra (Reference Chapagain and Hoekstra2003), indicating that feed water productivity in the study area is relatively low.
Livestock water productivity is positively related to animal productivity (livestock outputs per animal unit). In addition, there is a positive relation between stocking rate and LWP. The latter relation means that farmers who keep more animals on a smaller area of land will have higher LWP. Although this might not be a sustainable practice, current high livestock outputs are combined with low water depletion from the small land area, resulting in high LWP. This also explains why poor farmers generally have higher LWP, even though their animal production is very low. The effect of other factors that might have had an influence on LWP, such as access to veterinary services, fertilizers, feed quality improvements and improved breeds, could not be detected in this study, as key informant and survey data indicated that there was little difference between wealth classes in that respect. In reality, all farmers operate under very constrained conditions, with very similar (i.e. limited) access to interventions for improvement.
CONCLUSIONS
In mixed crop-livestock systems, livestock production provides farmers with important benefits and assets. Therefore, water productivity analysis in these systems has to incorporate an analysis of LWP. This study applied the concept of livestock water productivity to a concrete case study in a water-stressed environment. The methodology included water partitioning to account for the water consumption in feed production and a comprehensive inventory of all livestock products and services, unifying them based on their market value.
Notwithstanding the limitations related to the small sample size, the analysis indicated that feed water productivity and animal productivity were low in the study area. Promising strategies to reverse this include increasing the quality and quantity of feed, improving water conservation and water availability for livestock drinking, and improving veterinary services to reduce animal mortality and morbidity. Examples of interventions and their anticipated effect are discussed in Descheemaeker et al. (Reference Descheemaeker, Amede, Haileslassie and Bossio2010b).
Given the small sample size and the area specificity of this study, future research could be directed towards a mid-scale analysis of the Ethiopian highlands, which could corroborate the findings at hand and allow extrapolations to the larger scale highland area.
Acknowledgements
The authors would like to acknowledge the Bundesministerium für wirtschaftliche Zusammenarbeit und Entwicklung (BMZ) for funding the project on ‘Improving Water Productivity of Crop-Livestock Systems of Sub-Saharan Africa’. Semira Mekonnen received a graduate fellowship allowance through ILRI's capacity building unit. We would like to thank the district Bureau of Agriculture and the development agents in the site for sharing information with us and facilitating our work. Many thanks go to the farmers of Lenche Dima watershed for their co-operation.