Implications
This study evaluates the utility of different near infrared reflectance spectroscopy (NIRS) calibration methods for predicting the feed value of fresh forages. We compare an alternative local approach with the more classical global approach. The local approach conserves all the advantages of NIRS technology (rapidity, non-contaminant technology and precision) and takes into account the number of samples and their diversity when large database are available. It overcomes the main limitation of NIRS, which is that the samples for prediction have to be close to those of the calibration population. The local approach could improve prediction of the nutritional value of feeds, and thus have important economic and environmental implications for animal nutrition.
Introduction
Ruminant performance is closely related to the digestibility and intake of feedstuffs. In most countries, knowledge of the feed value of forages is based on in vivo measurements made in castrated male sheep (Demarquilly et al., Reference Demarquilly, Chenost and Giger1995 for a review). However, the large-scale application of in vivo digestibility trials for evaluating forage feed value is an expensive and time-consuming process that requires large amounts of feeds. As knowing these values is essential for controlled animal feeding, several methods have been developed to estimate the digestible nutrient contents of forages. The principal methods are based on chemical composition (Andrieu et al., Reference Andrieu, Demarquilly and Wegat-Litré1981) or on an in vitro simulation of the in-animal digestion process using rumen fluid inoculum (Tilley and Terry, Reference Tilley and Terry1963; Menke et al., Reference Menke, Raab, Salewski, Steingass, Fritz and Schneider1979) or cellulolytic enzyme (Aufrère and Demarquilly, Reference Aufrère and Demarquilly1989). More recently, near infrared reflectance spectroscopy (NIRS) has been used to predict the in vivo digestibility and voluntary intake (VI) of forages (Park et al., Reference Park, Agnew, Gordon and Steen1998; Decruyenaere et al., Reference Decruyenaere, Lecomte, Demarquilly, Aufrère, Dardenne, Stilmant and Buldgen2009). NIRS hinges on the development of calibration models that relate near-infrared spectral data on feeds or faeces to organic matter digestibility (OMD) and VI values. Prediction of OMD and VI is made complicated by two factors: (i) OMD and VI are not a defined chemical entity and (ii) forage shows broad heterogeneity and consequently introduces a broad range of variation into the calibration equations developed. Several strategies have been proposed for the calibration process. In general, calibration equations are meant to be used for a large population, but extending the scope of these equations to cover different agroclimatic areas or diverse types of forage products can reduce predictive accuracy through potential non-linearity. However, large databases with in vivo values on the same type of forage are not readily available. Futhermore, routine use of a large number of calibration equations increases the complexity of the system. Compounding these problems, the choice of a correct prediction model generally requires additional information on the nature of the target forages, which is not always available to the operator. The local regression procedure takes into account non-linear relationships (Berzaghi et al., Reference Berzaghi, Shenk and Westerhaus2000), and could thus improve the precision of the prediction values.
The aim of this study was to evaluate different NIRS calibration strategies (a species-specific calibration, a family-specific calibration, a global procedure using all samples available in the database and a non-linear approach) in order to predict the chemical composition – crude ash (CA) and crude protein (CP) – OMD and VI of a large set of fresh temperate forages.
Material and methods
Samples and reference methods
This study used a total of 1034 forage samples of different species: rye-grass (Lolium perenne L.), Italian rye-grass (Lolium multiflorum Lam.), cocksfoot (Dactylis glomerata L.), tall fescue (Festuca arundinacea Schreb.), timothy (Phleum pratense L.), soft brome (Bromus mollis L.), lucerne (Medicago sativa L.), red clover (Trifolium pratense L.) and permanent grassland. Forage samples came from digestibility and intake measurements available at INRA Clermont-Ferrand/Theix, which form the main body of the INRA feed nutritive values (Andrieu et al., Reference Andrieu, Demarquilly and Sauvant1989).
Samples were oven-dried at 80°C for 48 h to measure dry matter (DM) and then ground through a 0.8 mm screen. They were stored in ambient laboratory conditions.
CA and CP were measured according to the Association of Official Analytical Chemists (AOAC, 1990). OMD and VI were also determined for each forage sample. In general, measurements were made on six Texel wethers aged between 2 and 4 years, with a mean liveweight of 60 kg. Each measurement period comprised an adaptation period of 8 or 15 days followed by 6 days of experimental measurements (Demarquilly et al., Reference Demarquilly, Chenost and Giger1995). Where age-related changes in digestibility of fresh forages were studied, measurements were made continuously during each cycle of growth. In this case, after an adaptation period of 8 days, successive measurement periods of 6 days were set 1 day apart. Forages were offered ad libitum to measure OMD and VI at the same time. The amount of forage offered was adjusted daily on the basis of the previous day's intake. A refusal of 10% of the offered quantity was allowed. Forages chopped to a length of 5 to 7 cm were offered twice a day, at 0800 and 1600 h. The animals had free access to water and vitamin–mineral blocks throughout the experimental period.
OMD was calculated from in vivo results, DM and CA data on forage offered, refusals and faeces. VI was expressed in g DM/kg of metabolic body weight (BW0.75).
The standard error of the method (s.e.m.) for CA and CP was estimated according to the equation proposed by Snedecor and Cochran (Reference Snedecor and Cochran1980), that is, s.e.m. = s.d./n 0.5, where s.d. is the standard deviation. For the s.e.m. of OMD and VI, the values obtained by Andueza et al. (Reference Andueza, Picard, Peccatte, Gallard, Hassoun, Viudes, Egal, Pradel, Trocquier, Thomas, Delaby, Agabriel and Baumont2007) were taken.
Acquisition of spectra
After sample homogenization, ground and dry forages were placed in a 50 mm diameter ring cup and scanned in reflectance mode at 2 nm intervals from 400 to 2500 nm using a Foss NIRSystems model 6500 scanning VIS/NIR spectrometer (Foss NIRSystems, Silver Spring, MD, USA). Spectra and reference values were recorded using NIRS3 software (Infrasoft International, South Atherton St. State College, PA 16801, USA). Each spectrum was time-averaged from 32 scans. A reference scan (using the internal ceramic reference tile) was taken before and after each sample. The reflectance (R) values were converted into absorbance (A) values using the formula A = log (1/R).
Calibration development and data analysis
Calibrations were developed with WinISI III version 1.60 software (Infrasoft International, South Atherton St. State College, PA 16801, USA). The samples were randomly divided into a calibration set (n = 924) and a validation set (n = 110) according to the number of samples for each population. The modified partial least squares (PLS) regression method was used in the global approach (Shenk and Westerhaus, Reference Shenk and Westerhaus1995). All the models used first derivative transforms of the spectral data (1,4,4,1) in which the first digit is the number of the derivative, the second digit is the gap over which the derivative is calculated, the third digit is the number of data points in the first smoothing and the fourth digit is the number of data points in the second smoothing. Scatter correction pre-treatment, that is, standard normal variate and detrend (Barnes et al., Reference Barnes, Dhanoa and Lister1989), was also used.
Using the global approach, three different sets of calibration models were developed: a single model for all the samples in the calibration population (GLOBAL) or two broad calibration models per botanical family (FAMILY) for grasses and legumes, respectively. Permanent grasslands were included in the grass population given their high proportion of grasses in relation to legumes and forbs. Finally, specific models for each forage species and for permanent grassland were also developed (SPECIES). Due to the low number of samples, brome and timothy species were pooled together. The calibration models were first assessed by cross-validation. The set of calibration samples was divided into four groups and each group was then validated using a calibration developed on the other samples. Critical values for removing outliers were T = 2.5 and a maximum of two elimination passes were allowed.
In the local approach (LOCAL), a PLS model was developed for each prediction sample. This model is based on a relatively small number of spectra from the total population selected on the basis of similarity of unknown spectra. Similar samples are selected using the correlation between the spectrum of the unknown and the spectrum of each of the database samples. Different PLS regression models were thus obtained for each sample according to different options in order to find the optimal models (Shenk et al., Reference Shenk, Westerhaus and Berzaghi1997). The options included: number of samples used; 40 to 200 steps of 40, number of PLS factors used; 10 to 40 step 5 and number of PLS factors removed 1 to 10 step 1. The best setting of each determination based on the lower standard error of cross-validation (SECV) was retained and then used to predict the validation set. WinISI III uses the technique leave-one-out cross-validation technique to calculate the SECV.
The validation set was predicted by the four sets of models (GLOBAL, FAMILY, SPECIES and LOCAL). Before prediction runs, it was tested for outliers (T and H values). Specific models per species were applied to samples of their own species in the validation set and were then considered together to compute the precision of the calibration strategy. The same procedure was followed for both family models. Calibration performance for each model was assessed by standard error of calibration (SEC), coefficient of determination of calibration (R 2C), SECV, coefficient of determination of cross-validation (R 2CV), residual predictive deviation (RPD) or ratio of SECV to the s.d. of original data and the ratio of the SECV to the range in the reference data (RER). According to Williams and Sobering (Reference Williams and Sobering1993), RPD and RER values >3 and 10, respectively are satisfactory for screening, and RPD values >5 are adequate for quality control. Validation performance for each model was assessed by the coefficient of determination of external validation (R 2V) and by the standard error of prediction (SEP). Performances of prediction equations (SEP) were compared according to the procedure proposed by Fearn (Reference Fearn1996). To gain further insight into the performance of the models on the validation set, the mean square deviation (MSD) of each model was broken down into the three additive components; bias, non-unity slope (NU) and dispersion or lack of correlation (LC; Gauch et al., Reference Gauch, Hwang and Fick2003). MSD was calculated as SEP2.
In order to identify wavelengths that correlated to the components studied, for OMD and VI, the global database was divided into four homogeneous groups according to the content of the reference value. Then, the average spectrum of each group was calculated and the four average spectra were plotted together and visually compared (Decruyenaere et al., Reference Decruyenaere, Lecomte, Demarquilly, Aufrère, Dardenne, Stilmant and Buldgen2009).
Results
The mean, s.d., minimum and maximum values for the chemical composition variables, OMD and VI for both calibration and validation sets are given in Table 1 along with the s.e.m. for the different determinations. Differences between maximum and minimum values for all the reference methods confirm that the forage chemical composition and feed value database is representative of a broad range of production conditions for the effects of botanical family, species, vegetation cycle and maturity stage. Calibration and validation sets covered similar ranges for each component. Mean and s.d. values were also similar for both sets.
Descriptive statistics for the CA (g/kg DM), CP (g/kg DM) in vivo OMD (g/g), and VI (g/kg BW0.75) within calibration and validation sets

s.e.m. = standard error of the method; CA = crude ash; DM = dry matter; OMD = organic matter digestibility; VI = voluntary intake.
Chemical composition
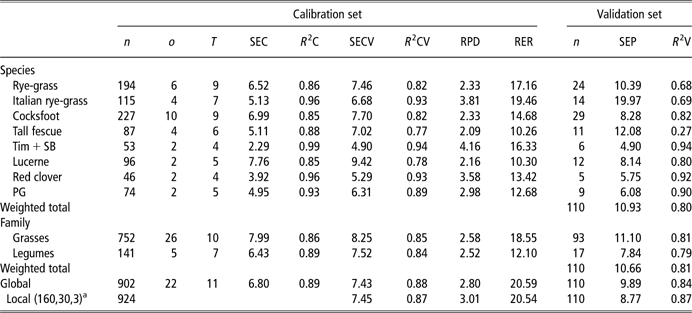
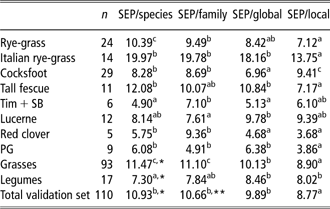
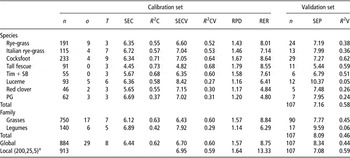
Each sample of the validation set was value-predicted using the four different equations developed, that is, with samples of the same species, samples of the same family (grasses or legumes), by a global calibration using all samples of the population and lastly by the local approach. The CA and CP results obtained by the four approaches are given in Tables 2, 3, 4 and 5, respectively.
Calibration and validation statistics for prediction of CA (g/kg DM) according to the different equations developed: species-specific, family-specific, a global equation and the local approach
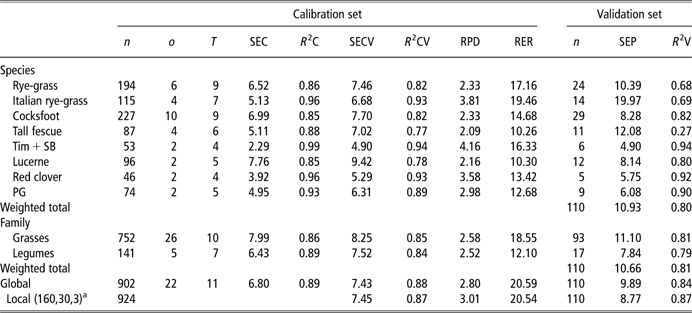
CA = crude ash; DM = dry matter; n = number of samples; o = number of outliers removed; T = number of terms used to perform the calibration model; SEC = standard error of calibration; R 2C = coefficient of determination in calibration; SECV = standard error of cross-validation; R 2CV = coefficient of determination in cross-validation; RPD = residual predictive deviation; RER = range error ratio; SEP = standard error of prediction; R 2V = coefficient of determination in the validation set; Tim + SB = timothy + soft brome; PG = permanent grassland; PLS = partial least squares.
aLocal settings = number of selected samples, number or PLS factors and number of PLS factors discarded, in brackets.
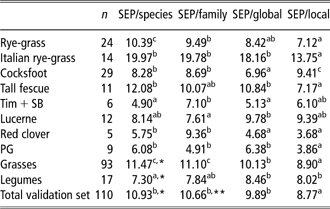
SEP for CA (g/kg DM) obtained when the validation set for each species and each family was predicted using four methods: a species-specific model, a family-specific model, a global model and a local approach
SEP = standard error of prediction; CA = crude ash; DM = dry matter; n = number of samples; Tim + SB = timothy + soft brome; PG = permanent grassland.
*The SEP corresponds to the weighted SEP obtained when samples from a species were predicted using the model developed for this species.
**The SEP corresponds to the weighted SEP obtained when samples from a family were predicted using the model developed for this family.
Figures within a row with different superscripts are significantly different at P < 0.05.
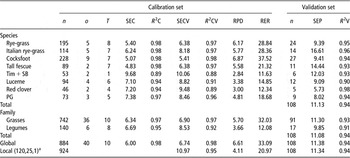
Calibration and validation statistics for prediction of CP (g/kg DM) of forages according to the different equations developed: species-specific, family-specific, a global equation and the local approach

DM = dry matter; n = number of samples; o = number of outliers removed; T = number of terms used to perform the calibration model; SEC = standard error of calibration; R 2C = coefficient of determination in calibration; SECV = standard error of cross-validation; R 2CV = coefficient of determination in cross-validation; RPD = residual predictive deviation; RER = range error ratio; SEP = standard error of prediction; R 2V = coefficient of determination in the validation set; Tim + SB = timothy + soft brome; PG = permanent grassland; PLS = partial least squares.
aLocal settings = number of selected samples, number or PLS factors and number of PLS factors discarded, in brackets.
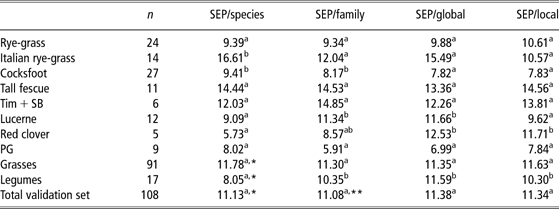
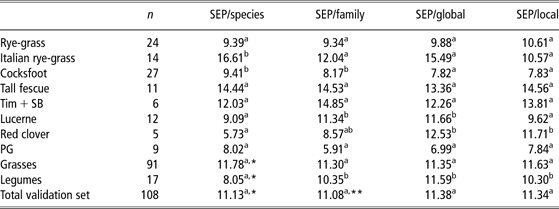
SEP for CP (g/kg DM) obtained when the validation set for each species and each family was predicted using four methods: a species-specific model, a family-specific model, a global model and a local approach
SEP = standard error of prediction; CP = crude protein; DM = dry matter; n = number of samples; Tim + SB = timothy + soft brome; PG = permanent grassland.
*The SEP corresponds to the weighted SEP obtained when samples from a species were predicted using the model developed for this species.
**The SEP corresponds to the weighted SEP obtained when samples from a family were predicted using the model developed for this family.
Figures within a row with different superscripts are significantly different at P < 0.05.
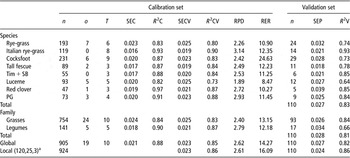
For CA predictions using equations for each species, the calibration statistics varied widely. Accurate predictions were obtained for timothy + soft brome, red clover and permanent grasslands (SEP < 6.1 g/kg; R 2V ⩾ 0.90), but samples of tall fescue, rye-grass and, especially Italian rye-grass were not well predicted by their equations (SEP > 10 g/kg; R 2V < 0.70). Statistical values obtained from the broad equations developed for grasses, legumes and entire forage database fell between those obtained for each species (SEP of 11.10, 7.84 and 9.89, respectively). The SEP obtained using the local approach was 12% lower than the SEP obtained using the global approach. Calibrations for CA generally presented RPD values below 3 (2.58, 2.52 and 2.80 for the grasses, legumes and entire forage databases, respectively). When the validation set from each species was predicted using the four calibration strategies, SEP values from the local approach fell among the lowest values for all species, with the exception of cocksfoot (Table 3).
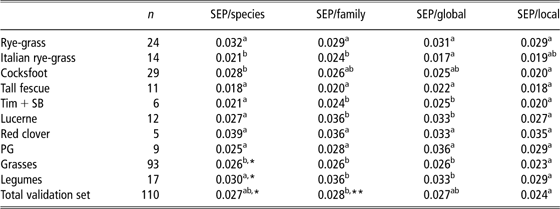
All the equations developed for CP (Table 4) showed a high predictive capacity for quality control with coefficients of determination (R 2CV) above 0.88 for species-specific calibrations models and above 0.91 when the broad calibrations were used. A marked variability between single-species calibrations was obtained (SECV, 5.41 to 10.06). Italian rye-grass and tall fescue presented higher SEP values than those obtained from the cross-validation set. SEP associated to the different approaches (Table 5) was not significantly different. However, when the four approaches were used to predict the validation set of the different species (Table 5), variable results were found. There were no differences between approaches for rye-grass, tall fescue, timothy + soft brome and permanent grassland. For red clover, the species-specific model performed better than global and local models, whereas for Italian rye-grass, the species-specific model performed worse than the other approaches.
In all cases, RPD values for CP (Table 4) were acceptable, ranging from 3.0 for red clover to 6.87 for the cocksfoot equation.
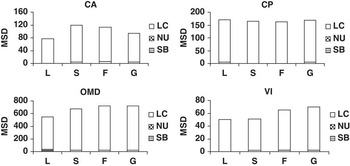
The results of MSD decomposition for CA and CP into their components is shown in Figure 1. For CA, the local approach gave lower MSD values than species-specific, family-specific and global equations, whereas for prediction of CP, all the equations gave similar MSD values. For both determinations (CA and CP), squared bias and NU were near zero. NU evaluates the discrepancy between the model and reference data attributed to a slope different to unity. In all cases, lack of correlation between models and reference data accounted for >99% of the MSD value.
Mean square deviation (MSD) values and contribution of their components: squared bias (SB), non-unity slope (NU) and lack of correlation (LC) to MSD value for species-specific (S), family-specific (F), global procedure (G) and local approach (L) calibration strategies calculated for crude ash (CA), crude protein (CP), organic matter digestibility (OMD) and voluntary intake (VI). OMD values have been multiplied by 106.

Digestibility and VI
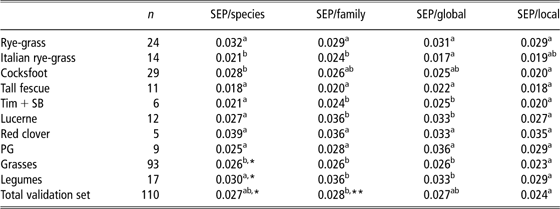
Statistics derived from the four calibration strategies for predicting OMD values are given in Tables 6 and 7. R 2CV values ranged from 0.73 for lucerne to 0.90 for Italian rye-grass. In general, RPD values were below 3 except for the calibration equation for Italian rye-grass. RPD for the permanent grasslands equation was close to 3. SEP associated with the equations developed for each species ranged from 0.018 for tall fescue to 0.039 for red clover. SEP obtained with the broad-based global of per-family equations fell between the SEP values associated with the specific equations. RPD values obtained for the broad-based equations ranged from 2.40 to 2.79 for grasses and legumes, respectively. All the equations presented RER values above 10, except for lucerne.
Calibration and validation statistics for prediction of OMD (g/g) according to the different equations developed: species-specific, family-specific, a global equation and the local approach

OMD = organic matter digestibility; n = number of samples; o = number of outliers removed; T = number of terms used to perform the calibration model; SEC = standard error of calibration; R 2C = coefficient of determination in calibration; SECV = standard error of cross-validation; R 2CV = coefficient of determination in cross-validation; RPD = residual predictive deviation; RER = range error ratio; SEP = standard error of prediction; R 2V = coefficient of determination in the validation set; Tim + SB = timothy + soft brome; PG = permanent grassland; PLS = partial least squares.
aLocal settings = number of selected samples, number or PLS factors and number of PLS factors discarded, in brackets.
SEP for OMD (g/g) obtained when the validation set for each species and each family was predicted using four methods: a species-specific model, a family-specific model, a global model and a local approach
SEP = standard error of prediction; OMD = organic matter digestibility; n = number of samples; Tim + SB = timothy + soft brome; PG = permanent grassland.
*The SEP corresponds to the weighted SEP obtained when samples from a species were predicted using the model developed for this species.
**The SEP corresponds to the weighted SEP obtained when samples from a family were predicted using the model developed for this family.
Figures within a row with different superscripts are significantly different at P < 0.05.
SEP values associated with the broad-based equations using the entire forage database were at least 12% higher than the SEP values obtained by the local approach. In all cases, SEP associated to local approach was among the lowest for the different species (Table 7). However, for permanent grassland, red clover, tall fescue and rye-grass, there were no between-approaches differences (P > 0.05).
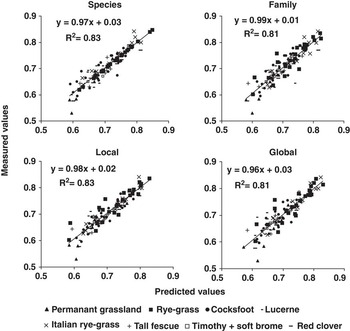
The performance of different calibration equations for in vivo OMD is shown in Figure 2. The highest coefficient of determination for the relationship between predicted and measured data was obtained when the local approach was used.
Predicted values v. measured values for organic matter digestibility (OMD) according to species-specific, family-specific, global procedure and local approach calibration strategies.

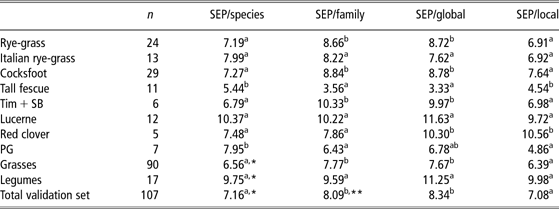
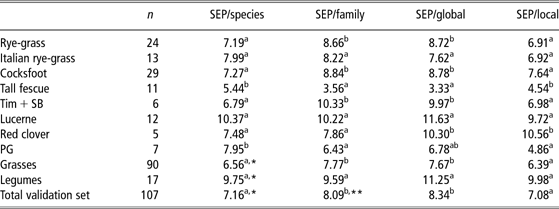
Statistics associated with calibration equations developed for VI are given in Tables 8 and 9. For the specific equations, SEP ranged from 5.44 to 10.37 g DM/kg BW0.75 for tall fescue and lucerne, respectively. The weighted mean SEP value for specific calibrations was 7.16 g DM/kg BW0.75. On the total validation set, higher SEP values were obtained for the global and family equations (8.34 and 8.09 g DM/kg BW0.75, respectively). SEP associated with the local approach (7.08) was similar to the mean value obtained for the specific calibrations.
Calibration and validation statistics for prediction of VI in g/kg BW0.75 according to the different equations developed: species-specific, family-specific, a global equation and the local approach

VI = voluntary intake; n = number of samples; o = number of outliers removed; T = number of terms used to perform the calibration model; SEC = standard error of calibration; R 2C = coefficient of determination in calibration; SECV = standard error of cross-validation; R 2CV = coefficient of determination in cross-validation; RPD = residual predictive deviation; RER = range error ratio; SEP = standard error of prediction; R 2V = coefficient of determination in the validation set; Tim + SB = timothy + soft brome; PG = permanent grassland; PLS = partial least squares.
aLocal settings = number of selected samples, number or PLS factors and number of PLS factors discarded, in brackets.
SEP for VI (g/kg BW0.75) obtained when the validation set for each species and each family was predicted using four methods: a species-specific model, a family-specific model, a global model and a local approach
SEP = standard error of prediction; VI = voluntary intake; n = number of samples; Tim + SB = timothy + soft brome; PG = permanent grassland.
*The SEP corresponds to the weighted SEP obtained when samples from a species were predicted using the model developed for this species.
**The SEP corresponds to the weighted SEP obtained when samples from a family were predicted using the model developed for this family.
Figures within a row with different superscripts are significantly different at P < 0.05.
The MSD of the different calibration methods obtained for OMD and VI are shown in Figure 1. For OMD, the local approach gave lower MSD values than the other methods. For VI, the broad-based global or family-specific equations gave higher MSD values than the local or species-specific equation approaches.
Squared bias and NU components were virtually non-existent for OMD and VI, irrespective of the equation methods. Most of the variability is explained by random error or lack of correlation between models and reference data.
Relevant NIR spectral regions
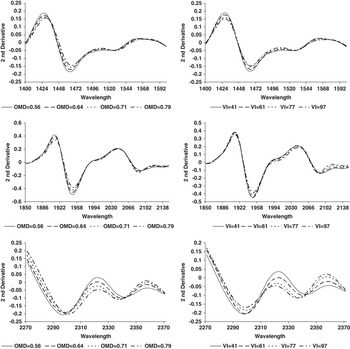
Some of the most important regions of averaged second derivative forage spectra of the four groups for each component are presented in Figure 3. Forages that are characterized by low OMD and VI values presented high absorbance values at 1430, 1780 and 2322 nm and lower values at 1506, 2106 and 2356 nm.
Second derivatives of NIR spectra for (a) organic matter digestibility (OMD) and (b) voluntary intake (VI) for different wavelength segments in relation to averaged four-group samples selected according to ascending reference values.

Discussion
The forage samples used in this study (n = 1034) were considered as representative of the feed value of the fresh forages found in temperate regions. Factors influencing digestibility and intake of temperate forages, such as maturity stage, growth cycle, botanical family and species, location and year (Andrieu et al., Reference Andrieu, Demarquilly and Sauvant1989) are all represented in the database.
NIR spectral regions
In general, averaged second derivative spectra associated to ascending OMD groups were similar to those associated to ascending VI groups (Figure 3a and b). Forages characterized by high OMD and VI values presented low absorbance values in the wavelength regions of fibre (1430 and 1780 nm; Osborne and Fearn, Reference Osborne and Fearn1986) and high values at 1506 and 2076 nm peaks associated to proteins (Osborne and Fearn, Reference Osborne and Fearn1986). The relationships between OMD and VI and chemical composition (CP and fibre) are well known, and are reviewed in Demarquilly et al. (Reference Demarquilly, Chenost and Giger1995). Similar relationships between wavelength regions associated to fibre and digestibility were found by Decruyenaere et al. (Reference Decruyenaere, Lecomte, Demarquilly, Aufrère, Dardenne, Stilmant and Buldgen2009) working with faeces. According to Dixon and Coates (Reference Dixon and Coates2009), the NIR spectra of faeces closely resemble the NIR spectra of the forage from which the faeces are derived.
Chemical composition
CA content is an estimation of the mineral content of the forage. It reflects the total inorganic content of a sample. Between-sample differences in CA content are due to a combination of differences in mineral content and soil contamination. In theory, inorganic substances do not have near-infrared absorption bands. However, successful CA measurements by NIRS have been reported for grasses and lucerne by Clark et al. (Reference Clark, Mayland and Lamb1987) and for pastures by Windham et al. (Reference Windham, Hill and Stuedemann1991) and Ruano-Ramos et al. (Reference Ruano-Ramos, Garcia-Ciudad and Garcia-Criado1999). The perfect correlation between CA and organic matter content could explain these good results. In our study, R 2CV ranged from 0.77 to 0.94 and SEP ranged from 4.9 to 20.0 g/kg DM. Ruano-Ramos et al. (Reference Ruano-Ramos, Garcia-Ciudad and Garcia-Criado1999) report results similar to those found for lucerne, red clover, timothy and permanent grasslands, whereas the SEP obtained by Windham et al. (Reference Windham, Hill and Stuedemann1991) came closest to the SEP obtained for Italian rye-grass samples. These authors highlight the importance of soil contamination in the SEP obtained, particularly when equations were generated with first or second derivatives of log 1/R.
Differences between the SEC and SEP obtained for Italian rye-grass and tall fescue species indicate that not all the variability of the population is presented in the calibration sets. SEP associated with the broad-based equations developed for total legumes were lower than the SEP of the calibration models developed for total grasses. According to Ruano-Ramos et al. (Reference Ruano-Ramos, Garcia-Ciudad and Garcia-Criado1999), the simpler botanical composition of legumes (only samples of lucerne and red clover) relative to grasses (five species plus permanent grasslands) could explain these results. However, cross-comparison of the weighted SEP using FAMILY predictions (10.66) and the SEP obtained for the global calibration (9.89) was unable to find differences. Local calibration gave a 12.5% improvement in the results of global calibration using the entire forage database.
CP may be the most commonly measured variable in forages and feedstuffs. The R 2 and RPD values associated with all the CP calibration equations were satisfactory and consistent with results reported by other authors (Ruano-Ramos et al., Reference Ruano-Ramos, Garcia-Ciudad and Garcia-Criado1999). In all cases, with the exception of timothy + soft brome, RPD values for CP were very good, ranging from 3.0 for red clover to 6.87 for the cocksfoot equation. Sinnaeve et al. (Reference Sinnaeve, Dardenne, Agneessens and Biston1994a) and Williams and Sobering (Reference Williams and Sobering1996) suggest that RPD values >2.5 indicate that the equation is adequate for quality screening purposes and RPD value >3 indicate that the equation can be used for quantitative analysis. According to these criteria, the broad-based calibrations developed for CP can be used for quantitative analyses, whereas the model developed for timothy + soft brome was only adequate for quality screening purposes. This RPD value suggests that there is latitude for increasing the variability in the calibration population as confirmed when comparing s.d. and range values for this species combination against other species (data not shown).
We found marked variability in the predictive performance of single-species calibrations (SEP, 5.73 to 16.61). However, for Italian rye-grass and tall fescue, the SEP of the external validation set was higher than the SEP obtained from the calibration set. Despite the high number of samples of both species, not all the variability is present in the databases, and according to Shenk et al. (Reference Shenk, Landa, Hoover and Westerhaus1981), a greater effort is needed to expand these equations so that SEP does not exceed the SEC by 33%. Except for these values, SEP data were similar to those obtained by other authors (Brown et al., Reference Brown, Moore, Kunkle, Chambliss and Portier1990). When broad-based calibrations were compared with species-specific equations, SEP values obtained for broad grasses and legume multi-species equations fell between those obtained for single species separately. Brown et al. (Reference Brown, Moore, Kunkle, Chambliss and Portier1990) also obtained intermediate values between general NIRS calibrations and species-specific calibration, indicating that CP was estimated with a similar degree of precision from both equation types. Brown and Moore (Reference Brown and Moore1987) also concluded that the degree of precision of a general equation for predicting CP was similar to that of narrower equations developed for predicting samples from different experiments.
The SEP obtained from the global equation indicates a degree of accuracy similar to that obtained with the equations developed from each family of samples. No differences were found between SEP for CP comparing global against local approaches. Generally, literature results report lower SEP when the local approach was used compared with a global equation (Sinnaeve et al., Reference Sinnaeve, Dardenne and Agneessens1994b) and Berzaghi et al. (Reference Berzaghi, Shenk and Westerhaus2000) report gains of 8% and 17% (on average), respectively. The better results of the local approach in relation to the broad calibration equations can be explained by the ability of the local approach to take into account non-linear relationships between spectral and reference data (Sinnaeve et al., Reference Sinnaeve, Dardenne and Agneessens1994b). The forage database used by Berzaghi et al. (Reference Berzaghi, Shenk and Westerhaus2000) gave CP values in the range from 18.5 to 325 g/kg, whereas in our study CP ranged from 50 to 280 g/kg. In our study, non-linear relationships between spectral and chemical data may not have occurred due to the smaller range of CP values, and consequently no improvements were found with the use of the local regression. Sekulic et al. (Reference Sekulic, Seasholtz, Wang, Kowalski, Lee and Holt1993) state that non-linear methods such as local regression are able to construct models with equivalent predictive ability compared with PLS regression or principal component regression when the relationship between predicted v. measured values is linear.
Digestibility and VI
Most of the equations developed for OMD and VI could not be used for quantitative applications, consistent with the criteria proposed by Williams and Sobering (Reference Williams and Sobering1996). Even though most of the variability in the nutritional value of temperate forages is included in the database (Andrieu et al., Reference Andrieu, Demarquilly and Sauvant1989), not enough variability was present to obtain RPD values >3. More research is needed to increase this variability. Inclusion of roughage (straw and corn stalk), younger and older forages and preserved forages could increase the variability of the database and thereby the RPD. Williams and Sobering (Reference Williams and Sobering1996) underline that it can sometimes be difficult to reach RPD values >3. In these cases, they propose using RER as a criterion for evaluating calibration equations. In our study, RER values >10 were found for most of the equations developed for OMD, but not for VI.
The statistical values associated to OMD and VI were similar to those reviewed by Dixon and Coates (Reference Dixon and Coates2009) using NIR spectra of faeces, although for VI, there are reports of R 2C values >0.95.
Using local calibration, SEP for OMD was improved by 12.5% relative to global calibration. Sinnaeve et al. (Reference Sinnaeve, Dardenne and Agneessens1994b) attributed the better results obtained with the local regression technique to the fact that it could exploit the non-linear relationships between spectral and reference values and the inhomogeneity of the samples. In our study, the inhomogeneity of samples in the database may have been caused by the large time interval used for data collection. The non-linear relationship could be partially explained by the fact that several components of chemical composition (CP, cell wall content, non-structural carbohydrates, minerals, etc.) can interact on in vivo forage digestibility (Demarquilly et al., Reference Demarquilly, Chenost and Giger1995). These interactions could be enhanced by the variations in rates of transit through the gastrointestinal tract, as in vivo digestibility trials were performed at ad libitum level (Cochran and Galyean, Reference Cochran and Galyean1995).
According to Stuth et al. (Reference Stuth, Jama and Tolleson2003), there is increasing interest in NIR calibration of in vivo digestibility values as it allows the elimination of the intermediate laboratory techniques for predicting forage energy value. However, little has been published in the literature on the prediction of nutritional forage value by NIRS, possibly because large databases with in vivo digestibility values conducted under standardized conditions are required. Useable relationships between NIRS optical data and in vivo nutritional values of fresh forages have been reported by Norris et al. (Reference Norris, Barnes, Moore and Shenk1976), Robert et al. (Reference Robert, Bertrand and Demarquilly1986), Givens et al. (Reference Givens, Baker, Adamson and Moss1992) and more recently Decruyenaere et al. (Reference Decruyenaere, Lecomte, Demarquilly, Aufrère, Dardenne, Stilmant and Buldgen2009). SEP values obtained by these authors are similar to those obtained in our study with a higher number of samples and types of forages.
According to Shenk et al. (Reference Shenk, Workman and Westerhaus1992), a global calibration is designed to analyze a large proportion of samples for a given population, and calibration samples should include samples from several years, species cuts, particle size, sample preparations, etc. Considering the complexity of forage composition and the variability of the sources of variation, large databases are needed in order to obtain robust calibrations, and they should be frequently updated (Dardenne et al., Reference Dardenne, Sinnaeve and Baeten2000). Considering the difficulty of obtaining in vivo digestibility values, this study may represent the first step towards obtaining universal equations to predict the in vivo nutritional value of temperate forages.
To our knowledge, no previous study has sought to compare different calibration methods for predicting the voluntary forage intake of ruminants. The difficulty obtaining a large database of samples with intake measurements might explain this shortfall.
Considering the results obtained for R 2CV, R 2V, RPD and RER, no robust equations were obtained for the prediction of VI. Similar performance was obtained by Decruyenaere et al. (Reference Decruyenaere, Lecomte, Demarquilly, Aufrère, Dardenne, Stilmant and Buldgen2009) for predicting the VI of organic matter. In our study, RPD and RER were calculated as the ratio of the SECV to the s.d. or the range of the initial population, respectively. Comparing the values obtained in order to measure the spread of our database relative to others (Norris et al., Reference Norris, Barnes, Moore and Shenk1976; Decruyenaere et al., Reference Decruyenaere, Lecomte, Demarquilly, Aufrère, Dardenne, Stilmant and Buldgen2009), we noted that our study showed similar or slightly larger variability for VI. We can consider that the spread of our database covers most of the variability for VI of temperate forages (Andrieu et al., Reference Andrieu, Demarquilly and Sauvant1989). With regard to the SECV, this statistic depends on the s.e. of the measure and the error made by the NIRS instrument. It is well known that the s.e. of the VI measure is larger than s.e. errors obtained for digestibility measures (Barnes, Reference Barnes1968; Andueza et al., Reference Andueza, Picard, Peccatte, Gallard, Hassoun, Viudes, Egal, Pradel, Trocquier, Thomas, Delaby, Agabriel and Baumont2007) because VI depends only partially on the intrinsic properties of the forage. Factors such as type of animal (Chenost and Demarquilly, Reference Chenost and Demarquilly1982), temperature (Chai et al., Reference Chai, Kennedy, Milligan and Mathison1985) and day length (Michalet-Doreau and Gatel, Reference Michalet-Doreau and Gatel1983) are known to influence animal intake capacity and consequently the variability of VI measurements. These factors are very difficult to take into account unless a standard forage is used in all sets of measurements (Dulphy et al., Reference Dulphy, Baumont, L'Hotelier and Demarquilly1999). However, this procedure is impossible when large databases are built making it difficult to reduce the s.e. of the measurement.
Conclusions
The large set of forage samples used in this study, which are representative of a broad range of conditions, constitutes the first step towards obtaining universal calibration equations for predicting the animal response to temperate forages.
Calibration models performed well for CA, CP and for OMD. Only calibration models developed for VI were inadequate for in practice prediction purposes.
More research is needed to expand the variability of databases for most of the determinations used in this study, particularly OMD and VI. The inclusion of preserved forages, low-quality forages, warm-season forages and/or tropical forages could increase variability.
Compared with species-specific calibration and broad-based calibrations, the local approach was shown to be effective in reducing SEP for animal attributes (OMD and VI) and CA determinations. The local algorithm performed as well as the other approaches for prediction of CP. This local approach may provide a practical solution to developing robust universal equations for animal response determinations. It is convenient when improvements to models are needed, particularly with the inclusion of new samples representative of factors not included in the database.
Acknowledgements
The authors thank the INRA's Monts-d'Auvergne (UE1296), Lusignan (UE0006) and Le Pin-au-Haras (UE0326) experimental stations for the use of their samples and results. The authors also thank J. M. Ballet and J. C. Delpeux and the Annexe Elevage team of the UR1213 Herbivores for their technical help.