


Introduction
Public debate is central to most theories of democracy. Moreover, the public sphere is a big part of citizens’ daily experience of democratic politics, as it determines which actors and viewpoints dominate public debates, what resources are available for citizens to monitor and criticize public officials, how much and what kind of information citizens have access to, and to what extent public debate fuels or attenuates conflicts among the population.
This article offers, to our knowledge, the first cross-national analysis of the relationship between different features of the public sphere and citizens’ satisfaction with democracy. To this end, it conceptualizes three features of national public spheres that vary across countries and over time: (1) pluralism , that is, to what extent different actors can voice alternative perspectives in the public arena; (2) information , that is, to what extent the public sphere provides reliable information to the citizenry; and (3) respect , that is, to what extent social interactions in the public sphere are characterized by respectful forms of dialogue.
Based on this conceptual framework, we collected fifty-two indicators about these aspects of the public sphere to produce yearly measures of how pluralistic, informative, and respectful the public sphere was in 175 countries between 2000 and 2020. Our data shows that while pluralism did not change much in electoral democracies during this period, the quality of information and the respectfulness of public debate tended to decline.
We then evaluate the relationship between these features of national public spheres and citizens’ satisfaction with democracy using data from the European Social Survey (ESS 2020) and the Comparative Study of Electoral Systems (CSES 2020). The analyses of over 200,000 respondents in at least thirty-six different electoral democracies indicate that the three features of the public sphere tend to be associated with higher levels of satisfaction with democracy. However, the association between the respectfulness of public debate and democratic satisfaction is especially strong, as it remains substantively large and statistically significant across different model specifications, controlling for various economic and socio-demographic factors, the quality of elections, respect for constitutional constraints on the executive, the other features of the public sphere, and past levels of democratic satisfaction in the country.
Our findings, based on cross-national variation in the qualities of public spheres, are consistent with the results of recent experiments and country case studies on the effects of political communication on political attitudes, including the representation of alternative viewpoints (Merkley et al Reference Merkley, Cutler, Quirk and Nyblade2019), the prevalence of misinformation (Nisbet et al Reference Nisbet, Mortenson and Li2021), and the tone of public debate (Mutz and Reeves Reference Mutz and Reeves2005; Skytte Reference Skytte2021, Reference Skytte2022). The article thus brings together the intuitions of normative theories of deliberative democracy about the importance of non-electoral institutions (Bächtiger and Parkinson Reference Bächtiger and Parkinson2019; Landemore Reference Landemore2020; Parkinson and Mansbridge Reference Parkinson and Mansbridge2012) with micro-level studies of the attitudinal effects of political communication and macro-level research on institutional change. Although our empirical strategy does not allow us to make strong causal claims based on observational data, we present robust evidence of a close association between certain features of national public spheres and citizens’ democratic attitudes. In doing so, the article makes a plausible case for the claim that the erosion in the quality of public debate might have contributed to the decline in citizens’ satisfaction with democracy in recent times (Foa and Mounk Reference Foa and Mounk2016; Foa and Mounk Reference Foa and Mounk2025; Norris Reference Norris2017).
The Drivers of Satisfaction with Democracy
Research on democratic attitudes typically distinguishes between output- and input-based drivers of satisfaction with democracy. This distinction echoes David Easton’s classic distinction between specific and diffuse support for the regime (Easton Reference Easton1975). Whereas output-based drivers of satisfaction refer to the performance of the specific government officials that are in power, input-based drivers are associated with the more permanent institutions that structure political processes.
On the output side, one of the strongest predictors of satisfaction with democracy is the extent to which citizens approve of the performance of public officials, especially when it comes to managing the economy (Claassen and Magalhães Reference Claassen and Magalhães2022; Curini, et al Reference Curini, Jou and Memoli2015; Kölln and Aarts Reference Kölln and Aarts2021; Lagos Reference Lagos2003; Mattes and Bratton Reference Mattes and Bratton2007), changes in economic inequality (Han and Chang Reference Han and Chang2016), sectoral performance (Wagner et al Reference Wagner, Schneider and Halla2009), the provision of public services (Lühiste Reference Lühiste2014; Weitz-Shapiro Reference Weitz-Shapiro2008), and the handling of major crises (Armingeon and Guthmann Reference Armingeon and Guthmann2014).
On the input side, most studies have focused on electoral institutions. Winning elections is associated with higher satisfaction with democracy (Anderson et al Reference Anderson, Blais, Bowler, Donovan and Listhaug2005; Dahlberg and Linde Reference Dahlberg and Linde2017; Kern and Kölln Reference Kern and Kölln2022), but those effects tend to be moderated by various institutional factors that structure electoral competition (Esaiasson Reference Esaiasson2011; Esaiasson et al Reference Esaiasson, Gilljam and Persson2012; Leemann and Stadelmann-Steffen Reference Leemann and Stadelmann-Steffen2021; Nadeau et al Reference Nadeau, Daoust and Dassonneville2021). Previous studies have found that democratic satisfaction is also related to citizens’ perceptions of procedural fairness (Dahlberg et al Reference Dahlberg, Linde and Holmberg2015; Magalhães Reference Magalhães2016; Norris Reference Norris2011) and corruption (Linde and Erlingsson Reference Linde and Erlingsson2013). Other research shows that institutional features that shape the democratic qualities of political processes (and not only their outcomes) are also associated with differences in democratic satisfaction, such as electoral systems that foster co-operation through proportional representation (Aarts and Thomassen Reference Aarts and Thomassen2008) and party systems that offer more choices for voters (Ezrow and Xezonakis Reference Ezrow and Xezonakis2011).
Contemporary democracies, however, not only depend on aggregative institutions (such as elections) to produce collective decisions, but also involve deliberative practices – understood in a broad sense to encompass propositional forms of communication – that shape individual and collective preferences (Dewey Reference Dewey1927; Habermas Reference Habermas1994; Warren Reference Warren2017). While we have a robust literature on the relationship between electoral institutions and citizens’ satisfaction with democracy, few studies have looked into the relationship between the deliberative components of democracy and citizens’ democratic satisfaction.
Democracy and the Public Sphere
Our central claim is that the deliberative features of mass democracies are part of citizens’ experience of democratic politics and thus are likely to be associated with differences in democratic satisfaction. For the purposes of this article, we use the term ‘public sphere’ as a short-hand expression to refer to the various sites – parties, media, governments, interest groups, and informal networks – in which individual and collective preferences are expressed and transformed through talk-based interactions (Hendriks Reference Hendriks2006; Neblo Reference Neblo2015; Parkinson and Mansbridge Reference Parkinson and Mansbridge2012). Propositional forms of communication are especially important for deliberative democrats, as they generally regard the principle of mutual justification – that is, the idea that ‘citizens and their representatives are expected to justify the laws they would impose on one another by giving reasons for their political claims and responding to others’ reasons in return’ – as a requirement of democratic legitimacy (Thompson Reference Thompson2008, 498). However, talk-based interactions also perform key normative functions in other theories of representative democracy, as we discuss in more detail below. One does not need to be a deliberative democrat to be concerned about the democratic implications of various aspects of the public sphere, such as violations to freedom of expression (Dahl Reference Dahl1973), the spread of misinformation (Jerit and Zhao Reference Jerit and Zhao2020; Kuklinski et al Reference Kuklinski, Quirk, Jerit, Schwieder and Rich2000), the erosion of civil society (Berman Reference Berman1997; Putnam et al Reference Putnam, Leonardi and Nanetti1993), the strength and behaviour of social movements (Della Porta Reference Della Porta2022), the prevalence of political conversation in everyday life (Bennett et al Reference Bennett, Flickinger and Rhine2000; Kim et al Reference Kim, Wyatt and Katz1999; Wyatt et al Reference Wyatt, Katz and Kim2000), or the decline in the quality of public discourse (Kalmoe and Mason Reference Kalmoe and Mason2024; Skytte Reference Skytte2021, Reference Skytte2022).
This notion of the public sphere as a constellation of actors, practices, and institutions that promote talk-based interactions draws on the turn in normative democratic theory towards deliberative systems, which has pushed the study of political deliberation beyond discrete and highly structured minipublics to analyse features of deliberation across a range of differentiated but interconnected institutional sites (Bächtiger and Parkinson Reference Bächtiger and Parkinson2019; Dryzek Reference Dryzek2009; Habermas Reference Habermas2023; Parkinson and Mansbridge Reference Parkinson and Mansbridge2012). This systemic turn has contributed to bringing theories of deliberative democracy back to their original ambitions of enhancing and understanding democracy at the large scale (Chambers Reference Chambers2009, 332–3; Boswell and Corbett Reference Boswell and Corbett2017, 803; Habermas Reference Habermas2006, 415–18). Our conceptualization of the public sphere as a deliberative system is closest to what Bächtiger and Parkinson (Reference Bächtiger and Parkinson2019, 135–6) refer to as an ‘additive’ view, in which a wide array of actors engage across multiple sites in various kinds of communicative interactions that complement and balance other democratic practices at different stages of collective decision-making processes (see, for example Warren Reference Warren2017). However, the central insight that we draw from that literature is the idea that the democratic goods and functions of political deliberation develop through myriad talk-based interactions, involving different forms of communication, and occurring across several sites – a point shared by most strands of deliberative democratic theory today.Footnote 1
By structuring processes of preference and will formation, the public sphere becomes an important part of mass democracies for both intrinsic and instrumental reasons. On the one hand, the extent to which citizens are able to form political preferences through practices that minimize coercion and manipulation is an important aspect of democratic politics. In this regard, the public sphere can provide normative goods that citizens intrinsically value and associate with democratic citizenship, such as intersubjective recognition, discursive accountability, greater political efficacy, an enlightened understanding of politics, and social integration. Some of these democratic goods are built into the principle of mutual justification in theories of deliberative democracy (Thompson Reference Thompson2008, 504).
However, these goods are also necessary for other practices and institutions of representative democracy. In particular, competitive elections are meaningful forms of political participation only if citizens face alternative choices in the ballot box, are aware of those differences, and have been able to publicly discuss the merits and pitfalls of those options (Warren Reference Warren2017). Hence, one does not need to buy into the normative standards of deliberative democracy to expect these aspects of the public sphere to matter for citizens’ experiences of democratic politics.
We can organize these democratic goods and functions in terms of three features of the public sphere that vary across political systems and over time: pluralism, information, and respect. These features refer to the normative functions that Mansbridge and her collaborators associated with deliberative systems in their seminal text (Mansbridge et al Reference Mansbridge, Bohman, Chambers, Christiano, Fung, Parkinson, Thompson, Warren, Parkinson and Mansbridge2012, 10–12): an epistemic function, related to the production of ‘preferences, opinions, and decisions that are appropriately informed by facts and logic and are the outcome of substantive and meaningful consideration of relevant reasons’ (labelled ‘information’ in our framework); an ethical function, related to the promotion of mutual respect among citizens (labelled ‘respect’ below); and a democratic function, associated with the ‘inclusion of voices, interests, concerns, and claims on the basis of feasible equality’ (which we refer to as ‘pluralism’). We can also associate with these three features other normative principles that have been highlighted by alternative approaches in deliberative democratic theory – for example, equal opportunity and inclusivity (Young Reference Young2002) or the emancipatory functions of discursive accountability, which are both related to ‘pluralism’ (Bächtiger and Parkinson Reference Bächtiger and Parkinson2019, 35–6).
It is worth pointing out that, while these features of the public sphere are necessary conditions for a political system to meet standards of democratic deliberation, they are not sufficient to ascertain that public deliberation is effectively carrying out the legitimation functions postulated by theories of deliberative democracy (Habermas Reference Habermas1996). To empirically establish that, we would need to ascertain whether political decisions indeed reflect the content of prior deliberative processes (Bächtiger and Parkinson Reference Bächtiger and Parkinson2019, 88; Fleuß and Helbig Reference Fleuß and Helbig2021, 14). Our goal in this article is not to assess the extent to which countries meet the legitimation standards of deliberative democracy. Rather, our goal is to identify features of national public spheres that (1) provide intrinsically important democratic goods and (2) perform necessary functions for the operation of other aspects of the democratic system. In the following paragraphs, we elaborate on the normative goods and functions that these features of the public sphere are expected to provide in a democracy, and we theorize why we expect them to shape citizens’ experiences with democratic politics. Having identified those features of national public spheres, we can then empirically evaluate to what extent they are related to citizens’ satisfaction with democracy.
Pluralism. Public spheres enable citizens to express their viewpoints, offering spaces for disagreement and for public criticism of political authorities. Equal opportunity to participate in processes of collective preference formation is central to deliberative democracy (Thompson Reference Thompson2008, 504–5). The expressive inclusion that more pluralistic public spheres provide is in itself an important democratic good, as it entails practices of intersubjective recognition through which any citizen’s interests and lived experiences can potentially be a matter of public concern that merits a response by political authorities (Benhabib Reference Benhabib1997, 9–10; Young Reference Young2002, 67). At the same time, a pluralistic public sphere is necessary for other democratic institutions – most notably suffrage – to serve as a means of political inclusion. If only certain issues enter the political agenda because few groups have access to the public sphere, the outcomes of competitive elections will not reflect the range of preferences of the electorate (Christiano Reference Christiano1996, 90).
Similarly, the ability to publicly dissent, to criticize government officials, and to demand that they justify their decisions, is intrinsic to any understanding of democracy as self-government, especially in representative democracies (Bächtiger and Parkinson Reference Bächtiger and Parkinson2019, 35–6; Chambers and Kopstein Reference Chambers and Kopstein2023, 226). Public spheres that encourage public criticism are necessary for elections to serve as mechanisms of vertical accountability and responsiveness (Hiaeshutter-Rice et al Reference Hiaeshutter-Rice, Soroka and Wlezien2021). It is only if citizens can criticize the performance of government officials and attempt to convince their fellow citizens to withdraw their support that elections empower their political inclusion (Warren Reference Warren2017, 44).
National public spheres vary in the extent to which social groups can express their claims and thematize them as matters of public interest. This variation is not merely a matter of juridical protections to freedom of expression, but it is also a function of structural barriers that may limit access for certain groups. Media dependence on state advertising; the politicization of public media, news agencies, and media regulators; the abuse of defamation and libel laws; violations of professional secrecy and conscience laws; and other kinds of harassment may have a similar chilling effect on the press and limit the ability of opposition groups to criticize political power (Hallin and Mancini Reference Hallin and Mancini2004, 41–4; Norris Reference Norris2009, 16–17). High entry barriers for new media may limit opportunities for alternative perspectives to be raised (Baker Reference Baker2006, 7–8). If the electoral system creates incentives for political parties to position themselves in the ideological centre (Lupu Reference Lupu2016, 28) or if party elites smother internal debate (Wolkenstein Reference Wolkenstein2018), certain viewpoints and interests may lack organizational vehicles to participate in public debates (Leydet Reference Leydet2021). In non-programmatic and volatile party systems, citizens may find multiple choices when casting their ballots, but those alternatives may not really represent distinct platforms (Roberts Reference Roberts2014).
There is evidence that pluralism matters for citizens’ assessments of democracy. As noted above, party systems that offer more options for voters tend to be associated with higher satisfaction with democracy (Ezrow and Xezonakis Reference Ezrow and Xezonakis2011). Along those lines, experimental studies show that people tend to be more satisfied with collective decisions, even when their preferred outcomes are not chosen, if they perceive that their views were fairly discussed (Merkley et al Reference Merkley, Cutler, Quirk and Nyblade2019). Other survey research shows that cultural and sexual minorities tend to value the opportunity to voice alternative perspectives in the public sphere, while citizens dissatisfied with government performance tend to emphasise the importance of having parties and media that can criticize public officials (Goenaga Reference Goenaga2022).
Information: Public spheres provide information on matters of public interest. The public provision of reliable information depends on a wide range of actors and institutions: governmental agencies in charge of collecting and publishing reliable data (Brambor et al Reference Brambor, Goenaga, Lindvall and Teorell2020), robust transparency laws (Berliner Reference Berliner2014; Hollyer et al Reference Hollyer, Rosendorff and Vreeland2017), viable media outlets devoted to the coverage of public affairs with high journalistic standards (Cagé Reference Cagé2020; Curran Reference Curran2011), impartial media oversight bodies (Hallin and Mancini Reference Hallin and Mancini2004, 35–3), and formal and informal rules against the spread of false information. Crucially, well-functioning public spheres provide reliable information not only about issues but also about the political views of the different actors involved in the debate (Thompson Reference Thompson2008, 507). More broadly, the principle of publicity that underpins more informative public spheres forces officials to publicly provide reasons to legitimate their decisions (Habermas Reference Habermas1996, 151).
Access to reliable information enables people to understand the decisions and processes that affect their lives, to discover other participants’ preferences and perspectives, and to potentially transform or at least clarify their own (Bächtiger and Parkinson Reference Bächtiger and Parkinson2019, 33–4). Information is thus intrinsically valuable, to the extent that it represents a key component of citizens’ political efficacy (Christiano Reference Christiano1996, 84–5).
Access to information is also necessary for elections to serve democratic functions (Dahl Reference Dahl1989, 111–12). Dis- and misinformation undermine the development of coherent political preferences, and they hinder citizens’ ability to link their political preferences to their vote choice (Carlin et al Reference Carlin, Hellwig, Love, Martínez-Gallardo and Singer2021; Jacobs et al Reference Jacobs, Matthews, Hicks and Merkley2021). Most importantly, the fairness of elections depends on a public sphere that can scrutinize and denounce violations of the electoral process, while the legitimacy of electoral results depends on citizens’ trust that any such allegations can be verified and confirmed (Coffé Reference Coffé2017; Norris et al Reference Norris, Garnett and Grömping2020). Recent misinformation campaigns in electoral democracies such as the United States and Brazil sowed doubts about the integrity of electoral outcomes, feeding distrust within the population and triggering attacks on representative institutions (Chambers and Kopstein Reference Chambers and Kopstein2023, 8).
Survey research shows that citizens see access to reliable information as one of the most important aspects of living in a democracy (Goenaga Reference Goenaga2022, 240). Even if individuals cannot always discern low- versus high-quality information, unreliable public spheres that are cluttered with misinformation tend to sow distrust and push people away from democratic processes (Bennett and Livingston Reference Bennett and Livingston2018; Chambers and Kopstein Reference Chambers and Kopstein2023; Wagner and Boczkowski Reference Wagner and Boczkowski2019). Indeed, the perceived influence of misinformation on oneself and others has been found to be as pernicious for democratic attitudes as the direct impact of misinformation (Nisbet et al Reference Nisbet, Mortenson and Li2021).
Respect: Finally, public spheres can contribute to social integration if the communicative interactions that define them are characterized by respectful forms of dialogue (Habermas Reference Habermas2023, 10–11). While some deliberative theorists take a more demanding view in which mutual respect requires from participants a willingness to appreciate the viewpoints of those with whom they disagree (Gutmann and Thompson Reference Gutmann and Thompson1998), others argue that respectful public spheres must at least discourage forms of speech ‘that imply that one’s opponents are less than human or that their views do not deserve an equal hearing because of who they are’ (Young Reference Young2002, 48). Hence, even in cases of vigorous criticism, formal and informal rules may be in place to sanction harmful, hateful, defamatory, libellous, or other uncivil forms of speech, as well as to prevent the use of media platforms to harass certain groups or to make calls for violence.
Fostering mutual respect through public debate is a democratic good in itself (Rostbøll Reference Rostbøll2023). This aspect of the public sphere enacts the moral principle that citizens must be recognised as autonomous agents with equal standing as sources of reasons and claims and with equal rights to take part in self-legislation, either directly or through representatives (Mansbridge et al Reference Mansbridge, Bohman, Chambers, Christiano, Fung, Parkinson, Thompson, Warren, Parkinson and Mansbridge2012, 11). Moreover, respectful public debate, in which participants are willing to justify their political opinions to their fellow citizens and to consider others’ perspectives and reasons, contributes to social integration by keeping people ‘at the table’, trying to resolve disagreement through persuasion (Bächtiger and Parkinson Reference Bächtiger and Parkinson2019, 31–2; Habermas Reference Habermas2023, 78; Gutmann and Thompson Reference Gutmann and Thompson2009, 80; Parkinson and Mansbridge Reference Parkinson and Mansbridge2012, 11). By promoting respectful communication, public spheres can help citizens identify common interests and thus counteract the polarizing tendencies inherent in the adversarial dynamics of competitive elections (Mansbridge Reference Mansbridge1983, 26–8). Conversely, public spheres in which uncivil forms of speech are prevalent undermine mutual respect and exacerbate adversarial politics (Gervais Reference Gervais2019).
Empirical research has shown that the respectfulness of public debate affects citizens’ political attitudes. Exposure to incivility is associated with more negative views about the quality of public debate (Brooks and Geer Reference Brooks and Geer2007), lower political interest (Feinberg and Frimer Reference Feinberg and Frimer2023), higher affective polarization between out-partisans (Skytte Reference Skytte2022), and lower political trust (Mutz and Reeves Reference Mutz and Reeves2005; Skytte Reference Skytte2021; Turkenburg et al Reference Turkenburg, Goovaerts and Marien2025), with more ambiguous effects on political participation (Brooks and Geer Reference Brooks and Geer2007; Van’t Riet and Van Stekelenburg Reference Van’t Riet and Van Stekelenburg2022). Hence, there are reasons to expect that the extent to which the public sphere is characterized by respectful interactions should be associated with differences in satisfaction with democracy.
Ideally, more democratic public spheres will tend to be more pluralistic, informative, and respectful, and we would expect these features to be mutually reinforcing in many situations. By incorporating more voices, more pluralistic public spheres cultivate more sources of information for the citizenry. Similarly, more respectful forms of debate should in principle avoid vitriolic forms of speech that may smother the informative functions of the public sphere.
However, these features may at times be at odds with each other (Thompson Reference Thompson2008, 509). Broadening access to more voices can make it more difficult to establish and enforce standards for the quality of information (Habermas Reference Habermas2023, 38). ‘Fish-bowl transparency’ may hinder decision-making procedures that require trust among participants (De Fine Licht et al Reference De Fine, Jenny, Esaiasson and Gilljam2014; Mansbridge and Martin Reference Mansbridge and Martin2015). Public spheres that are open to vigorous criticism of authorities may turn political scandals into the dominant form of public debate, undermining social integration and increasing polarization (Kumlin and Esaiasson Reference Kumlin and Esaiasson2012). Highly regulated public spheres that discourage loud expressions of disagreement effectively carry out censorship under the pretence of respectability, smothering public criticism and silencing subordinate groups (Young Reference Young2002, 48–9). Conversely, certain forms of uncivil speech may be necessary at times to open spaces for marginalized voices, to draw attention to urgent grievances, and to encourage political engagement (Bentivegna and Rega Reference Bentivegna and Rega2024, 88–9; Chen et al Reference Chen, Gina, Wilner, Pariser and Stroud2019, 2–3). Therefore, different combinations of these features may develop across countries and over time.
It seems then reasonable that these features of the public sphere will be part of how citizens experience and evaluate democratic politics. Citizens are likely to value the political inclusion that comes from having their viewpoints voiced in the public sphere. Access to reliable information is likely to increase citizens’ sense of political efficacy, while its absence is likely to be associated with distrust of and disengagement from democratic institutions. Similarly, respectful deliberation may foster social integration, making political engagement more satisfying.
In electoral democracies, more pluralistic, informative, and respectful public spheres will also be associated with greater satisfaction with democracy because they are likely to contribute to the effectiveness of elections as democratic institutions. By allowing citizens to introduce new issues to the political agenda and fostering the crystallization of alternative perspectives, public spheres will put on display the choices that citizens face in the ballot box. By providing reliable information, public spheres will also affect citizens’ ability to link their preferences to votes, making elections an intelligible experience for the citizenry. Finally, respectful public debates will compensate for the adversarial nature of electoral competition.
Hence, our main hypothesis is that, in electoral democracies, higher levels of pluralism, information, and respect in the public sphere should be associated with higher levels of satisfaction with democracy. We expect these associations to hold even after accounting for other aspects of democracy, such as elections and constitutional constraints.
A New Cross-National Dataset of National Public Spheres (2000–20)
A common challenge in the literature on deliberative systems is how to measure features of deliberation at the macro level and across multiple institutional sites. This section presents a measurement strategy that seeks to meet that challenge.
A large body of research has offered detailed empirical measures of the quality of deliberation in specific settings. An early contribution was the Discourse Quality Index, which relied on careful content analyses to measure deliberative characteristics in parliamentary debates (Steenbergen et al Reference Steenbergen, Bachtiger, Sporndli and Steiner2003). More recent work has analysed changes over time in incivility in television debates (Goovaerts and Turkenburg Reference Goovaerts and Turkenburg2023; Marien et al Reference Marien, Goovaerts and Elstub2020), parliamentary debates (Poljak and Walter Reference Poljak and Walter2024), TV news (Poljak Reference Poljak2025), and online (Frimer et al Reference Frimer, Aujla, Feinberg, Skitka, Aquino, Eichstaedt and Willer2023; Nithyanand et al Reference Nithyanand, Schaffner and Gill2017), as well as differences between communication channels (Walter and Vliegenthart Reference Walter and Vliegenthart2010; Walter and van der Eijk Reference Walter and van der Eijk2019) and countries (Walter Reference Walter2014). Other research has tracked changes in coverage of alternative perspectives in newspapers (de Vries et al Reference de Vries, Vliegenthart and Stefaan2022; de Vries and Thesen Reference de Erik and Thesen2025), the epistemic qualities of televised election debates (Marien et al Reference Marien, Goovaerts and Elstub2020; Turkenburg and Goovaerts Reference Turkenburg and Goovaerts2024), and the spread of false news stories online (Vosoughi et al Reference Vosoughi, Roy and Aral2018). All of these studies capture features of public debate by focusing directly on the properties of speech acts themselves. This approach allows scholars to precisely measure the qualities of deliberation in a specific institutional site. However, it faces the daunting challenge of scaling up those assessments for an entire deliberative system. Generating valid measures of the properties of public debate at the national level would require the analysis of speech acts across all sites of public deliberation (media, parties, government, informal networks). Even V-Dem’s Index of the Deliberative Component of Democracy (Coppedge et al Reference Coppedge, Lindberg, Skaaning and Teorell2016), which builds on the Discourse Quality Index to provide country-level estimates of deliberative features, has been criticized because its component indicators do not measure the quality of deliberation at all levels (Fleuß and Helbig Reference Fleuß and Helbig2021).
Rather than analysing speech acts directly, we focus on the behavioural and institutional contexts that shape the different sites of the public sphere. To the extent that they correlate with communicative patterns in those locations, these behavioural and institutional indicators allow us to measure features of national public spheres as large-scale deliberative systems, across countries, and over time. In Appendix B, we provide evidence that the patterns captured by our indexes of pluralism, information, and respect align with findings from prior studies that examined these dimensions through analyses of speech acts in specific cases.
Scholars have produced many cross-national measures of various aspects of public spheres. However, those indicators usually focus on only one aspect of public debate (for example, government transparency) or centre only on one institutional site (for example, the media). Therefore, to produce yearly measures of pluralism, information, and respect at the country level, we first selected fifty-two indicators that captured aspects related to each of these three features and that covered all the different institutional sites of the public sphere: governments, political parties, the media (print, broadcast, digital, and social media), and civil society. The indicators come from Version 11 of the V-Dem Project (Coppedge et al Reference Coppedge, Gerring, Knutsen, Lindberg, Teorell, Alizada, Altman, Bernhard, Agnes Cornell, Gastaldi, Gjerløw, Glynn, Hicken, Hindle, Ilchenko, Krusell, Lührmann, Maerz, Marquardt, McMann, Mechkova, Medzihorsky, Paxton, Pemstein, Pernes, von Römer, Seim, Sigman, Skaaning, Staton, Sundström, Tzelgov, Wang, Wig, Wilson and Ziblatt2021), all the reports from the Media Pluralism Monitor (MPM) up to 2020 (Brogi and Dobreva Reference Brogi and Dobreva2015; Brogi et al Reference Brogi, Ginsborg, Ostling, Parcu and Simunjak2016, Reference Brogi, Bania, Nenadic, Ostling and Parcu2017, Reference Brogi, Nenadic, Parcu and de Azevedo Cunha2018, Reference Brogi, Carlini, Nenadic, Parcu and de Azevedo Cunha2020; Bleyer-Simon et al Reference Bleyer-Simon, Brogi, Carlini, Nenadic, Palmer, Parcu, Verza, de Azevedo Cunha and Zuffová2021), the Transparency Index developed by Hollyer et al (Reference Hollyer, Rosendorff and Vreeland2017), the Information Capacity Index from Brambor et al (Reference Brambor, Goenaga, Lindvall and Teorell2020), the Sustainable Governance Indicators (SGI) (Schiller and Hellman Reference Schiller and Hellman2020), the Freedom of the Press (FOTP) indexes published by Freedom House (Freedom House 2017, 2021), the Media Sustainability Index (MSI) (International Research and Exchanges Board 2022), and the E-government Index from the United Nations (UN) (Department of Economic and Social Affairs 2020).Footnote 2
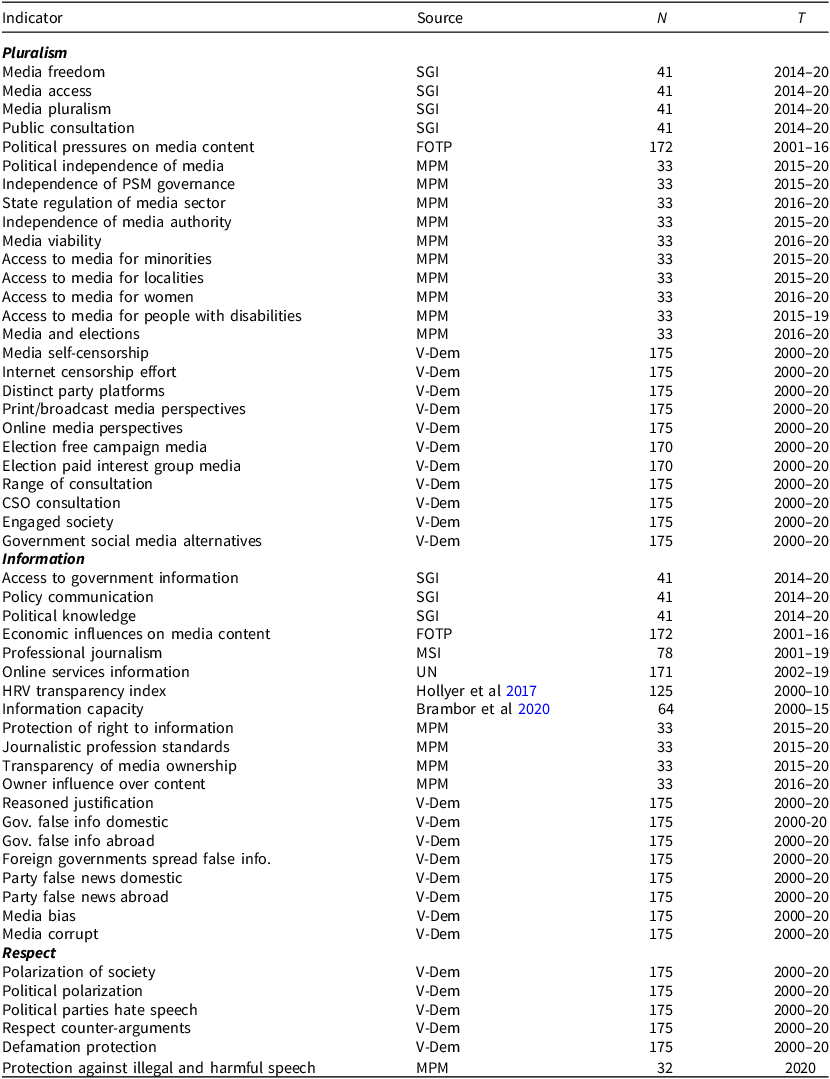
Table 1 lists the observed indicators that underpin each aspect of the public sphere, the original source, and the number of countries and years covered. The selection of indicators is driven by three rules. First, the description of the indicators in the original source should specifically refer to one of the three dimensions of public debate; that is, it should refer to the normative functions associated with each dimension of public debate: the inclusion of diverse – and even opposition – voices and perspectives (pluralism), the epistemic qualities of debate (information), or the recognition of participants in the public sphere as legitimate interlocutors (respect). Hence, we excluded composite indexes and general indicators about the overall quality of public debate (for example, the Press Freedom Index from Reporters sans frontières 2021). Secondly, each index should include indicators pertaining to each site of the public sphere: governments, media, parties, and civil society. Thirdly, there should be data for multiple countries for each indicator. Hence, we give preference to sources with greater coverage.
Indicators used to estimate features of the public sphere

Table 1. Long description
The table presents a comprehensive list of indicators related to media and information, along with their sources, sample sizes (N), and time spans (T). The table is organized into several categories: Pluralism, Information, and Respect. Each row lists an indicator, the source of the data, the sample size, and the time span covered. The indicators include various aspects of media freedom, access, pluralism, and public consultation, as well as information access, political knowledge, and media content influences. The sources range from SGI and FOTP to V-Dem and MPM, with sample sizes varying from 32 to 175 and time spans from 2000 to 2020. Notable trends include the frequent use of V-Dem as a source and the consistent time span of 2000 to 2020 for many indicators. The table provides a detailed overview of the metrics used to assess media and information environments across different contexts.
To capture pluralism, we focused on indicators related to the presence of alternative perspectives in the party system, access for different groups to media platforms, the range of government consultation with civil society, and the extent of public criticism. The variable description in the original sources should explicitly refer to issues of access to the public sphere for different kinds of actors, including opposition voices, or obstacles to voicing alternative viewpoints due to the influence of economic or political interests. To capture the quality of information, we sought explicit mentions of the epistemic aspects of public debate in the original sources, such as the presence of public institutions in charge of the production of information, government transparency, media impartiality and journalistic professionalism, and the dissemination of false news by different actors. To measure respect, we included indicators that refer to both a thinner understanding of respect in terms of the civility of public discourse (harmful, illegal, and hate speech, online harassment, and polarization), as well as indicators related to the thicker understanding of respect related to actors’ openness to counter-arguments. Detailed descriptions of each indicator are presented in Appendix A.
The next step was to aggregate the different indicators into single variables that would capture the underlying properties of theoretical interest. In other words, we treat pluralism, information, and respect as latent traits of the public sphere that can be estimated through our set of observed indicators. This aggregation strategy seeks to operationalise the core insight of the literature on deliberative systems that, at the macro level, the normative functions of deliberation can be achieved through various institutional combinations (Dryzek Reference Dryzek2009, 1381).
To generate our measures of pluralism, information, and respect in the public sphere, we draw on Hanson and Sigman’s (Reference Hanson and Sigman2021) implementation of Arel-Bundock and Mebane’s (Reference Arel-Bundock and Mebane2011) Bayesian Markov-Chain Monte Carlo (MCMC) techniques to estimate latent variables from a set of indicators with non-random missing observations.
The intuition is that each observed indicator x k can be modelled as a linear function of one of our theorized latent variables (pluralism, information, or respect) and some error. Hence, we run three separate one-dimensional models (one for each feature of the public sphere), in which we assume a single latent variable for each set of observed indicators. Equation (1) to (3) present the models. In the three equations, x kit is one of our observed indicators k for country i in year t. c k is an intercept with independent diffuse normal priors with mean zero, and ϵ kit is the disturbance term with independent uniform priors with mean zero. The term λ k represents the predicted relationship between the latent variable (denoted in the subscript) and the observed indicator k. We assign diffuse normal priors and constrain them to be positive. This sets the scale of the latent variable so that higher values correspond with more pluralistic / informative / respectful public spheres. Finally, ξ it represents the estimated value of the latent variable ξ for country i in year t. We assign standard normal priors to the three latent variables.
 $$x_{kit} = c_{k} + \lambda _{k}\xi _{PLURALISMit} + \varepsilon _{kit}$$
 $$x_{kit} = c_{k} + \lambda _{k}\xi _{INFORMATIONit} + \varepsilon _{kit}$$
 $$x_{kit} = c_{k} + \lambda _{k}\xi _{RESPECTit} + \varepsilon _{kit}$$
The MCMC techniques are run in JAGS for R. For each aspect of the public sphere, we run three chains with an adaptation phase of 5,000 iterations, a burn-in phase of 10,000 iterations, and a sampling phase of 5,000 iterations with a thinning setting of 10. All the underlying indicators are standardized beforehand. For the three features of the public sphere, the chains converged for all the parameters. This was ascertained through visual inspection of the trace plots and verified statistically using the Gelman–Rubin convergence diagnostic (r). Details on the model specifications, diagnostics, sensitivity analyses regarding potential violations to the local independence assumption (LIA), and other technical information are provided in Appendix A.
In the next section and in Appendix B, we follow McMann et al (Reference McMann, Pemstein, Seim, Teorell and Lindberg2022) to assess the validity and reliability of our measures of the public sphere. To this end, we (1) compare our measures against qualitative evidence from individual cases; (2) examine how our measures relate to one another and how this relationship changes over time; (3) examine their correlation with the underlying indicators; and (4) compare them to alternative sources that measure related issues.
The Transformation of National Public Spheres (2000–20)
This section presents descriptive patterns of the evolution of the three features of the public sphere from 2000 to 2020. As expected, the three indexes are correlated with each other, as these features of the public sphere are likely to be mutually reinforcing in many situations. At the same time, the pairwise Pearson coefficients between each index vary substantially, hovering around 0.85 (pluralism and information), 0.60 (information and respect), and 0.40 (pluralism and respect).Footnote 3 This indicates that these measures capture distinct aspects of the public sphere, as we also show in the discussion of specific cases below and in Appendix B.
Figure 1 presents the values for pluralism, information, and respect (y-axes) at the beginning (in red) and at the end (in black) of the period. The x-axis measures the extent to which these countries could be deemed ‘electoral democracies’ based on V-Dem’s index of clean elections (Coppedge et al Reference Coppedge, Gerring, Knutsen, Lindberg, Teorell, Alizada, Altman, Bernhard, Agnes Cornell, Gastaldi, Gjerløw, Glynn, Hicken, Hindle, Ilchenko, Krusell, Lührmann, Maerz, Marquardt, McMann, Mechkova, Medzihorsky, Paxton, Pemstein, Pernes, von Römer, Seim, Sigman, Skaaning, Staton, Sundström, Tzelgov, Wang, Wig, Wilson and Ziblatt2021). This index offers the advantage of capturing the quality of elections separately from the democratic practices and institutions that constitute the public sphere. The figures include Lowess smoothers to capture overall patterns.
Public spheres and free and fair elections worldwide (2000 and 2020).
Note: red text refers to the posterior estimates for each country in 2000, while the black text refers to the same values in 2020. The red line is a Lowess smoother for the 2000 observations, while the black line is a Lowess smoother for the 2020 observations.

Several results are worth highlighting. First, there is a correlation between clean elections and the three features of the public sphere, as indicated by the upward Lowess lines. This is to be expected given the instrumental functions that each of these features of the public sphere perform in order to make electoral institutions meaningful vehicles for democratic participation.
Secondly, we find smaller variations among countries at the highest values of the Index of clean elections for pluralism and information. This is not the case, however, for the respectfulness of public debate (bottom panel), where we find large variation within electoral and non-electoral regimes. There are non-electoral regimes in which public debates appear to adopt highly respectful tones (for example, Qatar and Saudi Arabia), most likely because these countries restrict uncivil discourse along with any expression of dissent. This finding underscores the point that democratically desirable features of public debate may not always develop in tandem. Similarly, some electoral regimes show low scores in the respectfulness index (for example, Poland, Brazil, Slovenia, and the United States), which we discuss in more detail below.
Thirdly, when it comes to pluralism (upper-left panel), there was little change on average between 2000 and 2020, as shown by the almost overlapping black and red Lowess curves. When it comes to the quality of information (upper-right) and the respectfulness (lower-left) of public debate, we observe downward shifts even among many electoral democracies.
Figure 2 focuses only on forty-four electoral democracies (countries that maintained scores above 0.8 in the Index of clean elections from 2000 to 2020). Overall, we observe little change when it comes to pluralism, without any clear pattern of improvement or decline. Conversely, when it comes to the quality of information and especially the respectfulness of public debate, we see a more pronounced story of decline. In some cases, such as Brazil, the United States, Slovenia, and the Czech Republic, the decline in these two dimensions was substantial. In all of these cases, prominent political actors contributed to the erosion of public debate before coming to power and then continued to attack independent media and opponents once in office.
Changes in the public sphere among electoral democracies (2000–20).
Note: only countries with scores of 0.8 or above in the Index of clean elections throughout the period are included.

Figure 3 zooms into four countries from 2000 to 2020 that illustrate the global patterns displayed in Figures 1 and 2. We include three electoral democracies – Sweden, the United States, and Brazil – and one non-democratic country – Russia – for comparison. The bands represent one posterior standard deviation around the estimated latent scores.
Evolution of the national public spheres in four countries (2000–20).

The top-left panel shows modest change in the pluralism of national public spheres in Sweden and the United States, with a slight decline in the latter case during the 2016–20 period. Brazil experienced a period of improvement that coincides with the years in which the Workers’ Party (PT) was in power (2002 to 2015), which broadened the scope of popular participation. In 2015, a sharp decline pulled the country back to similar levels to where it was at the turn of the century. In the Russian case, we observe a sustained decline starting at already low values of pluralism.
As noted above, the biggest changes for electoral democracies occurred in relation to the quality of information and the respectfulness of public debate. In the top-right panel, only the Swedish case displays very little change in the quality of information. Instead, we see a steady decline in the United States that begins in the run-up to the 2016 election. This is indeed the period in which high-profile scandals of ‘fake news’ became a major concern of American politics (Bennett and Livingston Reference Bennett and Livingston2018, 124).
Similarly, Brazil experienced a dramatic erosion in the quality of information. From March 2015 to May 2016, Brazil was shaken by mass protests against corruption scandals that ultimately led to the impeachment of President Dilma Rousseff. During and after the impeachment process, misinformation rose to unprecedented levels, in which unsubstantiated accusations against politicians spread in traditional and social media (Albuquerque Reference de Albuquerque2017). The 2018 presidential election marked a low point for the quality of information, as Jair Bolsonaro’s campaign overtly disseminated false information to attack his opponent (Davis and Straubhaar Reference Davis and Straubhaar2020). Once in power, Bolsonaro continued to erode the informational functions of the public sphere, especially during the COVID-19 pandemic (Ricard and Medeiros Reference Ricard and Medeiros2020).
Finally, we see a steep decline in the quality of information in Russia, which started from already much lower levels. This decline accelerated after the Georgian War and especially after the 2011–12 protests, when Putin tightened control over independent media and limited the flow of information in the country (Smyth and Oates Reference Smyth and Oates2015, 292).
The bottom panel measures the respectfulness of public debates in these countries. The estimates for this feature of the public sphere are less precise, since fewer indicators are used in the MCMC simulations. Having said that, only Sweden stands out by having a more respectful public sphere. The other three countries show very similar scores during this period, with Russia plateauing at low levels of respect after the Putin regime further repressed public dissent in 2012, while the decline in the respectfulness of the public sphere in the United States and Brazil began after 2008 and accelerated after 2015. These are periods of intense partisan polarization in both countries, as accusations against opponents of criminal offences increasingly became the bread-and-butter of political debate.
Public Spheres and Democratic Satisfaction
We now present the results of statistical analyses that examine the relationship between each feature of the public sphere and citizens’ satisfaction with democracy. We reproduce our analyses with data from two cross-national public opinion projects that rely on different instruments to measure democratic satisfaction: the European Social Survey (ESS) and the Comparative Study of Electoral Systems (CSES).Footnote 4 Whereas the ESS uses an eleven-point scale that asks respondents to rate how satisfied they are with democracy in their country, the CSES uses an ordinal variable in which respondents are asked ‘On the whole, are you very satisfied, fairly satisfied, not very satisfied, or not at all satisfied with the way democracy works in [country]?’ By drawing on these different surveys, we ensure that our conclusions are not driven by sample effects or by the wording of a specific survey instrument (Valgarðsson and Devine Reference Valgarðsson and Devine2021).
We restrict the analyses to countries that ran relatively clean, free, and fair elections at the time of the survey, as measured by a score of at least 0.8 in V-Dem’s Index of clean elections (Coppedge et al Reference Coppedge, Gerring, Knutsen, Lindberg, Teorell, Alizada, Altman, Bernhard, Agnes Cornell, Gastaldi, Gjerløw, Glynn, Hicken, Hindle, Ilchenko, Krusell, Lührmann, Maerz, Marquardt, McMann, Mechkova, Medzihorsky, Paxton, Pemstein, Pernes, von Römer, Seim, Sigman, Skaaning, Staton, Sundström, Tzelgov, Wang, Wig, Wilson and Ziblatt2021). We focus only on electoral regimes for three reasons. First, the samples of cross-national surveys that include questions about democratic attitudes tend to be skewed towards electoral democracies (over 80 per cent of respondents of the ESS and CSES come from countries with scores above 0.8 in the Index of clean elections). Secondly, respondents are likely to interpret differently questions about their satisfaction with democracy in contexts that do not meet even a minimal requirement of free and fair elections. Thirdly, even if responses to questions about democratic satisfaction are comparable across regimes, there are reasons to expect heterogeneity in the relationship between the different features of the public sphere and democratic satisfaction. In the absence of free and fair elections, more pluralistic or informative public spheres may be used to denounce the lack of institutional channels for political participation and thus decrease satisfaction with democracy. Additional analyses based on the full CSES and ESS samples suggest that this might indeed be the case (Appendix F).
For the analyses of the ESS data, respondents are nested in survey waves, which are nested in countries. For the CSES data, respondents are nested in elections, which are nested in countries. All our analyses implement linear multilevel models with random intercepts, since our main interest is in the effects of country-level factors – the characteristics of the public sphere – on democratic satisfaction, and include post-stratification weights.Footnote 5 Equation 4 presents the benchmark model specification. The term stfdem ijk is the dependent variable (satisfaction with democracy) for individual i, in country j, and wave/election k. β 0 is the intercept; β 1 ⋅ public_sphere_index ijk represents the effect of one of our indexes of pluralism, information, or respectfulness of the public sphere (the key independent variable). The public sphere variables have been standardized to have a mean of zero and a standard deviation of 1. β ⋅ X ijk represents a vector of control variables with their corresponding coefficients. ζ j is the country-level random intercept for country j, η k is the wave/election-level random intercept for wave/election k, and ϵ ijk is the residual error term.
 $${\rm stfdem}_{ijk} = \beta _0 + \beta _1 \cdot {\rm public\_sphere\_index}_{ijk} + \beta \cdot {\rm X}_{ijk} + \zeta _{j} + \eta _{k} + \epsilon _{ijk}$$
In the models presented in Tables 2 and 3, we control for socio-demographic characteristics (age, gender, education, and income) that are commonly associated with differences in satisfaction with democracy and with participation in the public sphere, as well as political ideology (measured by respondents’ self-placement in the left–right scale) and satisfaction with the economy. We control for respondents’ satisfaction with the economy because it is one of the strongest predictors of democratic satisfaction, and this kind of outcome-based concern is likely to substitute for the satisfaction derived from the normative goods provided by the public sphere. At the country level, we control for other factors that may influence satisfaction with democracy and be correlated with features of the public sphere: GDP growth, electoral system, and the effective number of electoral parties. Appendix C presents details about each variable and descriptive statistics.
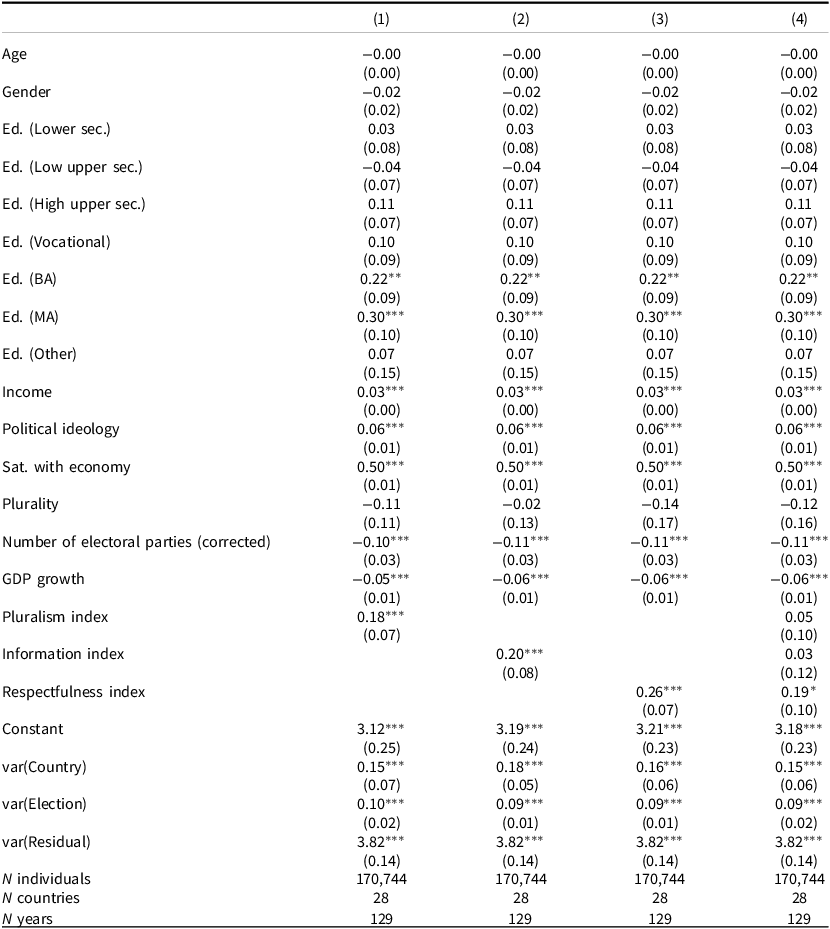
Relationship between the public sphere and democratic satisfaction. Data: ESS

Table 2. Long description
The table presents data on the relationship between various socio-demographic and political factors and their impact on satisfaction with democracy and public sphere participation. It includes four columns labeled (1), (2), (3), and (4), each representing different models. The rows are labeled with factors such as Age, Gender, Education (with various levels), Income, Political ideology, Satisfaction with the economy, Plurality, Number of electoral parties (corrected), GDP growth, Pluralism index, Information index, and Respectfulness index. Each row contains values and standard errors for each model. The table also includes a constant term and variance components for Country, Election, and Residual. The bottom of the table lists the number of individuals, countries, and years included in the analysis.
*p < 0.10, **p < 0.05, ***p < 0.01. All models include post-stratification weights. Respondents are nested in survey waves, which are nested in countries. Additional data sources: GDP growth (The World Bank 2024), electoral system (Cruz et al Reference Cruz, Keefer and Scartascini2021), and the effective number of electoral parties (Gallagher and Mitchell Reference Gallagher and Mitchell2008).
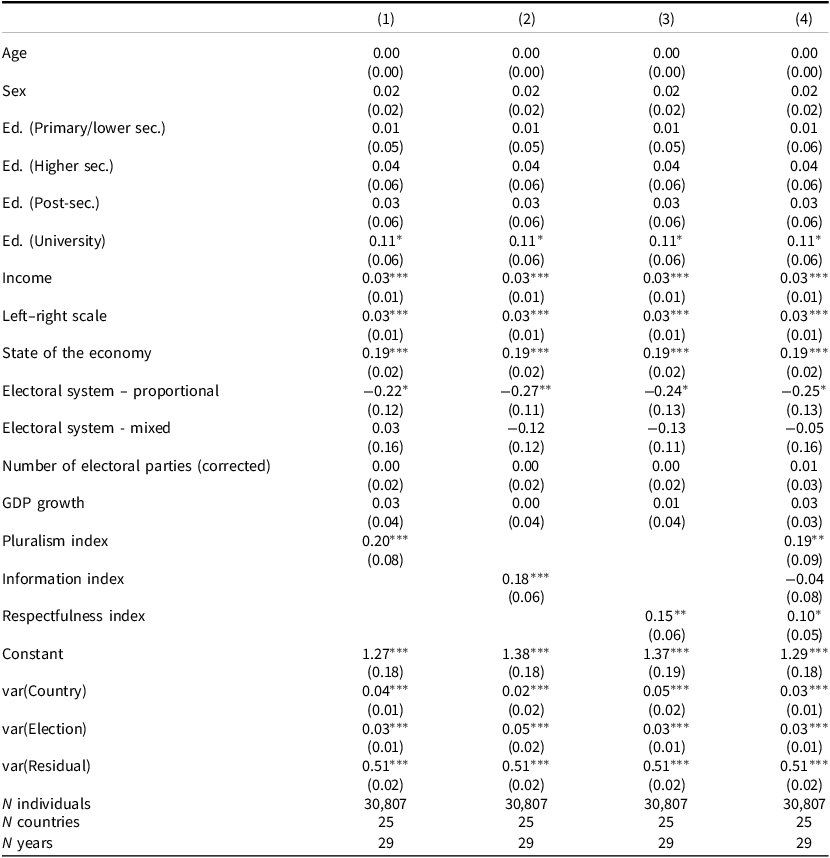
Relationship between the public sphere and democratic satisfaction. Data: CSES

Table 3. Long description
The table presents a comparison of various factors influencing a certain outcome across four different models. It includes columns labeled (1), (2), (3), and (4), each representing a different model. The rows are labeled with different factors such as Age, Sex, Education levels, Income, Left-right scale, State of the economy, Electoral system types, Number of electoral parties, GDP growth, Pluralism index, Information index, Respectfulness index, Constant, and variances for Country, Election, and Residual. Each cell contains a value and a standard error in parentheses. Row 1: Age, 0.00 (0.00) for all models. Row 2: Sex, 0.02 (0.02) for all models. Row 3: Ed. (Primary/lower sec.), 0.01 (0.05) for all models. Row 4: Ed. (Higher sec.), 0.04 (0.06) for all models. Row 5: Ed. (Post-sec.), 0.03 (0.06) for all models. Row 6: Ed. (University), 0.11* (0.06) for all models. Row 7: Income, 0.03*** (0.01) for all models. Row 8: Left-right scale, 0.03*** (0.01) for all models. Row 9: State of the economy, 0.19*** (0.02) for all models. Row 10: Electoral system – proportional, -0.22* (0.12) for model 1, -0.27** (0.11) for model 2, -0.24* (0.13) for model 3, -0.25* (0.13) for model 4. Row 11: Electoral system - mixed, 0.03 (0.16) for model 1, -0.12 (0.12) for model 2, -0.13 (0.11) for model 3, -0.05 (0.16) for model 4. Row 12: Number of electoral parties (corrected), 0.00 (0.02) for all models. Row 13: GDP growth, 0.03 (0.04) for model 1, 0.00 (0.04) for model 2, 0.01 (0.04) for models 3 and 4. Row 14: Pluralism index, 0.20*** (0.08) for model 1, 0.19** (0.09) for model 4. Row 15: Information index, 0.18*** (0.06) for model 2, -0.04 (0.08) for model 4. Row 16: Respectfulness index, 0.15** (0.06) for model 3, 0.10* (0.05) for model 4. Row 17: Constant, 1.27*** (0.18) for model 1, 1.38*** (0.18) for model 2, 1.37*** (0.19) for model 3, 1.29*** (0.18) for model 4. Row 18: var(Country), 0.04*** (0.01) for model 1, 0.02*** (0.02) for model 2, 0.05*** (0.02) for model 3, 0.03*** (0.01) for model 4. Row 19: var(Election), 0.03*** (0.01) for all models. Row 20: var(Residual), 0.51*** (0.02) for all models. Row 21: N individuals, 30,807 for all models. Row 22: N countries, 25 for all models. Row 23: N years, 29 for all models.
*p < 0.10, **p < 0.05, ***p < 0.01. All models include post-stratification weights. Respondents are nested in elections, which are nested in countries. All control variables come from the CSES integrated modules dataset.
Starting with the ESS data, Table 2 indicates that the three features of the public sphere are associated with higher levels of satisfaction with democracy.Footnote 6 An increase of one standard deviation in each of the public sphere indexes is associated with increases in satisfaction with democracy ranging roughly between 0.1 and 0.33 points (in a scale of 0 to 10). In the ESS sample, the three indexes of the public sphere span over four standard deviations. This means that going from the lowest to the highest values in the respectfulness of public debate is associated with an increase of up to a full point in democratic satisfaction.
In Model 4, we include the three indexes of the public sphere in the same regression, since the coefficients of each feature in Models 1 to 3 may be partly driven by the relationship between the other aspects of the public sphere and democratic satisfaction. Note, however, that the coefficients of Model 4 may instead be sensitive to post-treatment bias in the opposite direction. For example, a more pluralistic public sphere may foster higher levels of satisfaction with democracy because it sustains more diverse sources of information. Having said that, while the coefficients for pluralism and information are no longer significant, the coefficient for respect remains with a similar size and is statistically significant at the 0.10 level.
The models in Table 3 present similar analyses for the CSES data.Footnote 7 We find statistically significant associations between all three features of the public sphere and democratic satisfaction in Models 1 to 3. A difference of one standard deviation is associated with a difference between 0.09 and 0.28 points in democratic satisfaction (on a scale of 0 to 3) for each feature of the public sphere. The respectfulness index in the CSES sample spans around three standard deviations, so going from the lowest to the highest values is associated with a difference of 0.27 to 0.63 points in democratic satisfaction. Model 4 presents the results with all features of the public sphere in the same regression. Here, we observe that both respect and pluralism remain significant at conventional standards and with similar coefficients as in models 1 and 3.
It could be the case that our estimates are driven by other factors that affect the public sphere and people’s satisfaction with democracy, including other parts of the democratic system. Figure 4 presents the coefficients and confidence intervals for our indexes of the public sphere from multilevel models similar to models 1–3 in Tables 2 and 3, but that include additional control variables. First, we include more controls related to economic performance – annual consumer inflation rates and total unemployment rates – as well as logged population. Secondly, we include the Index of clean elections to account for the strictly electoral aspects of democracy. Thirdly, we include a variable measuring the extent to which the executive respects constitutional constraints, also from V-Dem, since executive aggrandizement may be associated with both the erosion of the public sphere and changes in citizens’ satisfaction with democracy. These are conservative models, since we expect the features of the public sphere to be associated with democratic satisfaction partly due to the instrumental functions they perform in improving the quality of other democratic institutions such as elections and checks and balances. In most cases, the results are consistent with those from the main models (plotted at the top of each panel in Figure 4 with circles and black confidence intervals).
Estimated coefficients and confidence intervals for indexes of the public sphere based on models with additional controls.
Note: all models include individual-level controls and post-stratification weights. 90 and 95 per cent confidence intervals reported. See Appendix for full regression tables.

Figure 4. Long description
The image contains six scatter plots arranged in a 2x3 grid. Each scatter plot shows the estimated coefficients and confidence intervals for indexes of the public sphere based on models with additional controls. The plots are divided into two columns labeled ESS 1-9 and CSES. Each column contains three rows labeled Pluralism, Information, and Respect. The x-axes of all plots range from -0.1 to 0.4. The y-axes are categorical and represent different models: Main, Main + add. controls, Main + clean elections, Main + constitutional constraints, and Main + lag mean sat. dem. Each plot includes different symbols representing these models: black circles for Main, black triangles for Main + add. controls, gray diamonds for Main + clean elections, gray circles for Main + constitutional constraints, and black circles with a horizontal line for Main + lag mean sat. dem. The confidence intervals are represented by horizontal error bars. The plots show variations in the estimated coefficients for different models across the indexes of pluralism, information, and respect.
Given that we are working with observational data, the possibility of reverse causation is a concern. More pluralistic, informative, or respectful public spheres may drive higher satisfaction with democracy, but it could also be the case that the decline in democratic satisfaction contributes to eroding these features of public debate (although country-level analyses reported in Appendices D and E do not suggest that this is the case). While addressing this issue of reverse causation would require other empirical strategies that go beyond the scope of this article, we explore this possibility by reproducing our main analyses while controlling for the mean level of democratic satisfaction in the country in the previous survey wave. The coefficients for each index of the public sphere are plotted at the bottom of each panel in Figure 4. In these models the coefficients remain positive, but in two instances the confidence intervals overlap with zero: pluralism in the ESS sample and information in the CSES data. Importantly, the coefficient for respect becomes slightly smaller but remains positive and highly significant in both samples.
In the appendix, we present full tables for these results. We also provide additional robustness tests, including (a) models without any country-level controls; (b) models without individual-level control variables that were not measured consistently across all survey waves; (c) models controlling for other country-level factors, such as international migrant stock, economic globalization, and cultural diversity; (d) models in which countries are nested in ‘cultural zones’ to account for broad cultural differences (for the CSES data); (e) models that include economic, electoral, and constitutional controls in the same regressions; (f) additional models exploring the possibility of reverse causation and for common temporal trends across countries; (g) models using alternative estimates of our indexes of the public sphere to account for potential sources of measurement error; (h) Bayesian models that include the measurement error in our indexes; and (i) models estimating the relationship between other commonly used measures of democracy and democratic satisfaction. We consistently find that the different features of the public sphere tend to be associated with higher levels of democratic satisfaction when analysed separately, and these associations tend to be stronger and more robust than those between other measures of democracy and citizens’ democratic satisfaction. Furthermore, we find a strong association between the respectfulness of public debate and democratic satisfaction across several different model specifications in which we also control for the levels of pluralism and information of the public sphere.
Discussion
This article bridges normative theories of deliberative democracy with macro-level empirical research on institutional change and micro-level studies on the effects of political communication on democratic attitudes. To this end, we have presented new yearly measures of how pluralistic, informative, and respectful public spheres were across countries and over time from 2000 to 2020. These new measures enable us to observe how national public spheres have changed since the rise of digital communications at the turn of the century. The data indicates that there has been relatively little change, on average, when it comes to pluralism among electoral democracies. However, we observe a general decline in the quality of information and especially in the respectfulness of public debate in several electoral democracies. While we can only speculate here about the drivers of these changes in public debate, it is notable that these trends coincide with the rapid spread of social media during this period. As Jürgen Habermas recently argued, the rise of social media has represented a new structural transformation of the public sphere, putting its democratic functions under stress (Habermas Reference Habermas2023). We find evidence that it has been the epistemic and, especially, integrative functions of the public sphere that eroded in the past two decades.
To what extent are these features of the public sphere associated with citizens’ democratic satisfaction? We have argued that public spheres are likely to contribute to citizens’ experience of democracy in two ways. First, public spheres provide normative goods that people associate with democratic politics, such as the expressive recognition that comes from being able to voice one’s own viewpoints, the empowerment that comes with the ability to criticize political authorities, the political efficacy associated with a better understanding of politics, and the social integration that can result from respectful public debates.
Secondly, public spheres are also instrumental for other democratic institutions, especially free and fair elections. Pluralistic public spheres are needed for elections to offer meaningful alternatives for voters and for retrospective voting to serve as a mechanism of vertical accountability. Informative public spheres are needed for voters to link their preferences and interests with vote choices. Respectful public spheres are necessary to attenuate the adversarial dynamics of electoral competition.
Hence, we have argued that the three features of the public sphere should be associated with higher levels of satisfaction with democracy when free and fair elections are also present. Multilevel models using data from the ESS and CSES suggest this is the case. These associations hold even after accounting for the electoral components of the democratic system, for the strength of constitutional constraints on the executive, and for aggregate levels of democratic satisfaction in the past. Disentangling the relationship of each feature of the public sphere with democratic satisfaction independently from the others is very difficult. Nevertheless, we consistently find that the respectfulness of public debate tends to be associated with higher levels of satisfaction with democracy, even after controlling for the other aspects of the public sphere. This is likely to be the case because there is more variation among electoral democracies in the respectfulness of public debate compared to other aspects of the public sphere. However, this result could also indicate that citizens are more likely to notice and react to changes in the respectfulness of public debate than to changes in the pluralism or epistemic qualities of the public sphere. Even though the integrative functions of public spheres are rarely seen as a core feature of democracy, the respectfulness of public debate seems to be closely related to how citizens perceive democratic politics.
Our results highlight the need for further research into the relationship between the non-electoral components of democracy and citizens’ democratic attitudes. Despite our best efforts to account for spuriousness and reverse causation, such issues cannot be fully addressed using observational data. Future studies may apply strategies for causal inference to test the effects of these different aspects of public debate on citizens’ political attitudes, both in democracies and non-democracies. Even if we cannot make strong causal claims, the results presented here raise pressing normative questions about which unobserved factors could be driving both citizens’ dissatisfaction with democracy and the erosion of the public sphere, especially given that we are already controlling for various potential confounders related to economic performance, socio-demographic changes, cultural differences, and the quality of other democratic institutions. Similarly, if endogeneity is driving our results, our findings underscore the possibility that the decline in democratic attitudes could contribute to democratic backsliding through its potentially negative effects on various aspects of the public sphere.
The measures of the public sphere also open promising avenues for further research to explain under what conditions improvements in certain aspects of public debate contribute to or undermine other features of the public sphere, as well as other parts of the democratic system. The central focus of this article has been on pluralism, information, and respect because they have been associated with specific democratic functions in the normative literature. However, there are other features that also merit attention and call for original data collection, for example the extent to which political decisions actually reflect the content of public debates. Along these lines, researchers may also rely on latent variable models similar to those employed here to inductively identify other dimensions of empirical variation across national public spheres. Further research can also use our indexes of the public sphere to examine the drivers of such changes and whether they are related to technological innovations, policy changes, or the rise of populist actors. Finally, future research may also examine to what extent citizens’ reactions to these features of the public sphere vary across social groups.
To conclude, our data indicates that the respectfulness of public debate and the quality of information have declined in the past two decades, even in otherwise well-functioning democratic systems. This raises concerns about how the erosion of the public sphere may play a role in democratic backsliding, but it also suggests that the resilience of certain features of the public sphere might help to guard democracy during troubled times.
Supplementary material
The supplementary material for this article can be found at https://doi.org/10.1017/S000712342610163X.
Data availability statement
Replication data for this paper can be found at https://doi.org/10.7910/DVN/AE8UCI, including the files with the public sphere indexes (Goenaga Reference Goenaga2026).
Acknowledgments
The author thanks Ryan Bakker, Hanna Bäck, Michael Hansen, Jonathan Hanson, Robert Klemmensen, Jonathan Polk, Florence So, Mark Warren, and the participants of the Comparative Politics Research Group at Lund University for useful comments on previous versions of this paper, as well as Nils Dröste and Dylan Pashley for their help in the construction of the public sphere indicators.
Financial support
This project was funded by a ‘Society’s Big Questions’ Fellowship from the Swedish Royal Academy of Letters, History and Antiquities.
Competing interests
No competing interests to disclose.




 Open access

