Knowledge-intensive business services (KIBS) such as IT, engineering, accounting, auditing, and management consulting, are of growing importance for regional economies, especially for those of large cities. Local human capital and knowledge inputs are generally discussed as the most fundamental correlates for location of such industries (Keeble and Nachum Reference Keeble and Nachum2002; Acs and Armington Reference Acs and Armington2004; Shearmur and Doloruex Reference Shearmur and Doloreux2008; Meliciani and Savona Reference Meliciani and Savona2014). At the same time, the causal link between the location of human capital and knowledge-intensive business services remains underexplored. In this article, I propose to overcome the endogeneity problem using a natural experiment arising from the central planning of the R&D sector in the USSR prior to the collapse of the command economy and the cuts in government spending. Under Soviet rule, due to limitations on private entrepreneurship, independent knowledge-intensive business service providers in Russia were unknown. Industrial enterprises relied on their own R&D departments or on large publicly owned research institutions, with military-related research dominating the government-sponsored agenda. When the central planning system was abolished in early 1992, people were agglomerated in places for reasons only loosely related to the market. I argue that central planners were unable to anticipate which locations would be favored when market forces were allowed to operate. With the collapse, spending cuts pushed many professionals out of Soviet-style research institutions. Pre-existing ties to industry were also unlikely to drive KIBS development because of the deteriorating financial condition of former R&D sponsors, such as the arms or aerospace industries.
Existing evidence supports the view that market agents followed different locational policies to those pursued by central planners of the socialist era. In Oliver Falck, Michael Fritsch, and Stephan Heblich (Reference Falck, Fritsch and Heblich2014) it has been shown that following German reunification, new entrants tended not to locate in the same areas with incumbent firms within the same industries in East Germany. At the same time, there was strong tendency for coagglomaration of incumbents and new entrants in former West Germany. The authors interpret this as an element of post socialist transformation in the former German Democratic Republic. Of course, in some industries like manufacturing and transportation, the Soviet-era legacy included physical capital, which is extremely costly to relocate even if the market required it. For tertiary industries, this was not the case: knowledge-intensive business services are not a capital-intensive but rely on human capital, which is relatively mobile. I explore just how mobile or path dependent that labor was in the aftermath of the collapse of the Soviet regime.
If knowledge-intensive business service location is determined primarily by fundamentals like natural resources, amenities, or governance, which attract firms to a region and drive demand for business services, one should not expect to see any influence of late Soviet R&D staff on the present-day geography of these services. If, however, the spatial pattern of the Soviet R&D sector is “sticky” (i.e., path dependence in present-day KIBS location is observed), explanations for this persistence would depend on whether this was the result of voluntary choice of former researchers. Low rates of residential mobility attributed to poverty traps and labor market rigidness are often blamed for preserving distortions in the Russian urban systems (Hill and Gaddy Reference Hill and Gaddy2003; Shepotylo Reference Shepotylo2012; Guriev and Vakulenko Reference Guriev and Vakulenko2015). Additionally, if getting a skilled job in a new location requires reputation, which can be earned only locally, former researchers might be deterred from migrating. In such cases, we should see the KIBS clusters as a negative phenomenon, and policy interventions should be aimed at helping the people employed there to move to those regions where their skills are in demand.
In contrast, former researchers might voluntarily stay in places they had been agglomerated under the central planning. A plausible reason behind this are the externalities arising from local density of high human capital workers, as well as from the presence of other KIBS firms. The idea that skilled professionals generate externalities for other workers in the same area is an established one in the literature (Lucas Reference Lucas1988; Rauch Reference Rauch1993; Acemoglu and Angrist Reference Acemoglu and Angrist2001; Moretti Reference Moretti2004; Fu Reference Fu2007). Human capital externalities are multifaceted. Workers may learn from their high-skilled peers. A high density of skilled jobs allows better specialization between workers on special types of tasks, as well as expedites job search in a case of unemployment (the latter is of enormous importance in the turbulent economy of transition-era Russia). Another advantage from spatial clustering of skilled workers is improved matching in worker groups necessary to undertake collaborative projects (Venables Reference Venables2011). Spatial proximity can also facilitate diffusion of innovations. Adam B. Jaffe, Manuel Trajtenberg, and Rebecca Henderson (Reference Jaffe, Trajtenberg and Henderson1993) have shown that citations to U.S. patents are more likely to come from the same metropolitan statistical area as the original patent.
If human capital externalities hold, one still cannot draw straightforward welfare implications, since the existing locational pattern may be distorted due to the central planners' decisions.Footnote 1 For example, very cold parts of Russia remain overpopulated when compared to Canada's north (Hill and Gaddy Reference Hill and Gaddy2003; Mikhailova Reference Mikhailova2004).
This article contributes to the literature on path-dependence and natural experiments in economic geography. One of the most intriguing questions of economic geography is whether an industry location pattern is uniquely determined by some fundamental factors or whether there are multiple equilibria, and that spatial catastrophes can switch them. The New Economic Geography view, dating back to such scholars as Paul Krugman, Masahisa Fujita, Jacques-Francois Thisse, Antony J. Venables (Krugman Reference Krugman1991; Fujita and Thisse Reference Fujita and Thisse1996; Fujita, Krugman, and Venables Reference Fujita, Krugman and Venables2001) emphasizes increasing returns due to spatial agglomeration of firms, even when this agglomeration is due to idiosyncratic factors. The robustness of these spatial agglomerations has been evaluated in the aftermath of exogenous shocks. How quickly does the spatial distribution of population and industry recover? Donald R. Davis and David Weinstein (Reference Davis and Weinstein2002) find that the Allied bombing of Japan left unchanged the relative size of Japanese cities.Footnote 2 Other studies came to similar conclusions with evidence for war-related shocks: Germany (Brakman, Garretsen, and Schramm Reference Brakman, Garretsen and Schramm2004), Vietnam (Miguel and Roland Reference Miguel and Roland2011), and Russia (Mikhailova 2012).
Locational patterns of population and economic activity appear in these studies as tremendously persistent and path-dependent: even nuclear bombings were unable to change spatial equilibrium in the long run. However, one can argue that war-related destruction is not a proper shock to test the hypothesis of path-dependence. Firstly, these cities could be located in correct places initially. Secondly, people in cities devastated by bombing nevertheless could be sure that hostilities eventually would cease, and dwellings they and their neighbors used to live in, and factories they used to work in would be reconstructed.
Other studies investigate the consequences of long-term exogenous constraints on spatial equilibrium, as well as shocks caused by unexpected collapses of such constraints. Stephen J. Redding and Daniel M. Sturm (Reference Redding and Sturm2008) found that West German cities close to the East-West border grew substantially more slowly relative to other cities and even their catch-up after reunification was much more gradual. Redding, Sturm, and Nikolaus Wolf (Reference Redding, Sturm and Wolf2011) show that the division of Germany led to a shift of the major airline hub from Berlin to Frankfurt-am-Main, and that there is no evidence of reverse movement after the fall of the Berlin Wall.Footnote 3
This article takes advantage of two major events in the social and economic history of the twentieth century: the Soviet state-led modernization project and the ensuing post-socialist transition. The novelty of this article lies in showing how path-dependence of industry location may arise from exogenous agglomeration not of physical assets but of (potentially mobile) human capital, with special emphasis on upper-tail skills. The article, therefore, bridges between literatures on multiple equilibria in economic geography and on human capital externalities. In contrast to many other studies, the nature of exogenous shock under consideration is not the physical destruction of built environment, or locational fundamental obsolescence due to technical progress, but sweeping institutional changes. I show that spatial clusters of research, development, and other knowledge-intensive activities became self-sustainable and persist even under very unpleasant external conditions and poor location.
HISTORICAL BACKGROUND
In the Soviet centrally planned economy, knowledge-intensive business services were a minor sector. In fact, some service industries simply did not exist (Bradshaw Reference Bradshaw2008), such as consumer IT or management consulting. Indeed, the economy lacked a sector of small knowledge-intensive companies. Rather, the state-owned R&D sector was highly militarized. In 1983, more than 70 percent of the USSR's R&D expenses were incurred for purposes related to national defense and the space program. Overall the R&D expenses to the gross domestic product (GDP) ratio was very high (3.6 percent in 1983) but much smaller when only the civil fraction was taken into account (Freeman Reference Freeman1995).
The Russian R&D sector is largely a creature of the Communist regime. Before the 1917 Revolutions in the classification of occupations listed in the Imperial census of 1897 science was merged with creative writing and fine arts. The Soviet government designated the Academy of Sciences, founded in 1724 in St. Petersburgh,Footnote 4 as the powerhouse of progress, endowing it with generous funding and greatly expanding the network of research institutions. Even during the civil war, the number of research staff in the Academy of Sciences quadrupled (Osipov Reference Osipov1999).Footnote 5 Constituent republics of the USSR replicated this system, creating research institutions in places with previously almost no science. Outside the Academies system, so-called scientific research institutes (known under the Russian acronym NII) and design bureaus (in a similar manner called KB) under the aegises of government ministries and even individual plants were created in large numbers in order to conduct practically-oriented research and development.
The resulting Soviet model of R&D sector was quite unique: universities, aside from a few elite schools like Moscow State University, Leningrad (now St. Petersburgh) State University, Moscow Engineering Physics Institute, were committed primarily to teaching, with research being conducted in specialized institutions working under umbrellas of various government agencies, industrial enterprises, or the Academies. Thus the system of R&D planning was highly centralized and bureaucratized (Radosevic Reference Radosevic2003).
The geography of the Soviet-era knowledge-intensive industries was shaped without taking into account the viability of industries or market conditions. Instead, ideological, political, and military considerations were given high priority (Rodgers Reference Rodgers1974; Hill and Gaddy Reference Hill and Gaddy2003; Mikhailova Reference Mikhailova2004; Kumo Reference Kumo2004). WWII-related evacuations left their imprints with academic institutions relocated to cities which believed to be invulnerable for German invasion. For example, the evacuation of the Academy of Sciences of USSR from Moscow and Leningrad to Kazan on Volga, which gave rise to the Kazan branch of the Academy.
Postwar, the government implemented a deliberate policy of spreading research activities outside Moscow and Leningrad. A notable case was Novosibirsk Akademgorodok—the seat of the Siberian branch of the Academy of Sciences. Initially, regional branches of the Academy were understaffed and narrowly focused, committed mostly to local problems like natural resources exploration (Vek Lavrent'eva 2000, pp. 126, 200). A groundbreaking decision was made in 1957 when many scientists, both young and renowned ones, were incentivized to move to Novosibirsk with the intention to build a world-class research center with all-encompassing range of disciplines and topics. Relative freedom from academic hierarchy and rapid promotion were touted as a motivation to move to Siberia.
Novosibirsk was not, however, a straightforward location choice.Footnote 6 Many top officials, including the president of the Academy of Sciences and the Minister of Higher Education thought the project unviable (Vek Lavrent'eva 2000, p. 123), mostly because Siberia still had a reputation as the country's place of exile and penal labor, not to mention its harsh climate. Novosibirsk, although a rapidly growing manufacturing center and ranked as the seventh most populous city of the USSR in 1959, lagged when it came to science, as did Siberia and Soviet Far East as a whole, with a share in the total country's R&D workforce of only 1–2 percent, according to Lavrentyev's own estimates (Vek Lavrent'eva 2000, p. 122). Novosibirsk, however was already home to the peripheral West Siberian branch of the Academy, headed by Timofei Gorbachev, a mining engineer. However, similar research centers existed in several other regions of the USSR. Indeed, the city lacked graduate-level institution granting degrees in mathematics, physics, or chemistry, and the Novosibirsk State University had to be created from scratch.
Soviet regional governments enjoyed enormous autonomy in pursuing their own economic policies under Khrushchev's short-lived sovnarkhoz reform (1957–1965), exactly the same period the Akademgorodok in Novosibirsk was being built. With Khrushchev ouster in 1964, the new Soviet leader Leonid Brezhnev reversed course and returned to administrative centralization.Footnote 7 In general, key economic decisions were taken in Moscow throughout most of the Soviet era. In addition, Soviet regional leaders were appointed de facto from Moscow and rotated, especially during the reigns of Stalin and Khrushchev. Therefore, differences in their policies can be treated as idiosyncratic. One indicative anecdote is that Boris Kobelev, the First Secretary of Irkutsk Obkom of CPSU in 1955–1957, whose policy Lavrientyev blamed for choosing Novosibirsk over Irkutsk as a location of the Akademgorodok (see footnote 6), was transferred to Novosibirsk in May 1957—the same month the final decision about placing there the Siberian branch of the Academy was made.Footnote 8
Another feature of Soviet R&D sector after WWII were closed towns (ZATOs), devoted to military research and production or double-purpose research, development, and manufacturing.Footnote 9 Typically closed towns were located in remote places, although some have been placed in Moscow region. While some ZATOs remain restricted to visits even for Russians to this day, others have been converted to “science cities,” or naukograds, with civilian-oriented research agenda, with no visit or migration restrictions. For example, Dubna in the Moscow region hosted an internationally renowned nuclear physics research center as early as in 1956. It is highly unlikely that considerations taken into account by the bureaucracy while picking locations for highly secretive research and production facilities during the Cold War had much to do with current market-era factors influencing location choice of KIBS providers.
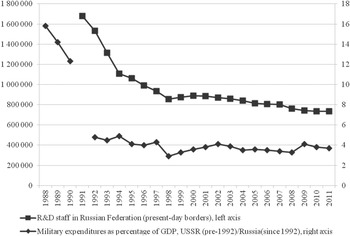
With the collapse of the Soviet Union in 1991, military budgets and public spending on fundamental science were cut dramatically. Even civil research-intensive industries, like aerospace and electronics, also shrunk. As a result, Russian scientists faced decreased salaries, inflation, shortages of laboratory supplies, and aging equipment. Worsening work conditions led to growing human resource outflow from the R&D sector. At the same time the emerging KIBS sector offered promising opportunities.
Russia retains the legacy Soviet-style R&D sector, although significantly cut in size and capabilities (Figure 1). Even in 2011, 76.1 percent of total R&D staff were in fully publicly-owned organizations, with 74.5 percent of those owned by the federal government. An additional 10.7 percent worked for institutions in mixed public-private ownership (Belousova et al. Reference Belousova, Gorodnikova and Gokhberg2013, p. 39). From the point of industry classification, it was still dominated by the traditional Soviet-era subsectors: independent research institutions (OKVED industry code 73 “Scientific research and development”), university research laboratories, and in-house R&D divisions of manufacturing enterprises (Belousova et al. Reference Belousova, Gorodnikova and Gokhberg2013, p. 42).
MILITARY EXPENDITURES AND R&D STAFF DYNAMICS IN RUSSIA

Yet by 2011, a vibrant market-oriented KIBS has emerged, with the heavy involvement of skilled professionals who left academia and military-related R&D institutions. These former researchers possessed high cognitive skills along with broad fundamental knowledge. Therefore, they were able to bridge this gap even if their background was not directly related to their new career path (Yurevich Reference Yurevich1998, pp. 107–110). Unlike the R&D sector, the KIBS sector is dominated by private ownership. As of 2011, it was less than one-quarter of public sector employment in architecture, engineering, IT, law, auditing, accounting, and management consulting combined. Public sector KIBS employment was in establishments owned by regional and local authorities rather than the federal government.Footnote 10
The recent history of Miass, Chelyabinskaya oblast epitomizes the story. In 1955, Miass was a rather typical medium industrial town near the Ural Mountains a thousand kilometers from the seashore. Despite this, it was chosen for the location of the Makeyev design bureau in charge of submarine-launched missile development. After 1991, engineers who previously worked for the missile design bureau founded several startups in Miass, although they were able to move elsewhere. Among those startups was Papillon Systems, which developed fingerprint identification hardware and software—a field loosely related to missilery. The company founder Pavel Zaitsev calls his decision to venture into this field after running an imported computers dealership “pure accidental.”Footnote 11 Despite the town's backward location, Papillon Systems gained commercial success with contracts from both Russian and foreign law enforcement agencies.
Novosibirsk Akademgorodok also provides vivid examples of successful businesses founded by researchers who switched their careers. An outstanding case is the Center of Financial Technologies (CFT), also known by its Russian name Centr Finansovykh Tekhnologiy. This software company has about 2,000 employees on its payroll. CFT sells IT solutions to financial sector companies as well as maintains the independent payment system Zolotaya Korona (Golden Crown). A co-founder of the company, Igor Potashnikov, worked for the Akademgorodok's mining science institute after his graduation from Novosibirsk State University in 1986.Footnote 12 Another co-founder, Aleksandr Pogudin, had read geology in Novosibirsk State University.Footnote 13 Before launching their own company, both worked for a private bank. Now, CFT retains close ties to Akademgorodok, basing there its software development division. So, despite being able to move, entrepreneurs chose to stay.
Two factors facilitate the success of former researchers in transition economy. Firstly, KIBS ventures often relied on the adoption of Western information technology. In the Soviet Union, research institutions enjoyed privileged access to computers, including Western designs, with heavily restricted public access. Therefore, people with research background had advantages in technology adoption and transmission, while outside the R&D sector people often lacked any idea of IT.
Secondly, the R&D sector was a testing ground for the very cautious experiments in legalizing private entrepreneurship in the USSR. Since 1987, Centers for Youth Scientific and Technical Creativity were allowed under the supervision of the Komsomol, the communist youth organization. Their official purpose was to boost technology transfer from scientific labs to industry, although they quickly diversified their activity into other fields, including foreign trade. Although limited in scope, these centers were instrumental in nurturing Russian businesspersons' community (Kryshtanovskaya Reference Kryshtanovskaya2005, p. 294). Therefore, researchers also had opportunity to gain experience in private entrepreneurship somewhat earlier than most other Russians did.
EMPIRICAL STRATEGY
To establish association between location of the Soviet R&D workforce and various outcomes, I run simple ordinary least square (OLS) regressions in the following general specification form:

where:
-
Y i – outcome (e.g., number of workforce in engineering and architecture or other knowledge-intensive industry)
-
R&D1991 i – number of R&D personnel in region i in 1991
-
X ij – control variables
-
ε i – random term
Given differences in the size of Russian regions, log-log transformation of both dependent and independent variables are used to reduce the possible influence of outlier observations, like Moscow and St. Petersburg. Another way to mitigate this problem is to scale 1991 R&D workforce and control variables by total employment in a relevant year (when applicable). As a robustness check, I do this with and without log-log-transformation (i.e., using both “shares in employment” and “log shares in employment”).
The regressions are of two different kinds: balancing test, with circa 1991 variables appearing on both sides of the equation, and baseline specifications, with 1991 number of researchers on the right-hand side and 2011 outcomes on the left-hand side.
To yield consistent estimates, OLS requires conditional independence assumption, or exogeneity of independent variables. To obtain additional underpinnings for the assumption of exogeneity of Soviet-era R&D sector location with respect to factors potentially influencing development of knowledge-intensive business services, I perform the balancing test, regressing 1991 R&D employment on various measures of economic development in the late years of the Soviet Union, while controlling for total employment, measures of urbanization, and population density. The balancing test regressions are not causal, but they are important to reduce concerns of endogeneity in the baseline specifications.
In the baseline specifications, I use the number of staff involved in R&D in 1991 across Russian regions as a measure of the Soviet-era legacy, and employment in various KIBS industries in 2011 as well as number of microenterprises in business services sector are outcome variables.
I examine salaries in engineering and IT to distinguish between the theories of poverty trap and human capital externalities as the causes of path-dependence. Poverty trap theory implies that an excess supply of (supposedly immobile) skilled labor for legacy reasons depresses local salaries. Under human capital externalities theory, factor price equalization across regions is expected in the long run, while in the short run it is possible that KIBS employees get a premium for working in Soviet-era R&D hotspots. Although, as shown in Enrico Moretti (Reference Moretti2004), a positive effect of human capital externalities on skilled workers themselves can be significantly mitigated by the negative effect of excess supply of their skills. Unfortunately, there is insufficient data to disentangle different facets of human capital externalities in this particular setting.
Path-dependence in KIBS location may be the result of one-shot employment leakage in the 1990s or of persistent knowledge spillovers between state-owned research institutions and KIBS firms. Keeping in mind significant decrease in research activity after the demise of the Soviet Union, the former seems more plausible. I perform a placebo test substituting 1991 number of researchers with 2011 one in the regressions, assuming that people who left science for KIBS in the early 1990s are not counted in 2011, and the effect is expected to attenuate if one-shot employment leakage drives the correlation.
DATA AND VARIABLES
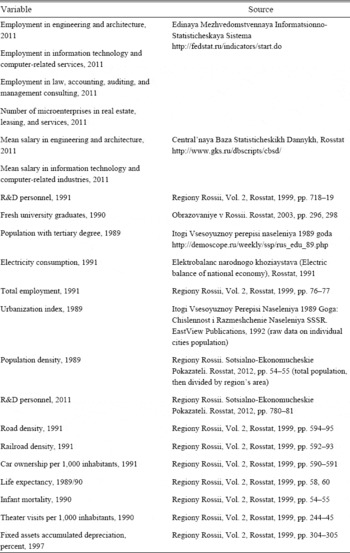
In this article, I use region-level data, the only spatially disaggregated data available in Russia for this question. The baseline sample includes 75 regions. Data are obtained mostly from official statistical yearbooks. Greater detail about data collection is available in the Appendix.
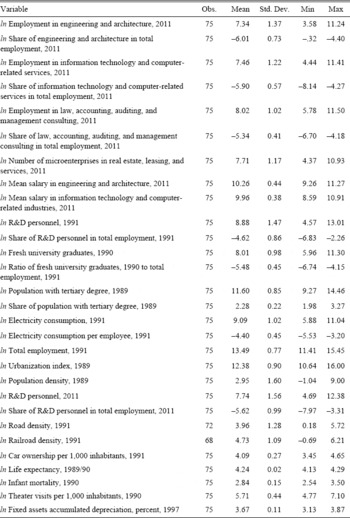
Descriptive statistics are shown in Table 1. One can note that there is significant variation across regions in number of employees in R&D in 1991 and in knowledge-intensive business services even after taking logs. Also, there is great heterogeneity in terms of urbanization, human capital, and economic development (proxied by electricity consumption in 1991). The distribution of life expectancy and infant mortality is more equal across regions, because the Soviet government did impressive work to provide essential health services and hygiene education in the whole country, including underdeveloped and remote parts of the USSR.

In the baseline specifications, the dependent variables are 2011 employment in three two-digit industries defined by statistical classification (OKVED): Engineering and architecture (74.20.1), Information technology and computer-related services (72), Law, accounting, auditing, and management consulting (74.1). These industries are of comparable size, each employing about 300,000–400,000 people nationwide. In several specifications, mean monthly salary is also used as a dependent variable.
In addition to employment and salaries, I use the 2011 number of microenterprises in the business service sector as another measure of entrepreneurial activity. A microenterprise is defined by the Russian statistical service as a firm with the number of employees not exceeding 15, sales per year not greater than 60 million rubles (equivalent to 2 million USD in 2011), and the stake of the government, non-profit organizations, foreign entities, and persons not exceeding 25 percent. Because data on the number of microenterprises by region is only available by one-digit industry codes, I am restricted to the “Real estate, leasing and services” industry. This statistical code includes the majority of knowledge-intensive business services, but not retail and wholesale trade, catering, transportation services, and other tertiary industries employing mainly low-skilled labor.
The number of R&D staff in 1991 by region is the main independent variable. Reflecting the traditions of the Soviet scientific community, these data, published by the government statistical service, do not include university lecturers but do cover those who performed research tasks on campus, as well as employees of the state Academies, other independent research establishments, and enterprise R&D departments.Footnote 14
Prior to estimating baseline models, I conduct a balancing test with various variables from the pre-transition period (see Table 2). Lack of market prices makes any indicators of monetary nature unreliable. Instead, I use a range of physical indicators. Electricity consumption is one indicator of economic activity. Other variables used in the balancing test reflect quality of living and public goods provision in a region; namely road and railway density, life expectancy, infant mortality, car ownership, and number of theater visits. Due to the lack of Soviet-era data, I use fixed assets accumulated depreciation in 1997 as a relevant measure. Change in measurement year is unlikely to create significant distortions because there was very little investment in Russia during the 1990s.
BALANCING TEST

* = Significance at 10 percent level.
** = Significance at 5 percent level.
*** = Significance at 1 percent level.
Notes:
Robust standard errors in parentheses. Due to data limitations, Moscow, Moscow oblast, St Petersburg, and Leningrad oblast are dropped in columns (3)–(6).
Sources:
See Appendix Table 1.
Regressions of present-day KIBS on 1991 R&D staff were run controlling for the main potential co-determinants of KIBS location. Following Joshua D. Angrist and Jörn-Steffen Pischke (2008, p. 47–51), in the baseline specification a variety of late Soviet, i.e., pre-treatment control variables, are used. The number of college-educated persons in a region from 1989 census and the number of fresh university graduates in 1990 were used as a proxy for the strength of the regional university system and regional human capital.
The relationship between the thickness of local market and demand for business services is well established. Greater market size promotes division of labor and contracting-out.Footnote 15 Electricity consumption and total employment in 1991 are used here as a proxy for economic development and market size.
There is also rich evidence that large cities are popular KIBS locations (Bennett, Graham, and Bratton Reference Bennett, Graham and Bratton1999; Keeble and Nachum Reference Keeble and Nachum2002; Shearmur and Doloreux Reference Shearmur and Doloreux2008; Kolko Reference Kolko2010). Due to location factors like proximity to clients and suppliers, labor pooling, transport accessibility as well as localized knowledge spillovers and availability of tacit knowledge (Howells Reference Howells2002; Keeble and Nachum Reference Keeble and Nachum2002; Muller and Doloreux Reference Muller and Doloreux2009).
Region-level urbanization is controlled for using a constructed urbanization index. Formally, this is as follows:

where:
-
S ij – share of settlement j in region i's aggregate population
-
P j – population of settlement j
This index is preferred to the simple urbanization rate (share of people who reside in cities and towns) because the latter does not distinguish between the concentration of people in a few large cities and dispersed urbanization patterns. The urbanization index is calculated with city- or town-level data from 1989 census. In addition, I control for regional population density in all specifications given the major population differences across Russian regions.
All the specifications include dummies for eight federal districts: groups of contiguous regions with similar geography, including one specially designated district for the North Caucasus republics.
EMPIRICAL RESULTS
Balancing Test
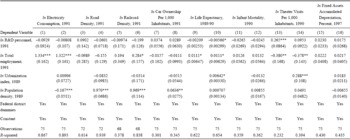
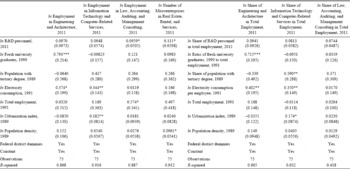
Table 2 presents the results for the balancing test of various economic development measures in the late Soviet era on the 1991 number of R&D personnel (log-log specifications). The logarithm of total employment was controlled for to remove the region size effect and to make the specification more flexible. In even-numbered columns, I control for logarithms of urbanization index and population density. In addition, the federal districts dummies were included. As noted earlier, I do not tackle causality issues when running these regressions. Instead, I simply attempt to ascertain whether Soviet-era R&D institutions were located in more developed or favored by the government regions.
Most coefficients in Table 2 are small in magnitude and insignificant, especially when controlling for the urbanization index and population density. Correlation is often negative, as for electricity consumption, road and railroad density, life expectancy. These results support the view that it is unlikely that regions with a greater size of R&D sector near the end of the Soviet era could have greater potential demand for KIBS.
This result superficially contradicts anecdotes of the high quality, by the Soviet standard, of life in the closed towns. However, privileges of the scientific enclaves were a consequence not cause of their research functions. Isolated and often relatively small, these settlements could not rely on regional authorities for pubic goods provision and had little contact with neighboring places. Therefore, their local economic impact was limited. In addition, closed towns constituted only a fraction of the Soviet R&D sector. In larger cities with diversified economies, the share of researchers in the population was typically small, and the scientific community had no major influence on governance.
It is beyond the scope of this research to explain the lack of correlation between the R&D employment and the basic socio-economic variables in the last years of the Soviet Union. However, I raise the suggestion that the scientific sector was unable to generate significant spillovers to regions' economies because of centralized decision-making and funds allocation, military dominance over the research agenda, and weak incentives to innovate in civil industries. Soviet people also could not move freely to any location with better quality of living because of mobility restrictions imposed in many large cities (Gang and Stuart Reference Gang and Stuart1999).
Baseline Regressions
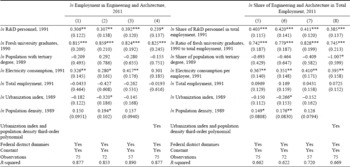
Table 3 reports the results from regressions of 2011 engineering and architecture employment on 1991 R&D workforce with a number of controls described previously, when natural logarithm of both left-hand and right-hand variables is taken. The variables are used in two different functional forms: as log absolute numbers or as log shares in total employment.
EMPLOYMENT IN ENGINEERING AND ARCHITECTURE

* = Significance at 10 percent level.
** = Significance at 5 percent level.
** = Significance at 1 percent level.
Notes:
Robust standard errors in parentheses. In columns (2) and (6), Moscow, Saint Petersburg, and Moscow Oblast are dropped. In columns (3) and (7), the lowest quartile of urbanization index is dropped.
Sources:
See Appendix Table 1.
The 1991 R&D employment has a statistically and economically significant effect on the present-day number of employees in engineering and architecture: a 10 percent change in 1991 number of R&D staff is associated with a 3 percent change in current number of workers in engineering and architecture (column 1). The result is robust to the elimination of Moscow and St. Petersburg, the two most important and privileged Russian cities in column (2). Similarly, the result holds (and becomes even stronger) when the lowest quartile of urbanization index is dropped, as in column (3). In column (4), logs of urbanization index and population density are substituted with third-order polynomials of the transformed variables without logarithmic transformation. The result remains generally the same.Footnote 16
In the next four columns I run regressions with the same variables used in “log shares of total employment” form,Footnote 17 applying the same robustness checks as in the columns (1)–(4). A relative change in share of R&D employment in 1991 by 10 percent leads to 3.85–4 percent relative change in 2011 workforce share of engineering and architecture.Footnote 18
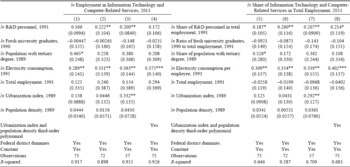
Results for information technology are given in Table 4. The effect is not so strong for the full sample: a 10 percent change in number of Soviet-era researchers is associated with 1.66 percent change in IT workforce today (column 1). The size of the respective effect in the log shares in employment specification is 1.87 percent (column 5).Footnote 19 Introducing polynomials of the urbanization index and population density into the regression brings little change (columns 4 and 8).
EMPLOYMENT IN INFORMATION TECHNOLOGY

* = Significance at 10 percent level.
** = Significance at 5 percent level.
*** = Significance at 1 percent level.
Notes:
Robust standard errors in parentheses. In columns (2) and (6), Moscow, Saint Petersburg, and Moscow Oblast are dropped. In columns (3) and (7), the lowest quartile of urbanization index is dropped.
Sources:
See Appendix Table 1.
With the exclusion of the two largest cities and the lowest quartile of the urbanization index, the 1991 number of R&D personnel becomes a significant predictor of present-day IT employment. The size of the effect per 10 percent change is 2–2.6 percent both in the log absolute numbers (column 2) and the log shares in employment (column 6) specifications. Soviet-era human capital endowments, therefore, appear able to explain differences in IT sector development within the main body of Russian regions, but not in outliers, big and small. The smaller size of effect on IT may also reflect the fact that information technology has progressed very quickly and has become ubiquitous since the early 1990s, thus facilitating a “dissipation” of the path-dependence.
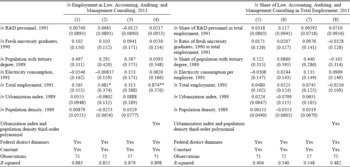
Strikingly different are the results for law, accounting, auditing, and management consulting (Table 5). The coefficient on 1991 R&D employment is much smaller in magnitude when compared to IT and engineering, a less than 1 percent relative change of the dependent variable per 10 percent change of 1991 number of R&D staff in all the specifications, and is statistically insignificant. This is an important placebo test, since law, accounting, and similar industries are close to engineering and IT in many dimensions, but not in the possibility of direct transmission of Soviet-era skills and competencies. Therefore, it is unlikely that 1991 R&D personnel actually stand for some omitted variable determining regions' attractiveness for KIBS location.
EMPLOYMENT IN LAW, ACCOUNTING, AUDITING, AND MANAGEMENT CONSULTING

* = Significance at 10 percent level.
** = Significance at 5 percent level.
*** = Significance at 1 percent level.
Notes:
Robust standard errors in parentheses. In columns (2) and (6), Moscow, Saint Petersburg, and Moscow Oblast are dropped. In columns (3) and (7), the lowest quartile of urbanization index is dropped.
Sources:
See Appendix Table 1.
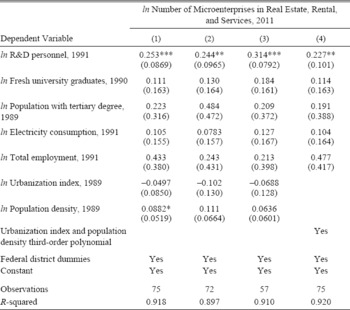
In Table 6, results using log number of business services microenterprises are listed. The effect of 1991 R&D personnel is sizeable, equaling about 2.5 percent per 10 percent change of the independent variable. It is statistically significant and stable across specifications.Footnote 20 These results corroborate the view that launching startups was an important mechanism by which former researchers adapted to new circumstances.
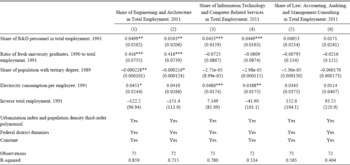
In each of these specifications, I use log-log models exclusively. To test for sensitivity of the results to specification change, shares of total employment regression without logarithmic transformation were run (Table 7). The results from these specifications are qualitatively the same as from log-log models, with positive and significant effect for engineering and IT, and zero effect for auditing, accounting, and management consulting. Interpreted in terms of standard deviations, one standard deviation change in the 1991 employment share of R&D activities is associated with 0.3–0.4 standard deviation change in present-day employment share of engineering or IT.
BUSINESS SERVICES MICROENTERPRISES

* = Significance at 10 percent level.
** = Significance at 5 percent level.
*** = Significance at 1 percent level.
Notes:
Robust standard errors in parentheses. In column (2), Moscow, Saint Petersburg, and Moscow Oblast are dropped. In column (3), lowest quartile of urbanization index is dropped.
Sources:
See Appendix Table 1.
NON LOG-TRANSFORMED SHARES IN EMPLOYMENT

* = Significance at 10 percent level.
** = Significance at 5 percent level.
*** = Significance at 1 percent level.
Notes:
Robust standard errors in parentheses. In the even-numbered columns, Moscow, Saint Petersburg, and Moscow Oblast are dropped.
Sources:
See Appendix Table 1.
PLACEBO TEST: 2011 R&D PERSONNEL

* = Significance at 10 percent level.
** = Significance at 5 percent level.
*** = Significance at 1 percent level.
Notes:
Robust standard errors in parentheses. In columns (2) and (4), Moscow, Saint Petersburg, and Moscow Oblast are dropped.
Sources:
See Appendix Table 1.
MEAN SALARY IN ENGINEERING AND IT

* = Significance at 10 percent level.
** = Significance at 5 percent level.
** = Significance at 1 percent level.
Notes:
Robust standard errors in parentheses. In even-numbered columns, Moscow, Saint Petersburg, and Moscow Oblast are dropped.
Sources:
See Appendix Table 1.
Channels of Influence
The possibility exists that the observed results are driven by current, not pre-transition knowledge spillovers between research institutions and KIBS. To check for this, I run the same regressions substituting the 2011 number of R&D staff for the 1991 number. As argued above, the 2011 variable measures mostly employment remaining in research institutions inherited from the Soviet era. If an employment leakage occurred, one should expect attenuation of the effect when newer data on R&D personnel are used (since many researchers left the R&D sector for KIBS, and there are presumably smaller spillovers from present-day R&D sector to the rest of economy). This is exactly what is shown in Table 8: The coefficients are mostly statistically insignificant or marginally significant, and smaller in magnitude when compared to those in Tables 3 and 4. This result is not surprising, given that the research capabilities of contemporary state-owned scientific institutions are reduced relative to the Soviet era.
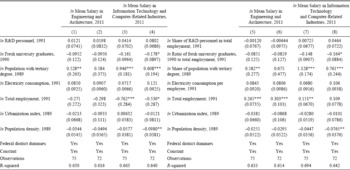
In Table 9, I give the results of regressing log mean salaries by region on log 1991 number of R&D personnel (or log 1991 share of researchers in regional employment) with the same set of control variables. I find no significant association between salaries and late Soviet R&D employment. This suggests that regional labor markets in these industries are integrated, factors prices are equalized, and poverty trap is unlikely to cause the observed persistence.
Human capital externalities in these cases are not manifested in higher wages in regions with greater R&D endowments. Nevertheless, this explanation is consistent with increased number of business services microenterprises in those regions, which signalize vigorous exchange in ideas and ability of KIBS professionals to engage in collaborative undertakings.
CONCLUSIONS
This article examines whether Soviet-era patterns of R&D-sector location influenced the modern-day location of knowledge-intensive business services. Under the central planning, decisions on research institutions location were made in a manner exogenous to the market, thus creating a natural experiment. My article shows that the 1991 R&D employment by region was not significantly associated with several important contemporaneous indicators of economic development and public goods provision, especially when controlling for urbanization and population density.
During the transition, there were severe spending cuts in academia and the R&D sector, which forced many people to move to industry. Ex-researchers may have bridged the shortage of skilled professionals in the service sector due to their high human and social capital. Did this, however, mean that regions where greater number of researchers were gathered under the Soviet rule do better in the development of knowledge-intensive business services during the ensuing decades? The results show the sizeable effect on employment in engineering and architecture as well as in information technology: according to most specifications, 10 percent relative change in 1991 R&D employment is associated with 2–4 percent change in contemporary employment in the respective industries. At the same time, there is no significant effect for employment in law, accounting, auditing, and management consulting. The 2011 number of R&D staff (mostly in legacy state-owned institutions) is also unable to explain contemporary location of knowledge-intensive business services. Therefore, it is likely that the present-day spatial pattern of this sector has been influenced by the one-shot employment leakage from state-owned R&D sector, not by persistent knowledge spillovers between the two sectors.
Two possible explanations for this path-dependence were initially envisioned. Firstly, it might be the case that former researchers were stuck in their initial locations due to poverty traps and labor market imperfections. Alternatively, high concentration of skilled workers in a region might cause human capital externalities. Regions with greater 1991 R&D-related employment do not have lesser mean salaries in KIBS now, so it is unlikely that labor market distortions due to central planning locked former researchers in poverty traps. The number of microenterprises is also greater in those regions in which more people involved in R&D were gathered under the Soviet rule. This is suggestive that exchange in ideas and extensive social ties among former researchers helped some of them to start business in the knowledge-intensive industries in the original locations, and generated human capital externalities sufficient to impose path-dependence in KIBS location during the transition.
In a broader framework, the results do not necessarily imply that the Soviet-era policy of R&D sector placement were effective in the long run. Indeed, the present-day location pattern of KIBS might still bear the imprint of earlier suboptimal decisions due to the path-dependence mechanism. Rather the findings imply that human capital relocation is able to result some kind of spatial QWERTY effect, making arbitrary policy interventions sustainable.
Appendix SAMPLE CONSTRUCTION AND DATA COLLECTION
As of 2011, the Russian Federation has consisted of 80 full-fledged regions. In addition, Khanty-Mansi and Yamalo-Nenets Autonomous Okrugs have been included into Tyumen Oblast, and Nenets Autonomous Okrug has been included into Arkhangelsk Oblast (Tyumen and Arkhangelsk Oblasts are known colloquially as matryoshka regions).
Several observations are dropped due to data availability and reliability concerns: war-torn Chechnya and Ingushetia, which is common practice in Russian regional studies, as well as small and peripheral Chukotka Autonomous Okrug and Jewish Autonomous Oblast, which have data on the key variables missing. None of these regions has distinct specialisation in KIBS.
In addition, Leningrad Oblast is not included in the sample because it had zero fresh university graduates in 1990; therefore, it would be impossible to run log-log regressions with this important control variable if Leningrad Oblast was included. This region, comprising rural areas around St. Petersburg, had no universities on its own territory in 1990, relying instead on superior higher education institutions in St. Petersburg, thus formally outside the oblast. This is atypical among Russian regions, which usually have universities clustered in their regional centers. Therefore, dropping Leningrad Oblast makes the sample more homogenous.
Information on data sources is provided in Appendix Table 1.
DATA SOURCES