

Introduction
Mass gatherings occur frequently in Australia and present a unique set of challenges with respect to attendees’ health and well-being, and the provision of timely and appropriate health care. The potential for illness and injury at these events is higher than in the general community, as a result of the interplay of a range of factors, including crowd density and behavior, weather, and the consumption of alcohol and other drugs.Reference Arbon 1 On-site medical care is provided at most mass gatherings, with the aim of delivering timely health interventions and preventing undue strain on the local community’s health services.Reference Arbon, Cusack and Verdonk 2 In order to appropriately plan and manage on-site health care services, it is important to be able to accurately predict health care needs at each event, including patient volume and types of presenting problems. However, resourcing of on-site health care facilities is predominantly based on previous experiences and anecdotal evidence,Reference Zeitz, Zeitz and Arbon 3 rather than empirical and analytical approaches.
The lack of reliable tools to predict patient presentation rates (PPRs) at mass-gathering events was first identified by Hnatow and Gordon,Reference Hnatow and Gordon 4 who noted that environmental features of events appeared to be significant, albeit poorly understood, contributors to patient load. Similarly, De LorenzoReference De Lorenzo 5 and Michael and BarberaReference Michael and Barbera 6 discussed the wide variation in the number and type of patient presentations at similar mass-gathering events, arguing that a range of event and crowd factors were important contributors to the observed differences. An extensive review of the literature by Milsten, et alReference Milsten, Maguire, Bissell and Seaman 7 in 2002 concluded that multiple inter-related variables influence the number and type of patient presentations at mass gatherings and contribute to an element of uncertainty when planning and resourcing on-site health care facilities.
The influence of event variables, including crowd size, temperature, humidity, and venue type, on patient load at Australian mass gatherings was first estimated by Arbon, et alReference Arbon, Bridgewater and Smith 8 using linear regression modeling. Another model used five key variables to predict patient presentations at mass gatherings in the US; however, the simplicity of the model hindered its utility and applicability to events other than the 55 events at a US college football competition that the model was based on.Reference Hartman, Williamson and Sojka 9 Similarly, a model that predicted injuries based on weather conditions at mass gatherings was too simplistic, as it failed to account for previously identified important event variables, such as crowd characteristics.Reference Baird, O’Connor, Williamson, Sojka, Alibertis and Brady 10
Predicting patient load at mass gatherings is an inherently nonlinear problem. This is illustrated by the nonlinear relationship between patient presentations and many event characteristics. For example, there is a positive correlation between temperature and PPR until the temperature reaches a certain point, after which the PPR begins to reduce, possibly due to extra precautions taken by event attendees.Reference Arbon, Bridgewater and Smith 8
This study aims to build on earlier research by undertaking nonlinear modeling of mass-gathering variables to understand the utility of this approach for prediction of the number of patient presentations at events.
Methods
Data Collection
Data were utilized from two sources: a large, pre-existing and de-identified research data set and additional event data collected as a component of a current study. The research findings using the first data set have been reported previously.Reference Arbon, Bridgewater and Smith 8
The current project considers event characteristics and patient presentation data at 15 mass-gathering events in South Australia over the 2015-2016 summer and autumn seasons. Data were collected at events that met the following inclusion criteria: expected number of attendees>5,000; outdoor setting; and fenced or naturally bounded by roads or natural barriers. Selected events included sporting matches, outdoor concerts, and agricultural shows.
In the current study, variables of interest included weather data, including temperature, humidity, wind speed, and brightness that were captured by freestanding, electronic weather stations (n=2) deployed at each event. The weather stations were positioned at locations evenly spread throughout each venue to capture any weather fluctuations in different areas of each event. The weather stations automatically recorded weather data at 30-second intervals, allowing changes in weather to be monitored over time.
Using standard questionnaires, event and venue characteristics were recorded at the start of each event, while crowd characteristics were documented once per hour by trained fieldworkers (n=2). The fieldworkers completed the crowd characteristics questionnaires while standing in close proximity to their assigned weather station, to capture the conditions at each location. The information recorded on the event and venue questionnaire included event type, location, and duration; availability of alcohol; and presence of security and emergency personnel. The crowd characteristics questionnaire recorded items such as demographics, crowd size, mobility, density, and behavior.
De-identified patient presentation records were obtained directly from the on-site health service provider at the conclusion of each event. Information contained in the records included sex, year of birth, presenting problem, treatment and medication provided, and final disposition. The broader findings of this current study concerning the interactions between environmental aspects and event health services will be reported elsewhere.
For the purposes of testing the utility of nonlinear approaches to prediction of presentations for health care at mass gatherings, data for the 15 South Australian mass gatherings (current study) were combined with data from 201 Australia-wide mass gatherings from the previous studyReference Arbon, Bridgewater and Smith 8 in order to increase the overall sample size and enable meaningful analysis. As a result of combining the two data sets, not all collected data could be used. Some variables were recorded for one of the two datasets, but not both. For some variables, the amount of missing data was too large, while some recorded information was essentially the same for all events and therefore did not have any discriminatory power. The patient presentation types (variables) were adopted from the larger study.Reference Arbon, Bridgewater and Smith 8
Model Construction
To construct a meaningful nonlinear model, the number of occurrences of each variable must be sufficiently large. Separate models were constructed for response variables for which the total number of occurrences was 200 or greater. This resulted in models for six response variables: the total number of patient presentations (TPP); the total number of patients transported (TPT); the number of presentations related to asthma (AST); the number of lacerations (LAC); the number of patients presenting with minor injury or illness (MIN); and the number of patients presenting with other illness or injury not within the categories of any of the original 24 response variables (OTH). Thus, this last category does not include presentations related to cardiac problems, asthma, heat-related presentations, lacerations, fractures, alcohol- or drug-related presentations, or minor injuries or illnesses. In addition, the model was run using the PPR as the response variable.
For each of the six eligible response variables, a separate regression tree was constructed. Regression trees fall within the domain of classification and regression trees (CART) and form a general framework for constructing nonlinear models.Reference Breiman, Friedman, Olshen and Stone 11 , Reference Hastie and Friedman 12 Briefly, the method works by testing a range of threshold values for each input attribute. For each threshold and for each input attribute, two regressions are computed on the response variable, one for the data with values above the threshold and one for the data with values below the threshold. Thus, there are two regression models, each applying to one portion of the data only. The best regression fit obtained over all thresholds and over all input attributes is adopted as the first split. The data are divided into two groups according to this split. The steps above are repeated for each of these two data sets resulting in four data sets and four associated regression models, and so on, until a pre-set limit for the number of splits is attained or the amount of data per data set becomes too small to sensibly divide further. In the jargon of CART, each split represents a branch point and the final subsets into which the data are divided are called leaves (of the tree). All computations were performed using the scientific programming platform Matlab (The MathWorks, Inc.; Natick, Massachusetts USA).
A number of preliminary runs were used to determine that running CART with 12 splits (thus 24 branches) provided reasonable fits and that increasing the number of branches did not provide significantly better fits. Thus, all models were constructed using 12 splits.
Input Attributes
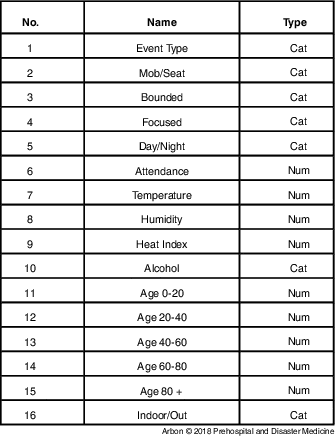
Not all input attributes recorded in the data were used to construct the models. Input attributes were rejected if: (1) the attribute was not recorded for both data sets; (2) information was incomplete or missing; and/or (3) the values were very consistent over all events (thus having no discriminatory power). This left an initial list of 16 input attributes for construction of models (Table 1).
Model Input Attributes

Note: The last column indicates if the attribute is categorical or numerical.
Primary and Secondary Input Attributes
Primary input attributes are those that may be estimated prior to an event without reference to other input attributes. Weather conditions and attendance, for example, are never known exactly prior to an event, but may be estimated with some confidence. The age distribution of the crowd is highly dependent on the type of event. Thus, while the age distribution is likely to influence the number of presentations and types of services required, this input attribute must be estimated from other attributes such as event type and timing (the timing of an event is usually established with the anticipated age distribution in mind). The age distribution is viewed as a secondary attribute as estimates depend on estimates of primary attributes. In this study, the five age attributes and the heat index were viewed as secondary input attributes and the remaining 10 were viewed as primary input attributes.
Models for TPP and TPT were constructed using all 16 input attributes. Separate models were also constructed for TPP and PPR and all other output variables using just the 10 primary input attributes.
Performance Measures
The full data set was used to construct each model. The model was then used to predict the response variable for each event in the data. The true values of the response variable were compared to values predicted by the model to arrive at an error for each event. This is called the training error since the same data were used to measure the error as were used to construct the models. Next, nine-fold cross validationReference Hastie and Friedman 12 was used to estimate the error that may be expected when applying the model in practice. To do this, the data were randomly separated into nine folds of 24 events each. Eight of the folds (192 events) were used to train a new model and this model was used to predict the response variable for the remaining fold (24 events). This was repeated nine times, each time retaining a different fold to predict the response variable. The mean errors of the predicted responses were recorded as the prediction error.
Ethics approval was obtained from the Social and Behavioural Research Ethics Committee of Flinders University (Adelaide, Australia) and the Human Research Ethics Committee of St John Ambulance Australia (Canberra, Australia).
Results
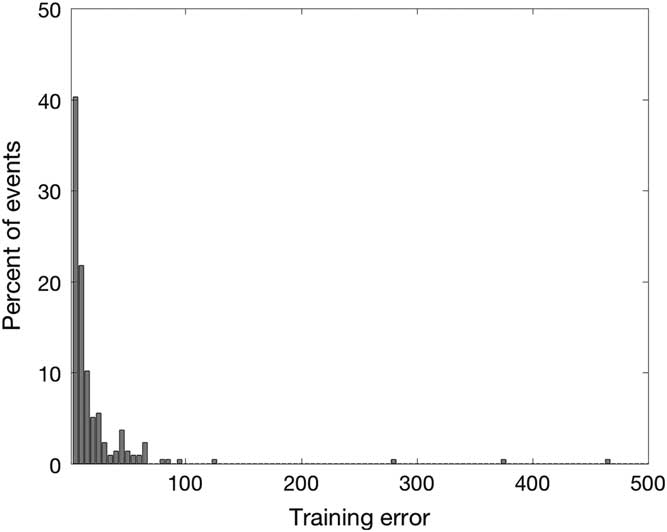
The mean training errors for TPP were very high (50.4 presentations per event; n=216), but the distribution of errors per event was highly skewed with small errors for the great majority of events and a few large errors for some events with many presentations (Figure 1). More specifically, the error for TPP was five or less for 40% of the events and 15 or less for 85% of the events. The median error was 6.9 presentations per event. Highly skewed distributions of errors were observed for both training and testing errors for all models. Mean errors are useful for comparing models, but median errors provide better indications of typical performance.
The Percent of Events with Training Error of a Given Size.

TPP Compared to PPR
Patient presentation rates for individual events produced by the model for PPR were multiplied by the attendance for each event to arrive at estimates of the total number of presentations. The mean error per event from the PPR model (60.6) was approximately 20% greater than the mean error from the TPP model (50.4).
Contribution of Secondary Attributes
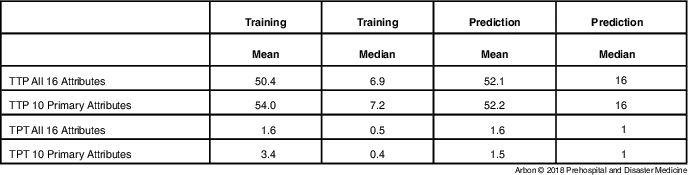
There was very little difference between the errors for models based on all 16 input attributes and models based on just the 10 primary attributes (Table 2).
Training and Prediction Mean Error per Event and Median Error for the Number of TPP and the TPT for Models Based on All 16 Input Attributes and for Models Based Only on the 10 Primary Input Attributes

Abbreviations: TPP, total number of patient presentations; TPT, total number of patients transported.
Performance of the Models
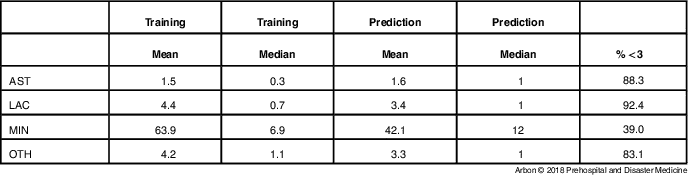
Training and prediction errors for TTP and TPT appear in Table 2. Errors for the remaining models appear in Table 3.
Training and Prediction Mean Error per Event and Median Error for the Number of Patients Presenting with AST, LAC, MIN, and OTH

Note: The last column lists the percentage of events with error less than or equal to three.
Abbreviations: AST, asthma-related problems; LAC, lacerations; MIN, minor injuries or illness; OTH, other problems.
Importance of Input Attributes
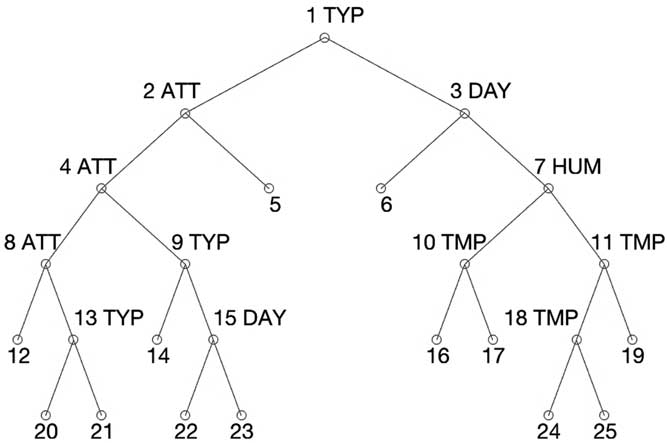
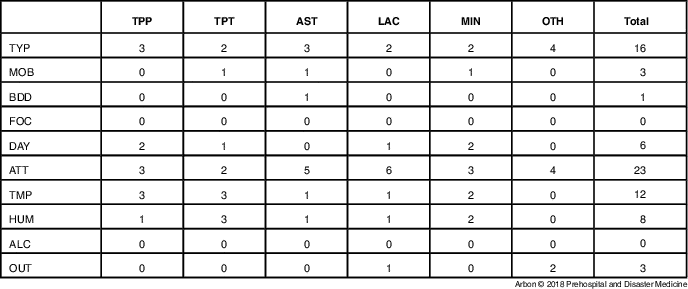
During model construction, each split in the tree is based on the input attribute that best separates the data for the construction of two linear sub-models (Figure 2). The more often a particular input attribute is used as the basis for a split, the greater its role in the ultimate predictions made by the model. The number of times each input attribute was the basis of a split for each model appears in Table 4.
Tree Structure of the Model for TPP. Note: There are 25 nodes:12 splitting nodes (nodes 1, 2, 3, 4, 7, 8, 9, 10, 11, 13, 15, 18) and 13 leaves. The input attribute on which the split is based is given for each splitting node. Abbreviation: TPP, total number of patient presentations.

For Each of the 10 Primary Input Attributes, the Number of Times this Attribute was the Basis for a Split for a Model is Recorded in the Column for that Model

Note: The right most column lists the total number of times a particular input attribute was used over all the models. Each model comprises 12 splits.
Abbreviations: AST, asthma-related problems; LAC, lacerations; MIN, minor injuries or illness; OTH, other problems; TPP, total number of patient presentations; TPT, total number of patients transported.
Discussion
TPP and PPR
The model for predicting TPP outperformed the model for predicting PPR. This is not a surprise since the models constructed here are nonlinear. If PPR is predicted in a nonlinear way, then multiplying the resulting presentation rates by the attendance (a linear operation) to obtain the total number of presentations is more restrictive than incorporating the total attendance as part of the nonlinear model. The situation would be mitigated if the attendance was highly correlated to the number of presentations, but this was not the case. Over the 216 events comprising the data set, the coefficient of correlation between attendance and the number of presentations was r=0.22. This indicates that, even if linear models are used to predict medical services for events, the models should aim to predict the total number of presentations instead of presentation rates.
Primary and Secondary Input Attributes
There is no absolute criterion for assigning input attributes as primary or secondary. In practice, nearly all reasonable input attributes may be viewed as secondary. Forecasts for temperature may well influence attendance, and event type certainly influences attendance. The question is really if a particular input attribute will contribute significant new information relative to predicting the output variable. In this study, the distribution of the age of the crowd and the heat index were judged to contribute little independent information. The heat index, for example, depends in a nonlinear way on temperature and humidity, both of which were included as primary attributes.
The drawback of including many input attributes in a model is that doing so will require the end user of the model to have this information available. Requiring that the age distribution or the heat index for an event be known far enough ahead of time to adjust the planning of services would limit the practicality of the model. Accordingly, models should strive for a balance between the number and availability of input attributes and accuracy.
Here there was no appreciable loss of accuracy when models for TPP and PPR were constructed without the secondary attributes of age distribution and heat index (Table 2).
Overall Accuracy
Table 3 indicates that for most events, all the output variables were predicted accurately. However, very large errors were encountered for some events. This was especially true for predicting the total presentations for very large events. In part, this is due to the fact that very few extremely large events were included in the data and so there were too few examples to allow the models to capture patterns for these events. In addition, the variation in the total number of presentations is bound to increase with the size of events. Many additional examples would be required to adapt these models for very large events.
Importance of Input Attributes
The attendance was responsible for more splits overall and for more splits in nearly every single model (Table 4). As noted earlier, the coefficient of correlation between attendance and patient presentation is low, but this only indicates that linear correlation is low and does not preclude attendance playing a major role in predicting presentations.
Next, the type of event and the temperature were the basis for many splits, with humidity not far behind. Interestingly, temperature and humidity played a larger role than either the type of event or the attendance for predicting the total number of patients transported but played no role in modeling the number of unspecified presentations (OTH).
Alcohol did not contribute to any splits in constructing the models. This may seem surprising, but care must be taken in interpreting this result. Alcohol may well have been responsible for a considerable number of presentations, but if the proportion of alcohol-related presentations is consistent, for example, then alcohol will not contribute to many splits in the modeling process. These results indicate that perhaps alcohol should be viewed as a secondary input attribute, probably dependent on event type and attendance. In addition, alcohol was only recorded as present (officially) or not. Alcohol was present at 199 out of 216 events (92%). Due to the possible discrepancy between the official and actual presence of alcohol, the actual proportion may be higher. With so few alcohol-free events, the models are unable to capture trends for this category. A similar phenomenon may explain that whether an event was focused (88%) or extended did not determine any splits.
The structures of the models depended nearly entirely on five input attributes: the attendance, the type of event, the temperature, the humidity, and the timing of the event (day, night, or both). Thus, although predicting the number of patient presentations, patient transports, and the types of presentations is inherently complex, nonlinear models have been developed that depend on only a few input attributes, each of which may be known, or well estimated, ahead of time to allow planning of medical services at events.
Limitations
It is acknowledged that there is a significant period between the collection of data for the two studies. However, the focus of this paper is assessment of the utility of nonlinear mathematical modeling for planning and to consider any novel findings that emerge from this evaluation and may inform future research. As such, access to a large set of raw data that could be included in the models was the primary concern.
The models (Appendices A - G; available online only) apply to mass gatherings with characteristics that fall within the range of the data set used to generate the models. In particular, all data were collected at events in Australia. In addition, not all combinations of input attribute values appear in the data. The models do provide estimates for combinations not seen in the training data. For example, the split at Splitting Node 9 in the model for TPP is based on the type of event, but not all event types were represented in the training data that arrived at Node 9 in the tree (Appendices A and B; available online only). In such a situation, the value of the output variable (TPP in this case) is the mean of the output values of the events reaching this node. Naturally, these estimates will improve if more diverse events are used to train the models.
Conclusion
This study built on earlier research by undertaking nonlinear modeling of mass-gathering variables to understand the utility of this approach for prediction of the number of patient presentations and transport to hospital demand at events.
Nonlinear modeling provides a more realistic representation, compared to linear modeling, of the interactions within and between important event variables. Consequently, it is appropriate to focus on TPP as the principal outcome measure rather than PPR as rates are not closely linked to total attendance in this data set. Additionally, it can be concluded that TPP has greater utility as an outcome variable than PPR, even when linear models are used for planning.
The 10 primary attributes provide sufficient data and a more simplistic and easily used approach to estimating TPP. Secondary attributes are linked to primary attributes and could be considered redundant or at least unnecessary.
Models developed in this project were less useful in predicting TPP for a few very large events but generally were useful for “typical” community events. Further data are required to confirm this conclusion and to develop models suitable for very large international events.
Attendance and type of event were important variables in determining total presentations, followed by temperature and humidity. Interestingly, temperature and humidity were the most important determinants of TPT and could be a greater driver in ambulance planning.
The role of alcohol was unclear and further research is required, especially focusing on the collection of accurate data on availability, the effect of “loading” prior to the event, and consumption.
The development of nonlinear models that are dependent on few inputs, in this case attendance, the type of event, the temperature, the humidity, and the timing of the event (day, night, or both), is important because the utility and practical use of the models for planning is improved when less information is required to support the prediction.
Large data sets across international events have the potential to provide effective models capable of better supporting planning – especially for novel events where the community has less historical data to support preparations. Improved consensus on minimum data sets and data definitions will be required to support this effort.
The models in Appendices B - G (available online only) may be used with confidence to estimate emergency service requirements for Australian events of the types included in the data. For event types not covered in this study, or for similar events in different cultural or climatic contexts, the specific models presented here may not apply well. However, as a general method, this study demonstrates that regression trees provide a simple way to construct nonlinear models for mass gatherings that are easy to implement and interpret.
Supplementary Materials
To view supplementary material for this article, please visit https://doi.org/10.1017/S1049023X18000493