INTRODUCTION
Scholars have long sought to understand the effects of personal exposure to political events on political attitudes and behaviors. This paper takes a fresh look at the long-term effects of exposure to the risk of conscription during the Vietnam War. Like others who have leveraged random assignment to study the effects of conscription and the risk of conscription, we compare men with high and low draft numbers. Our comparisons make use of two data sources. Between 2014 and 2016, we conducted surveys of men whose names and birthdates were public information available through voter registration lists. Birthdates allow us to ascertain their exposure to conscription risk during the three years of the Vietnam draft lotteries. The surveys furnish extensive information about partisanship and policy orientations, especially those pertaining to issues involving the military. We find no appreciable differences between men with high or low draft numbers. These results are confirmed by public voter files, which show no apparent relationship between draft risk and subsequent party affiliation or voter turnout among more than three million draft-eligible men.
DRAFT RISK BY LOTTERY ASSIGNMENT
Because the Vietnam draft lotteries randomized induction priority, they present an opportunity to isolate the causal effects of draft risk on a wide variety of outcomes. Dozens of studies outside of political science have exploited this random assignment to gauge the causal effects of draft risk on non-political outcomes such as health and employment (see the Online appendix). The Vietnam draft’s prominent role in the politics of the 1960s and 1970s has also led political scientists to investigate the effects of conscription on political attitudes and behaviors.Footnote 1 These studies generally interview small numbers of individuals on narrow sets of war-related topics, finding mixed results on the draft’s effect. Some find that men with safe numbers were more likely to favor faster withdrawal from the war, arguably due to feelings of guilt or cognitive dissonance (Notz, Reference Notz1977; Notz et al., Reference Notz, Staw and Cook1971). Other studies found that men with low numbers were more likely to favor immediate withdrawal (see Bergan Reference Bergan2009 for a re-analysis of a 1973 survey and Erikson and Stoker Reference Erikson and Stoker2011 for a re-analysis of the Youth-Parent Political Socialization Study), express anxiety about their draft status, view the draft unfavorably, and support the establishment of an all-volunteer force (Apsler, Reference Apsler1972). See the Online appendix for an overview of these studies. Taken as a whole, these studies suggest that draft lottery risk may have influenced political attitudes and behavior, although none of the studies is large enough to establish the immediate or long-term effects with precision.
The present study addresses the question of whether the effects of draft risk on political attitudes or behavior are detectable as these men approach retirement age. Theories of political socialization have long contended that generations are stamped with “period effects” that reflect the political climate at the time citizens reach adulthood (Kinder, Reference Kinder2006). While draft risk is just one aspect of the political climate of that era, it clearly loomed large in the minds of draft-eligible men. We seek to test whether exposure to draft risk permanently altered the political outlook of the men who were affected by it.
METHODOLOGY
In order to investigate the long-run effects of the Vietnam draft on men’s attitudes and behavior, we use two complementary approaches. First, we conducted a series of statewide mail surveys of men who were eligible for the lotteries in 1969–1971 in order to measure the long-term effects of the draft on a broad range of political attitudes. Second, we use nationwide administrative data assembled by Catalist based on voter files in 49 states and the District of Columbia. These data allow us to analyze patterns of voter registration, party affiliation, and turnout for over four million draft-eligible men.
Survey
Our sampling frame was men (a) who were draft eligible and (b) whose induction priority can be inferred easily from birthdate. Following Angrist (Reference Angrist1990), we restrict the sample to men who turned 19 in the years preceding the 1969, 1970, and 1971 lotteries (men born in 1950, 1951, and 1952). For the three cohorts, induction priority was assigned uniquely through the lottery. Two complications arise when studying the draft lottery as a source of exogenous variation. The first is that the collection of birthdates were not fully stirred in the machines during the 1969 draft, resulting in time-correlated draft results. Berinsky and Chatfield (Reference Berinsky and Chatfield2015) have shown that this deviation from random assignment is small in magnitude and inconsequential for those who study political outcomes. To guard against bias, our analysis controls for time trends associated with birthdate. Another complication is differential attrition due to deaths during military service, which fell disproportionately on those for whom draft risk was greatest. For our purposes, differential attrition is inconsequential because such a small fraction of men subject to the draft died during military service relative to the cohort of millions of men. Even if all the men who died in Vietnam service after 1969 (approximately 21,000) held low draft numbers from these particular cohorts, attrition would account for less than 1% of men with low draft numbers.
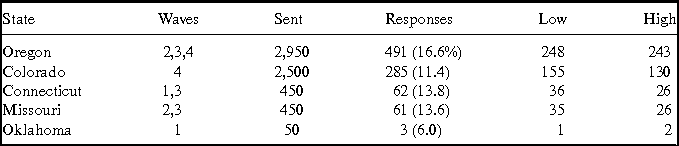
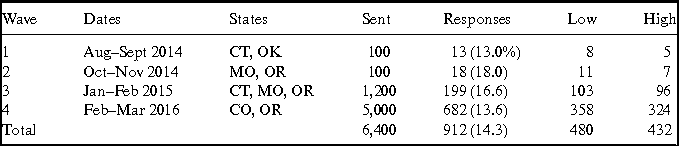
Our survey (see the Online appendix) was designed to assess the long-term effects of draft exposure on a broad range of political outcomes including attitudes and self-reported measures of participation. We conducted two pilot surveys and two larger surveys across five states (Tables 1 and 2). States were chosen primarily to maximize anticipated response rate. We chose Oregon and Colorado for the largest wave (4) because they both have vote-by-mail systems, and therefore tend to have accurate and complete voter registration rolls.
For each wave, we drew a sample from state voter files of draft-eligible men and sent a survey to the address listed for each. This survey was accompanied by a cover letter with a university seal, information about subject rights, and a prepaid return envelope. For each wave, we drew men equally from each combination of state, birthyear (1950–1952), and draft status (high or low draft risk), as shown in Table 3. In order to maximize the probability that we can infer draft status, we only sampled men from the lowest and highest 50 draft numbers in each year (i.e., high risk numbers 1–50 and low risk numbers 317–366). In doing so, we avoid the middle numbers that may have been called in some draft board jurisdictions and not others.
Survey States
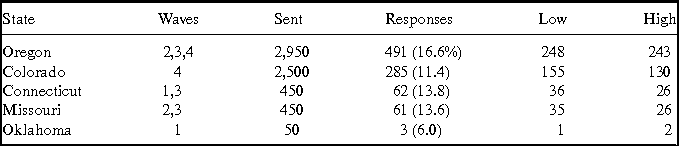
In addition, eight surveys were returned in a form that did not allow us to identify the respondent. Low refers to low draft sequence numbers, and High refers to high draft sequence numbers.
Survey Timeline
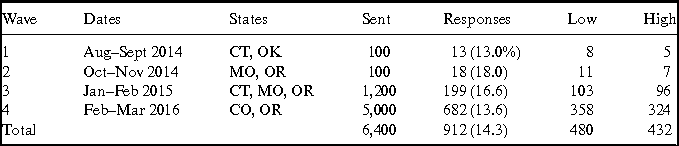
Low refers to low draft sequence numbers, and High refers to high draft sequence numbers.
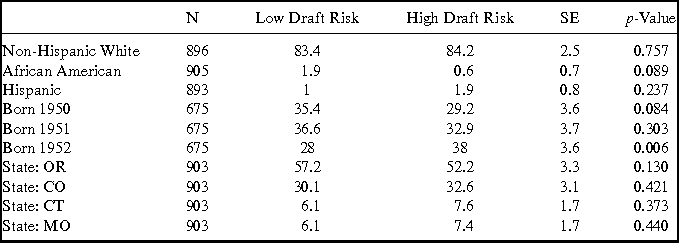
Balance Table (Survey)

The difference in response rates between the low and high draft numbers groups (14.9% vs. 13.6%) is a concern, but this difference is still within the normal range of variation (p = 0.108). In our largest state, Oregon, there is almost no difference in response rates. In order to minimize bias resulting from incidental imbalance, we include birthyear and state fixed effects in our main survey results.
Voter Files Analysis
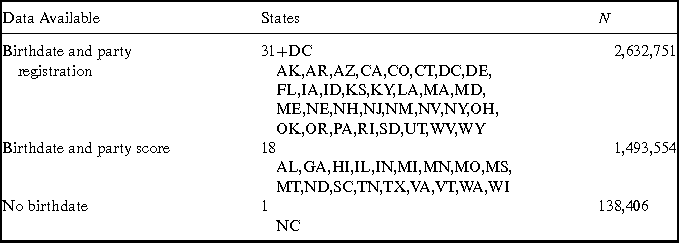
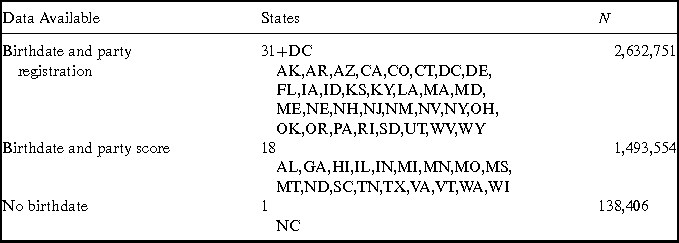
In addition to the survey, we use massive public voter files to study the draft’s effect on three outcomes: registration, voter turnout, and party affiliation. The first outcome variable is the raw number of men registered with each birthdate. Since the draft lottery spanned three years of birthdates, the sample size of this analysis is 1,093 distinct birthdates. The second outcome is the number of votes cast by men of that birthdate in the previous four general elections (2014, 2012, 2010, and 2008). The third outcome variable is restricted to 31 states and District of Columbia, which record each voter’s party, as reported in Table 4. For the other 18 states we investigate, Catalist calculates a likely party score (from strongly Democrat to strongly Republican) based on past primary votes. Results are similar regardless of whether we analyze actual or imputed party affiliation. Of the available states, only North Carolina does not provide birthdates, leaving us with 50 voter files (with just over four million men born 1950–1952) for the party score analysis.Footnote 2
States in Voter Files Analysis
RESULTS
Our analysis of the survey data begins by verifying the relationship between draft lottery status and military service. As expected, we find lottery status to be highly predictive (p < 0.0001), with rates of military service that are 22.9 percentage points higher among men who held low draft numbers.Footnote 3 This relationship between lottery status and military service is similar to rates observed in other studies, including those that use administrative data rather than surveys (Hearst et al., Reference Hearst, Newman and Hulley1986). As shown in the Online appendix, we also find weak effects of draft risk on employment and personal financial conditions, again in keeping with the cognate literature in economics (Angrist and Chen, Reference Angrist and Chen2011; Angrist et al., Reference Angrist, Chen and Song2011).
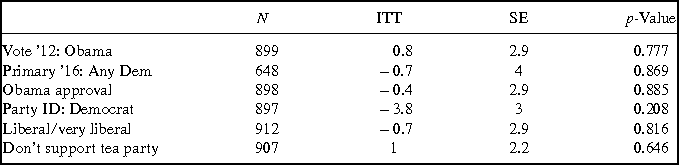
In order to assess the political effects of draft risk, we begin by looking for differences in party identification, presidential approval, or past voting behavior (Table 5). Respondents with higher draft risk are slightly less likely to call themselves Democrats and, accordingly, are less likely to approve of Barack Obama’s performance as president. But these effects are small, and the corresponding confidence intervals always include zero. The same may be said for self-described liberalism/conservatism, which shades slightly in the liberal direction. However, these patterns are well within the margins of random sampling variability. We will return to the question of whether draft risk generates Democrats below, when we examine administrative data on party registration.Footnote 4
Effects on Partisanship (Survey)
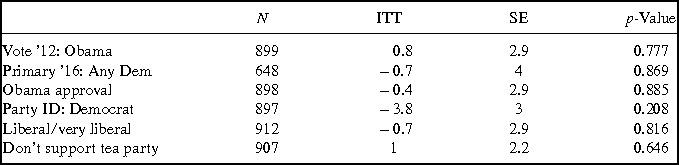
Each row is a separate OLS regression that includes birthyear and state fixed effects. The ITT compares men with high-risk birthdates (numbers 1–50) to those with low-risk birthdates (numbers 317–366). The estimates are expressed in terms of percentage points. SEs are clustered at birthdate level.
What about policy views that are more directly related to defense spending or military intervention abroad? Table 6 reports a striking lack of treatment effects on opinions in this policy domain. The two groups are essentially indistinguishable in terms of support for defense spending. They hold very similar views on the general topic of interventionism versus isolationism. Even questions that raise the issue of whether U.S. military campaigns in Afghanistan or Iraq were a mistake elicited essentially the same responses from both groups. There is slightly more support for increasing spending on veterans among those with greater risk of induction, but the apparent effect is small and statistically insignificant, in keeping with other studies suggesting the limited role of self-interest on policy opinions (Lau et al., Reference Lau, Brown and Sears1978).
Effects on Isolationism (Survey)

Each row is a separate OLS regression that includes year and state fixed effects. The ITT compares men with high-risk birthdates (numbers 1–50) to those with low-risk birthdates (numbers 317–366). The estimates are expressed in terms of percentage points. SEs are clustered at birthdate level.
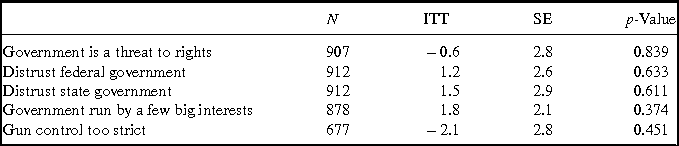
It is often said that exposure to the induction process, the military, or the Vietnam War itself had a corrosive effect on trust in government (Marlantes, Reference Marlantes2017). Table 7 shows no evidence of enduring effects among the men exposed to the draft. Trust in government and political cynicism are very similar among those with high and low draft lottery numbers. If the Vietnam draft diminished trust in government, it was not as a function of exposure to draft risk.
Effect on Distrust in Government (Survey)
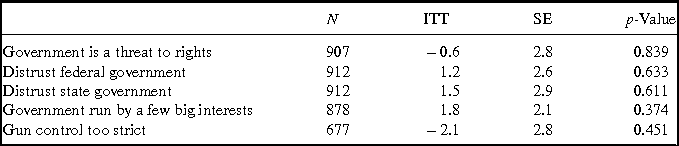
Each row is a separate OLS regression that includes year and state fixed effects. The ITT compares men with high-risk birthdates (numbers 1–50) to those with low-risk birthdates (numbers 317–366). The estimates are expressed in terms of percentage points. SEs are clustered at birthdate level.
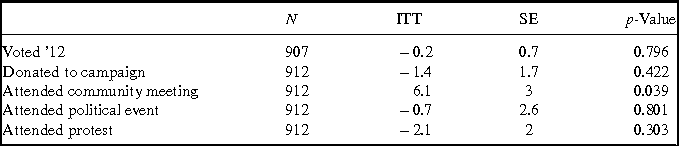
Finally, we consider possible effects on political participation (Table 8). Our survey results provide no support for the hypothesis that draft risk politicized young men in ways that contributed to later political activity. We neither see an increase in self-reported voter turnout nor any appreciable movement in non-electoral forms of participation, such as attending a community meeting or participating in a protest.
Effects on Political Participation (Survey)
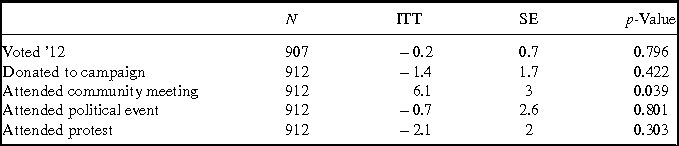
Each row is a separate OLS regression that includes year and state fixed effects. The ITT compares men with high-risk birthdates (numbers 1–50) to those with low-risk birthdates (numbers 317–366). The estimates are expressed in terms of percentage points. SEs are clustered at birthdate level.
Overall, our survey data reveal no enduring effects of draft risk (Table 9). The point estimates hover near zero in every domain of political outcomes. Despite multiple comparisons within and across domains, nothing popped up as statistically significant even by chance. Our survey is not small by the standards of this literature, but we are quick to concede that we cannot conclusively rule out the possibility of substantively meaningful effects. We therefore turn to administrative data for confirmation of the conclusions we draw from our surveys.
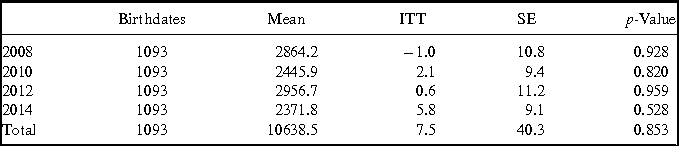
Number of Votes Cast per Birthdate (National Voter File)
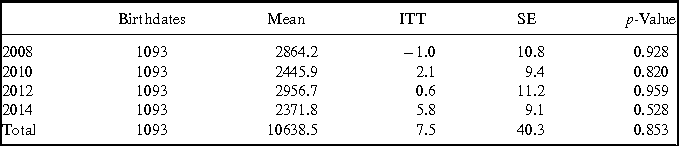
Each row is a single OLS regression on birthdate level with birthyear fixed effects and linear time trend. Treatment is “drafted status”: whether the birthdate received a draft number under the official draft cutoff. The SE of the “Total” line is large because the number of votes associated with each birthdate is highly correlated across elections.
With regard to voter turnout (Table 10), administrative data provide no support for long-term mobilizing effects of draft risk. Grouping men according to their birthdates (and controlling for birthyear), we find no relationship between draft risk and the number of votes cast by each daily cohort. The regression model is as follows:
 $$\begin{equation*}
y_i = \beta _0 + \beta _1 {\hbox{\it drafted}} + \beta _2 time + \alpha _t year + \epsilon _i
\end{equation*}$$
By focusing on the total number of votes cast within each randomly assigned cluster (birthdate), this regression sidesteps the bias that may result when analyzing clusters of unequal size, as would be the case if were studying voting rates by birthdate or individual votes. Using totals also sidesteps the missing data problem that would arise by analyzing individual-level data without observing all men who are not registered to vote.
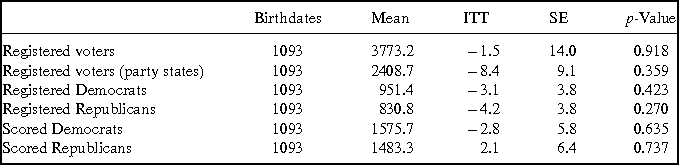
The p-value is non-significant in every election from 2008 to 2014, and even when we pool the votes across all years, the p-value remains 0.32. Low-numbered birthdates had just 1.5 extra voters from a mean of 3,773.
Nor do we find evidence of effects on party registration. The subset of states which listed voter registration had slightly fewer registrants overall on low-numbered birthdates (p = 0.36), but there was no observed difference in the balance between registered Republicans and Democrats. In keeping with our survey results, both turnout and party affiliation are scarcely affected by draft risk (at most, a few tenths of a percentage point).
Number of Registered Voters per Birthdate (National Voter File)
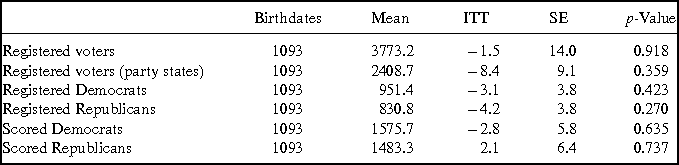
Each row is a single OLS regression on birthdate level with birthyear fixed effects and linear time trend. Treatment is “drafted status”: whether the birthdate received a draft number under the official draft cutoff. See Table 4 for states with party registration.
DISCUSSION
The apparent lack of long-term lottery-induced effects has important implications for the study of political socialization and attitude change (cf. Alwin et al., Reference Alwin, Cohen and Newcomb1991). To date, a few experiments, natural or otherwise, have assessed the long-term effects of life-altering interventions on political attitudes. The effects of the Vietnam draft are especially germane for theories of political socialization, because the draft affected men who were still in the formative years of young adulthood. The fact that these effects cannot be detected when these men approach retirement age suggests that the effects of significant events and experiences fade or are overwhelmed by more recent stimuli.
CONFLICTS OF INTEREST
The authors declare that they have no conflicts of interest involving this research.
SUPPLEMENTARY MATERIAL
To view supplementary material for this article (Davenport et al., Reference Davenport, Green and Hanson2018), please visit https://doi.org/10.1017/XPS.2018.18.