INTRODUCTION
Quantitative reconstructions of regional climate are key to understanding climate variability and forcing mechanisms (IPCC AR5, 2013; Mohtadi et al., Reference Mohtadi, Prange and Steinke2016). Recent advances in quantitative environmental reconstruction have led to the rapid expansion of fossil-based quantitative paleoenvironmental reconstructions. Among the numerous fossil indicators, fossil phytoliths have emerged as a promising proxy with which to quantify past environmental changes in several regions (Wu et al., Reference Wu, Lü, Sun, Guo and Liu1994; Prebble et al., Reference Prebble, Schallenberg, Carter and Shulmeister2002; Prebble and Shulmeister, Reference Prebble and Shulmeister2002; Lü et al., Reference Lü, Wu, Yang, Jiang, Liu and Liu2006, Reference Lü, Wu, Yang, Jiang, Liu and Liu2007).
Lü et al. (Reference Lü, Wu, Yang, Jiang, Liu and Liu2006, Reference Lü, Wu, Yang, Jiang, Liu and Liu2007) reconstructed the mean annual temperature (MAT) and mean annual precipitation (MAP) since the last interglacial period (~130 ka) on the Chinese Loess Plateau (CLP) by fossil phytolith assemblages. Phytolith-climate transfer functions were generated by weighted averaging plus partial least-squares methods (WA-PLS; Birks, Reference Birks1998) based on 243 surface soil samples across China, which are reliable for reconstructions. This pioneering work has made the transfer function available for subsequent quantitative reconstructions of paleoclimate in China. The advantage of WA-PLS is that it does not require a one-to-one correspondence of species and phytolith morphotypes, which is common prerequisite for many fossil-based paleoclimate reconstructions. The same plant species can produce different types of phytoliths (i.e., multiplicity), however, and different species can produce the same phytolith morphotypes (i.e., redundancy; Piperno, Reference Piperno2006). This prevents the use of other methods, such as the coexistence approach (CA), which requires a one-to-one correspondence between a species and phytolith morphotypes.
Several techniques have been proposed to solve the problems of multiplicity and redundancy and the ability to describe, measure, and assign phytoliths to specific plant taxa through morphometric analysis has rapidly developed. For example, Gu et al. (Reference Gu, Liu, Wang, Li and Yu2016) illustrated different genera of bamboos can be distinguished by the detailed shape of saddle phytoliths. Cai and Ge (Reference Cai and Ge2017) used machine learning to distinguish short cell phytoliths from different linages of Poaceae. In addition, with the development of a biogeographical database and a database of climatological observations, it is possible to calculate the climate range (ecological amplitude) of each species, which provides a robust foundation for the CA. The combination of these two facts offers an opportunity to use fossil phytoliths to quantitatively reconstruct past climates using the CA based on a high-quality species-climate database. Compared to the transfer function method, the CA offers a simple method for producing reliable distributions and climate reconstructions while avoiding the problem of strong spatial autocorrelation (Telford and Birks, Reference Telford and Birks2005; Birks et al., Reference Birks, Heiri, Seppä and Bjune2011).
Here, we present a method for quantitatively reconstructing paleoclimate based on a species-climate database and phytolith assemblages. This method includes two steps: (1) establishing a database of local species and corresponding climate data; and (2) using the CA method, based on the past grass community inferred from fossil phytoliths, to quantitatively reconstruct paleoclimate change.
We apply this method to sand-loess sequences near the marginal of the Asian summer monsoon in northern China. Sand-loess sequences in the desert-loess transition zone are sensitive to variations of Asian monsoon and provide one of the best terrestrial archives of past climatic changes and atmospheric dust activities (Lu et al., Reference Lu, Miao, Zhou, Mason, Swinehart, Zhang, Zhou and Yi2005, Reference Lu, Yi, Liu, Mason, Jiang, Cheng, Stevens and Xu2013a, Reference Lu, Yi, Xu, Zhou, Zeng, Zhu, Feng and Dong2013b; Stevens et al., Reference Stevens, Buylaert, Thiel, Újvári, Yi, Murray, Frechen and Lu2018). To date, a quantitative reconstruction of paleoclimatic change since the last interglaciation in this monsoon marginal region has not been undertaken. Our results, although uncertain, can be improved with ongoing species-climate and ecosystem database construction.
GEOLOGICAL AND GEOGRAPHICAL SETTING
The section studied is the Zhenbeitai (ZBT; 38°19′41.9″N, 109°43′51.4″E; 1187 m asl), which has a thickness of 16.8 m and located on the boundary between the Mu Us desert and the CLP (Supplementary Figure 1). The annual mean temperature is approximately 8.0°C, the annual precipitation is ~400 mm, and most rainfall occurs in the summer, brought by the Asian summer monsoon circulation. Due to the high atmospheric pressure over Siberia, the prevailing winter winds in this area are northwesterly.
Mantled by a sandy loam soil (0–0.6 m), the loess-sand sequence can be divided into two light-yellow, sandy loess units and one interbedded sand unit (2.9–4.7 m) based on their color, structure, and particle size. The boundary between the upper, dark sand and the lower, yellow sand occurs at 3.3 m, without other obvious distinctions. In addition, calcium concretions were found at the bottom of loess (16.6–16.8 m). A total 33 samples were collected from the freshly prepared vertical profile for phytolith analyses. Samples for grain-size and magnetic-susceptibility analyses were collected at 5-cm intervals. The chronology of this profile was well established by optically stimulated luminescence dating (OSL; Wu et al., Reference Wu, Lu, Yi, Xu, Gu, Liang, Cui and Sun2018). Bayesian age-depth modelling was performed using the Bacon code (Blaauw and Christen, Reference Blaauw and Christen2011), based on the 25 quartz OSL and K-feldspar pIRIR290 ages from the section.
METHODS
Phytolith extraction and classification
Phytoliths were extracted from the sediments using a slightly modified version of the procedure from Piperno (Reference Piperno2006). This procedure consists of deflocculation with sodium pyrophosphate (Na4P2O7), treatment with 30% hydrogen peroxide (H2O2) and cold 15% hydrochloric acid (HCl), followed by heavy liquid separation using zinc bromide (ZnBr2, density = 2.35 g/cm3) and mounting on a microscope slide with Canada Balsam. For each sample extracted, at least one microscope slide was prepared for phytolith counting and analysis on a compound microscope at 400× magnification. Over 200 diagnostic phytoliths were counted when possible to produce statistically reliable results; the total phytoliths count could be over 2000 (Supplementary Table 3). To quantitatively reconstruct paleoclimate using two methods, the classification of the phytoliths followed Strömberg et al. (Reference Strömberg, Dunn, Madden, Kohn and Carlini2013) for the CA, while the classification followed Lü et al. (Reference Lü, Wu, Yang, Jiang, Liu and Liu2006) for the transfer function method.
Analysis of vegetation and grass community
The analytical approaches in this part following Strömberg et al. (Reference Strömberg, Dunn, Madden, Kohn and Carlini2013). Vegetation structure is inferred by comparing forest indicator phytoliths (FI TOT) to diagnostic grass phytoliths (GSSC). To examine the spatiotemporal changes in tree cover, we use the ratio of the sum of forest indicator phytoliths to the sum of forest indicator phytoliths and grass silica short cells, FI TOT / (FI TOT + GSSC). Confidence intervals (95%, unconditional case, using the total count as the sample size) are calculated for the FI-t ratio (Supplementary Table 3). Grass community composition was assessed by examining the contribution of GSSC typical of (a) closed-habitat versus open-habitat grasses (CH TOT versus remaining GSSC classes) and (b) Pooideae versus PACMAD open-habitat grasses (POOID-D + POOID-ND versus PAN + CHLOR + PACMAD general). We inferred the positions of sites in the landscape (microhabitat) and proximity to water using the frequency of phytoliths typical of wetland plants, semiquantitative estimations of the relative abundances of sponge spicules, and available sedimentological information.
Quantitative reconstruction
The CA
CA uses the climate tolerances of all the nearest living relatives known for a given fossil flora, which has been widely used to reconstruct paleoclimate from pollen and plant macrofossils (Mosbrugger and Utescher, Reference Mosbrugger and Utescher1997). Here, we use the principle of CA and apply it to phytoliths, which can distinguish most subfamilies of Poaceae (Piperno, Reference Piperno2006). Knowing the climate range of each subfamily of Poaceae is fundamental for using phytoliths to quantitatively reconstruct past climate by the CA; likewise, the reconstruction of regional climate requires the climate range of regional species. These ranges are calculated from the combined modern distribution data and climatic data for each species; therefore, a database that contains such information is required for these methods.
Theoretically, if enough detailed data of modern ecosystem exist, the modern analogue matching procedure could be applied. Unfortunately, these types of data are not available through open access. With limited ecosystem data, we determine the dominate subfamily based on fossil phytolith assemblage (assuming that it is a grasses-dominated ecosystem), and match it with the modern ecosystem which is dominated by this subfamily. We further determine the optimum climate value and the distribution of these dominate species to narrow the climate range reconstructed by the CA.
To build a regional (China) species-climate database, we constructed a new global species-climate database (Supplemental Information, global species-climate dataset); the final database consisted of 9,390,524 collections spanning 567 genus and 6010 species with corresponding MAT, warmest month mean temperature (WMMT), coldest month mean temperature (CMMT), MAP, warmest month mean precipitation (WMMP), coldest month mean precipitation (CMMP), and difference in temperature of the warmest and coldest months (DT). For regional species (grasses in China), we extracted the records of all Poaceae species from the Flora of China (http://frps.iplant.cn/), which consisted of 247 genus and 1960 species. After matching the data with those of global species and removing the invasive species or introduced species, the dataset for China spanned 177 genus and 598 species, with corresponding MAT, WMMT, CMMT, MAP, WMMP, CMMP, and DT values. The classification also followed the latest phylogenetic studies (Soreng et al., Reference Soreng, Peterson, Romaschenko, Davidse, Zuloaga, Judziewicz, Filgueiras, Davis and Morrone2015, Reference Soreng, Peterson, Romaschenko, Davidse, Teisher, Clark, Barberá, Gillespie and Zuloaga2017). For the ecosystem data, we extracted all ecosystem types and their distributions in China (http://www.ecosystem.csdb.cn). The ecosystem data consists of 866 ecosystem types, including 586 formations and 280 subformations, in which 105 ecosystem types are dominated by species of Poaceae. After matching these species with their corresponding climate data, the resulting dataset consist of 64 Poaceae species and their corresponding distribution and MAT, WMMT, CMMT, MAP, WMMP, CMMP, and DT values.
Transfer function method
The transfer function method used 243 surface sediment samples for calibration, collected across broad ecological and climatic gradients in China (Lü et al., Reference Lü, Wu, Yang, Jiang, Liu and Liu2006). MAT and MAP were quantitatively inferred using a unimodal response model, which was based on weighted averaging partial least squares regression and calibration (WA-PLS; Birks, Reference Birks1998; Lü et al., Reference Lü, Wu, Yang, Jiang, Liu and Liu2006). The modelling was performed using the package “riojia” in the R (https://www.r-project.org/). The results show that phytoliths can provide robust estimates of MAP (R 2-boot = 0.90, where R 2-boot is the adjusted coefficients of determination R 2 between bootstrap predicted and observed values), root-mean-square error of prediction (RMSEP) = 148 mm, and MAT (R 2-boot = 0.84, RMSEP = 2.52°C).
RESULTS
Grasses in China
All nine subfamilies of Poaceae have species distributed in China: Aristidoideae has 5 species; Arundinoideae has 6 species; Bambusoideae has 35 species; Chloridoideae has 59 species; Danthonioideae has 2 species; Micrairoideae has 6 species; Oryzoideae has 12 species; Panicoideae has 186 species; and Pooideae has 287 species. Compared to the climate data associated with global grasses (Supplementary Table 3), grasses in China show little difference in their temperature preference; Pooideae still occupy the cool end of the spectrum and other subfamilies are indistinguishable. However, the precipitation preferences of the grasses are quite different: Pooideae stand apart as inhabiting the driest environments of all subfamilies. Chloridoideae are adapted to more humid environments than Pooideae, but drier environments than Panicoideae, Oryzoideae, and Bambusoideae (Fig. 1).
Species accumulation curves for the mean annual temperature and precipitation in China, sorted by major grass subfamilies. These data represent the 598 species recorded in the Flora of China (http://frps.iplant.cn/), although the collection localities were not necessarily in China.

The climate ranges of the Poaceae subfamilies in China are smaller than that in the global data (Table 1). The climate range of Micrairoideae and Danthonioideae appears small mainly due to the influence of a few species (Fig. 2, Table 1). Arundinoideae and Aristidoideae also include few species but have large climate ranges (Fig. 2, Table 1). The four subfamilies above are undistinguishable by fossil phytoliths and their climate ranges are useless for quantitative reconstruction of paleoclimate in most cases. The mean MAT and MAP values of Pooideae grasses are 6.1°C and 707 mm, respectively; however, these grasses are highly differentiated, with some species living in high temperature (Alopecurus japonicus, MAT = 15.3°C) and high precipitation conditions (Festuca japonica, MAP = 1674 mm). Panicoideae grasses have mean MAT and MAP values of 19.4°C and 1424 mm, respectively, and are also highly differentiated, with some species living in cold and dry environments (Pennisetum lanatum, MAT = 3.3°C, MAP = 504 mm). Chloridoideae is a special subfamily because two of its species (Orinus thoroldii, MAT = 0.1°C, MAP = 273 mm; Cleistogenes squarrosa, MAT = 1.5°C, MAP = 338 mm.) live in cold and dry environments, which are common in northern China, while its other species live in warm and humid environments common in southern China (Fig. 2 and 3). Bambusoideae and Oryzoideae tend to live in close habitats that offer good lower limit of temperature and precipitation: Fargesia spathacea (MAT = 7.9°C, MAP = 738 mm) is adapted to the coldest and driest environments in Bambusoideae and Leersia oryzoides (MAT = 9.7°C, MAP = 812 mm) is adapted to the coldest and driest environments in Oryzoideae.
Climate range of each subfamily of Poaceae in China. CMMP, coldest month mean precipitation; CMMT, coldest month mean temperature; DT, difference in temperature of the warmest and coldest months; MAP, mean annual precipitation; MAT, mean annual temperature; WMMT, warmest month mean temperature; WMMP, warmest month mean precipitation.

Wilkinson dot plots for mean annual temperature and precipitation of 598 species in China, sorted by major grass subfamilies. Red dots represent species that dominant the grassland according to the ecosystem data of China (http://www.ecosystem.csdb.cn). Gray boxes represent the climate range reconstructed using the coexistence approach on phytolith assemblages in the Zhenbeitai section. (For interpretation of the references to color in this figure legend, the reader is referred to the web version of this article.)

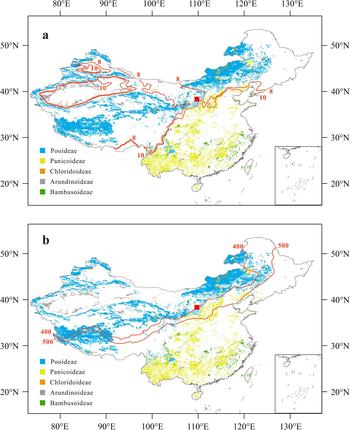
Distribution of ecosystems dominated by Poaceae grasses, sorted by major grass subfamilies. The data are from the ecosystem types and their distribution in China (http://www.ecosystem.csdb.cn). The red square represents the location of this study (the Zhenbeitai section). Red lines represent: (a) the mean annual temperature contour lines of 8 and 10°C in mainland China (1991 to 2015); and (b) the mean annual precipitation contour lines of 400 and 500 mm in mainland China (1991 to 2015). Data are from Centre for Environmental Data Analysis (http://www.ceda.ac.uk/). (For interpretation of the references to color in this figure legend, the reader is referred to the web version of this article.)

Quantitative reconstruction
Vegetation and grass community
Of the 33 samples from the ZBT section, 13 yield sufficient phytoliths for quantitative reconstruction. These samples are concentrated in the top part of the deposit (Fig. 4 and Supplementary Table 3). We exclude surface sample from the reconstruction since it probably has been disturbed by human activity. Most of the samples used for the quantitative analysis did not contain palm and other forest-indicator morphotypes. The relative abundance of trees (FI-t), ranged from 0–2% (Supplementary Table 3). All samples are dominated by grass silica short cells (GSSCs) from many types of grasses, in which open-habitat grasses dominated the grassland. The grass community exhibited variations over time rather than an unchanging vegetation structure (Fig. 5 and Supplementary Table 3); however, it was dominated by Pooideae grasses (49–94% of GSSCs), with abundant Panicoideae (2–23% of GSSCs) and a few Chloridoideae (1–11% of GSSCs) throughout time. In general, the vegetation in ZBT since ~70 ka was an open-habitat grassland dominated by cold and dry-adapted Pooideae grasses.
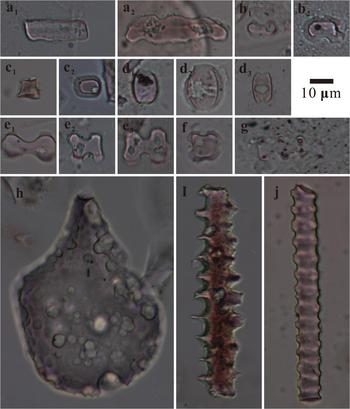
Examples of phytoliths from the Zhenbeitai (ZBT) profile. (a and b) Trapeziform sinuate (POOID-D). (c and d) Stipa-type bilobate (POOID-D). (e and f) Conical rondel (POOID-ND). (g–i) Saddle (CHLOR). (j–l) Panicoid bilobate (PAN). (m) Cross (PAN). (n) Cylindrical polylobate (PAN). (o) Cuneiform bulliform cell (NDG). (p) Elongate echinate (NDG). (q) Monocotyledon tracheary element (NDG). (h, o–q) from ZBT-100; (j) from ZBT-150; (m) from ZBT-250; (g and i) from ZBT-300; (n) from ZBT-350; (b and d) from ZBT-400; (a, k, l) from ZBT-500; (e and f) from ZBT-700; (c) from ZBT-750.

Luminescence age-depth relationship, stratigraphy, and phytolith records from the Zhenbeitai profile. In the left pane, ages are plotted with 1 SD errors and Bayesian age-depth models are shown as solid black (weighted mean age) and blue (1 SD uncertainty envelope) lines; a hiatus is indicated at the red line. Data from Wu et al. (Reference Wu, Lu, Yi, Xu, Gu, Liang, Cui and Sun2018). In the right pane, black circles indicate phytolith samples with fair to very good phytolith preservation that have enough phytoliths for quantitative reconstruction. Black open circles indicate phytoliths samples with poor phytolith preservation that yield insufficient phytoliths for quantitative reconstruction. Phytolith assemblages show the relative abundance of the forest indicators and grass silica short cells (FI TOT + GSSC) and exclude non-diagnostic grasses (NDG) and others (NDO). (For interpretation of the references to color in this figure legend, the reader is referred to the web version of this article.)

CA
There are three subfamilies of grasses present in the profile: Pooideae, Panicoideae, and Chloridoideae. No subfamilies appear or disappear after ~70 ka. We find several long saddle morphotype phytoliths, which could be from either Bambusoideae or Chloridoideae. Thus, we exclude Bambusoideae for paleoclimate reconstruction for the sake of conservation. The resulting climate parameters of the ZBT site since ~70 ka are as follows: MAT = 3.3–15.3°C, MAP = 442–1673 mm, WMMT = 13.8–26.4°C, CMMT = −8.9–9.0°C, DT = 10.9–24.1°C, WMMP = 43–257 mm, CMMP = 6–120 mm (Table 2).
Reconstructed climate parameters for the Zhenbeitai section and comparison with the modern climate of Yulin, calculated by the coexistence approach (CA) method and ecosystem matching. CMMP, coldest month mean precipitation; CMMT, coldest month mean temperature; DT, difference in temperature of the warmest and coldest months; MAP, mean annual precipitation; MAT, mean annual temperature; WMMT, warmest month mean temperature; WMMP, warmest month mean precipitation.

CA only considers the presence/absence of certain components and ignores the relative percentage of each component. We try to narrow down the reconstructed climate range by matching the paleograss community with modern grass community data (ecosystem data). The vegetation of our study site was dominated by Pooideae grasses (49–94%), according to our phytolith assemblages. Modern ecosystems dominated by Pooideae grasses are mostly distributed in northwestern China (Fig. 3); the optimum climate values for these species are shown in Figure 2 and Supplementary Figure 4. The grasslands dominated by Pooideae species have MAT values below 11°C, except Deyeuxia arundinacea (MAT = 12.3°C) is mainly distributed in regions of southeastern China that have high precipitation (MAP = 1126 mm). The grasslands dominated by Panicoideae grasses have MAT values above 11°C (Bothriochloa ischaemum has a minimum MAT = 11.2°C). Hence, we set the boundary to 11°C and the reconstructed MAT in the ZBT site is 3.3–11°C. For MAP, the grasslands dominated by Pooideae species have values less than 900 mm, except Deyeuxia arundinacea (MAP = 1126 mm) is found in high temperature regions (MAT = 12.3°C). The grasslands dominated by Panicoideae grasses have MAP values above 800 mm, except Cymbopogon caesius has a lower value (MAP = 712 mm) and is distributed along the coast of northern China. Hence, we set the boundary to 800 to ~900 mm and the reconstructed MAP for the ZBT site is 442–900 mm. The other climate parameters were also calculated following the same principle: the boundary of WMMT = 20°C, CMMT = 2°C, DT = 15–18°C, WMMP = 60–130 mm, and CMMP = 22–74 mm.
Transfer function method
The reconstructed MAT and MAP values of 13 samples versus age are summarized in Table 3 and Figure 6. During 73–68 ka (corresponding to the Marine Oxygen Isotope Stage [MIS] 5/MIS 4 transition), three samples exhibit a decline in MAT and MAP, which decrease from 7.6°C and 549 mm to 4.6°C and 307 mm, respectively. At ~58 ka (corresponding to the end of MIS 4), only one sample has a high MAT (9.6°C) and MAP (626 mm) values; however, the total phytolith count of this sample is 135, which probably results in a large error (Supplementary Table 3). During 14–11 ka (corresponding to the deglaciation), three samples have relatively stable MAT (6.6–7.8°C) and MAP (515–551 mm) values. The MAT and MAP at 6–2 ka exhibit relatively large fluctuations and range from 5.2°C and 403 mm to 7.6°C and 608 mm. In general, the reconstructed MAT is approximately 5–10°C and the reconstructed MAP is approximately 300–600 mm.
(a) The percentage of Pooideae grasses estimated by phytolith assemblages, used as a proxy of temperature and/or precipitation; error bars show the 95%, confidence intervals for the unconditional case and using total phytoliths count as the sample size. (b) Reconstructed mean annual precipitation (MAP) and (c) mean annual temperature (MAT) for the Zhenbeitai (ZBT) section; points with error bars are calculated by the transfer function method (Table 3) and the shaded areas are calculated by the coexistence approach and ecosystem matching. Error bars on the age (a–, c) are based on the results of the Bayesian age-depth model, which used Bacon code (Blaauw and Christen, Reference Blaauw and Christen2011) following Wu et al. (Reference Wu, Lu, Yi, Xu, Gu, Liang, Cui and Sun2018). (d) Median grain size and (e) magnetic susceptibility (MS) of the ZBT section on an independent timescale for the last 110 ka (Wu et al., Reference Wu, Lu, Yi, Xu, Gu, Liang, Cui and Sun2018). (f) 65°N July insolation (Berger and Loutre, Reference Berger and Loutre1991). (g) Benthic LR04 δ18O stack and marine oxygen isotope stages/boundaries (Lisiecki and Raymo, Reference Lisiecki and Raymo2005).

Reconstructed mean annual temperature (MAT) and mean annual precipitation (MAP) for the Zhenbeitai section, calculated by the transfer function method. RMSEP, root-mean-square error of prediction. Age data from Wu et al. (2018).

Discussion
The vegetation type in the ZBT site since ~70 ka is open-habitat grassland dominated by cold- and dry-adapted Pooideae grasses, which is similar to the modern vegetation type: temperate needle grass arid steppe. The results of the CA and ecosystem matching are unable to determine exact climate variations over time because of the limited ecosystem data; however, they still allow a quantitative reconstruction of climate parameters (Table 2). Compared with the climate data of the Yulin weather station, modern MAT falls within the range of our reconstructions while the modern MAP is lower than those of our reconstruction. In addition, as illustrated in Figure 3, the distribution boundary between Pooideae and Panicoideae grasses generally occurs at a MAT of ~10°C, which is consistent with our reconstruction. However, the boundary also occurs at a MAP of 400 to ~500 mm, which is much lower than the values in our reconstruction. This indicates that the reconstruction works well for temperature-related parameters (MAT, WMMT, and CMMT) but is biased for precipitation-related parameters (MAP, WMMP, and CMMP). There are two possible explanation: (1) the calculated climate parameters prone to inherent biases in sampling, human activity, the competition between species and landform; or (2) the limiting factor for the growth of these grasses is temperature rather than precipitation. A combination of both is also possible.
The prevailing assumption is that fossil phytoliths are representative of the actual vegetation composition of past ecosystems; however, studies suggest the relationship is more complex. First, the same plant species can produce different types of phytoliths (i.e., multiplicity) and many different species can produce the same phytolith morphotypes (i.e., redundancy; Piperno, Reference Piperno2006). The fossil phytolith assemblages do not always precisely reflect the original plant communities. Here, we use diagnostic phytoliths that indicate particular taxa of vegetation and exclude non-diagnostic phytoliths, to avoid the problem of multiplicity and redundancy (Strömberg et al., Reference Strömberg, Dunn, Madden, Kohn and Carlini2013; Supplementary Table 3). Second, the taphonomy of phytoliths is still an open question. For tree cover, phytoliths are accurate for the tropics and are uneven outside of the tropics (Strömberg, Reference Strömberg2004; Dunn et al., Reference Dunn, Stromberg, Madden, Kohn and Carlini2015). For grasses, there is no clear evidence of which subfamily might be overrepresented (McInerney et al., Reference McInerney, Stroemberg and White2011).
In this study, the preservation of phytoliths changes through the profile (Fig. 4, Supplementary Table 3). Phytoliths are relatively abundant in the top of the profile but rapidly decease downward; in the sand layer, the concentration of phytoliths is 30 grains/g (ZBT-400) or insufficient for quantitative reconstruction; below the depth of 7.5 m, phytoliths are rarely found in the profile. There are several reasons for the poor preservation of phytoliths: first, phytoliths could be partly dissolved due to the alkaline pH of the loess sediments (Liu, 1984); and second, the ZBT section is located in the transition zone between the Mu Us desert and the CLP, where heavy winds and coarse sediments could lead to the destruction of phytoliths. The differences in stability (resistance to destruction and/or alkaline environment) of different morphologies of phytoliths could change phytolith assemblages, which also influences the accuracy of the quantitative reconstruction. The ZBT phytoliths images show that different phytolith morphotypes suffer from a similar degree of erosion (Fig. 4); therefore, it appears that there is no significant difference in the preservation of different morphotypes.
The transfer function method could partly resolve the multiplicity and redundancy by statistical analyses, such as weighted averaging plus WA-PLS; in addition, the transfer function method also partly avoids the problem of taphonomy by using surface sediment samples as the modern training set. This method could produce reconstructions of detailed climate change over time. We compare the transfer function-based reconstruction with those of a qualitative proxy, the percentage of Pooideae grasses (in GSSCs): the result suggest that they general consistent with each other (Fig. 6). During ~121 and ~47 ka, when a loess unit were deposited, three samples indicates a decrease in temperature and precipitation during the transition from MIS 5 to MIS 4. One sample indicates high temperature and precipitation at the end of MIS 4, probably suggesting a reversal of climate from the previous transition period. These variations in climate approximately corresponds to the change in insolation (Berger and Loutre, Reference Berger and Loutre1991) and the deep-sea δ18O record (Lisiecki and Raymo, Reference Lisiecki and Raymo2005; Fig. 6). A hiatus of ~30 ka occurred between ~47 ka and 17 ka, then a sand unit was deposited between ~17 and ~10 ka, and another loess unit was deposited between ~10 ka and present in the ZBT section. This hiatus and sand deposition was probably caused by wind erosion and cold-dry climate (Lu et al., Reference Lu, Stevens, Yi and Sun2006; Wu et al., Reference Wu, Lu, Yi, Xu, Gu, Liang, Cui and Sun2018). Our phytolith analysis results, however, suggest that the temperature and precipitation values at the time when the sand was deposited were not necessarily lower than those when the loess was deposited (Fig. 6).
There are also inconsistency between transfer-function-based reconstruction and our qualitative proxies. The percentage of Pooideae reflects a decrease in temperature and precipitation in the upper loess, from the middle to the late Holocene; however, the MAT and MAP reconstructed by the transfer function method show no particular trend in the Holocene. The pollen-based quantitative reconstruction from nearby areas such as Lake Daihai (Xu et al., Reference Xu, Xiao, Li, Tian and Nakagawa2010) and Qigai Nuur (Sun and Feng, Reference Sun and Feng2013) suggests that both MAT and MAP have decreased since ~6 ka, which is consistent with the variation in Pooideae grasses but is not consistent with the MAT and MAP reconstructed by the transfer function method. We suggest that the reason for this inconsistency is that some phytolith morphotypes, such as the cuneiform/parallepipedal bulliform cell, may originate from many subfamilies of Poaceae. The transfer function was established based on data from a broad area (China) and therefore these morphotypes probably represent production from different subfamilies; at a local scale, these morphotypes may originate from only one subfamily or a few species and cannot properly indicate the MAT and MAP variations at a specific site.
Comparing the two quantitative reconstruction methods, the transfer function method has the advantage of producing a detailed record of climate change; in contrast, our method, based on the species-climate and ecosystem database, is still primitive and full of potential for further development. First, if the modern ecosystem data were completed, the application of a modern analogue matching procedure could produce a narrower reconstructed climate range. Second, we have only calculated the climate parameters of Poaceae grasses, whereas other plants such as Palmae, Sedge, and Chenopodiaceae also may be identifiable by fossil phytoliths. Adding data from these plants could greatly increase the accuracy of the reconstruction. Finally, we used China as an example in this study; however, this method could be applied in any area in which local vegetation and ecosystem data are openly accessible.
CONCLUSION
An investigation shows that regional grasses have specialized climate niches, which indicates that fossil phytoliths are suitable for quantitative reconstructions of paleoclimate by CA. This method was applied to a sand-loess sediment sequence in the Asian monsoon marginal region, northern China, where quantitative reconstructions of past climatic change are lacking. The results show that this area was dominated by cold- and dry-adapted grasses since ~70 ka, indicating a MAT and MAP of ~3.3 to ~11.0°C and ~442 to ~900 mm, respectively. This result is generally consistent with the result from the transfer function method for the glacial and interglacial alternation. Moreover, we offer a simple way to provide reliable distributions and climate data that have clear ecological significance. Although there is large uncertainty, with further improvements to the species-climate and ecosystem database, our method is a promising quantitative approach for the reconstruction of past climatic change.
ACKNOWLEDGMENTS
We thank Mr. Wu Jiang for providing the optical luminescence dating ages. We thank Xianyan Wang, Yao Wang, and Mengyao Jiang for help in revising the manuscript. This research is supported by the National Key R and D Programme of China (Grant No. 2016YFA0600503 and 2016YFE0109500) and the National Natural Science Foundation of China (Grant No. 41690111).
SUPPLEMENTARY MATERIAL
The supplementary material for this article can be found at https://doi.org/10.1017/qua.2019.32.