INTRODUCTION
Parasitic helminths remain as major human and animal pathogens worldwide. A critical factor in helminth infections is the interaction between host and parasites. The host may provide a suitable environment as well as the molecular signals for induction of parasite development. Host-induced signalling in the parasite may result in morphological and physiological processes, perhaps assuring successful infection. Although the success of helminth infection may be critically dependent on specific host signals very little information is available in this area.
Signal transduction pathways are a promising resource for discovery of novel target molecules for developing strategies for control of platyhelminth parasites. The widespread occurrence of insulin-like signalling systems in metazoans has led to the idea that similar systems could also be used for developmental control in parasitic helminths (Dissous et al. Reference Dissous, Khayath, Vicogne and Capron2006). Insulin-like pathways depend on insulin-like receptors (IR) that are highly conserved trans-membrane proteins constituting one group of receptor protein tyrosine kinases. Binding of insulin induces conformational change in the receptor leading to kinase activation and phosphorylation of the intracellular tyrosine kinase domain (Hubbard et al. Reference Hubbard, Mohammadi and Schlessinger1998). The consecutive recruitment of partners and activation of signalling cascades requires an initial docking of an adaptor protein, mainly the Insulin Receptor Substrate (IRS) (Kido et al. Reference Kido, Nakae and Accili2001).
Insulin signalling influences numerous processes, including glucose uptake and metabolism (Kohn et al. Reference Kohn, Summers, Birnbaum and Roth1996; Ueki et al. Reference Ueki, Yamamoto-Honda, Kaburagi, Yamauchi, Tobe, Burgering, Coffer, Komuro, Akanuma, Yazaki and Kadowaki1998; Barthel and Schmoll, Reference Barthel and Schmoll2003; Chang et al. Reference Chang, Chiang and Saltiel2004), protein synthesis (Ueki et al. Reference Ueki, Yamamoto-Honda, Kaburagi, Yamauchi, Tobe, Burgering, Coffer, Komuro, Akanuma, Yazaki and Kadowaki1998; Oldham and Hafen, Reference Oldham and Hafen2003), and growth and cell division (Tamemoto et al. Reference Tamemoto, Kadowaki, Tobe, Yagi, Sakura, Hayakawa, Terauchi, Ueki, Kaburagi, Satoh, Sekihara, Yoshioka, Horikoshi, Furuta, Ikawa, Kasuga, Yazaki and Azawa1994; Chen et al. Reference Chen, Jack and Garofalo1996; Weinkove and Leevers, Reference Weinkove and Leevers2000; Brogiolo et al. Reference Brogiolo, Stocker, Tomoatsu, Rintelen, Fernandez and Hafen2001; Nijhout, Reference Nijhout2003). Insulin signalling also affects processes that control aging and life span (Barbieri et al. Reference Barbieri, Bonafe, Franceschi and Paolisso2003). Very little is known about insulin signalling in platyhelminth parasites despite its potential importance in host-parasite interaction and parasite development. Two IR homologues (SmIR-1 and SmIR-2) were found in the trematode parasite Schistosoma mansoni and both receptors were shown to interact with human insulin in vitro (Khayath et al. Reference Khayath, Vicogne, Ahier, Benyounes, Konrad, Trolet, Viscogliosi, Brehm and Dissous2007). In the cestode Echinococcus multilocularis, an IR homologue (EmIR) was characterized, and was also shown to bind human insulin in vitro (Konrad et al. Reference Konrad, Kroner, Spiliotis, Zavala-Góngora and Brehm2003). The in vivo effect of insulin on helminth parasites was previously studied only in schistosome trematodes and conflicting results were initially reported. Conford (Reference Conford1974) and Levi-Schaffer and Smolarsky (Reference Levi-Schaffer and Smolarsky1981) found that mammalian insulin increased oxygen consumption and parasite viability, while Clemens and Basch (Reference Clemens and Basch1989) did not observe this type of response by the parasite.
Mesocestoides vogae (syn. corti) – Cestoda: Cyclophyllidea – has useful characteristics as a model system for cestodes (Smith, Reference Smith1990). The Tetrathyridia (larval stage) are capable of asexual reproduction and can easily be maintained both in vivo, i.e. in an experimental host (mouse or rat), as well as in vitro. Parasites obtained are far more homogenous both physiologically and genetically than those obtained from natural infections. The relatively straight-forward laboratory manipulation necessary for M. vogae makes it a potentially useful system for functional genomic studies in cestodes.
We describe an initial study of the response of M. vogae larvae to human insulin, in which relevant physiological changes in the parasite larvae were monitored after treatment with the hormone at various levels over time. Since glucose levels are modified by insulin, we measured levels of free-glucose within cultured larvae after treatment with the hormone. We also assessed the effect of insulin on parasite survival and asexual reproduction. Finally, we analysed the parasite tyrosine-phosphorylation status in the presence of insulin.
MATERIALS AND METHODS
Parasite culture
Mesocestoides vogae tetrathyridia (Tt) were maintained by intraperitoneal inoculation of 3-month-old male CD1 mice, followed by peritoneal aspiration after 5 months. The parasites were then extensively washed and suspended in Hank's balanced salt solution, Hss, (Sigma). Tt prepared in this way were used immediately for analysis of the effect of insulin on survival and asexual reproduction. For measurement of the level of free glucose in the parasite and for preparation of material for Western blot (tyrosine-phosphorylation) assays, M. vogae Tt from mice were first cultured in a defined medium at 37°C with 5% CO2 for 10 days. The medium was modified RPMI 1640 medium (GIBCO) as previously described (Britos et al. Reference Britos, Dominguez, Ehrlich and Marin2000), including 10% fetal calf serum (FCS) (Biological Industries, Israel Beit Haemek, Ltd). Preparation of Tt material for RT-PCR experiments also involved first culturing the parasites just obtained from mice in this same defined medium, but for 2 days.
M. vogae Tt free-glucose determination
M. vogae Tt were cultured for 10 days in the medium described above prior to determination of parasite free-glucose with or without the addition of human recombinant insulin (hrINS, Roche). Prior to glucose measurements, treated groups were supplemented with hrINS for 30 min at the following concentration: 0·002 mU/ml, 0·2 mU/ml, 20 mU/ml or 2000 mU/ml. Thirty independent bioassays, each with a similar number of parasites, were analysed at each hrINS concentration. Since insulin treatments at a given concentration were run on separate days, internal controls (without hrINS addition) were included for each analysis (each hrINS concentration). All cultures were performed in RPMI modified medium without added serum. The parasites were harvested by centrifugation for 1 min at 1000 g prior to measuring Tt weight (mg). Tt were then extensively washed in PBS and then homogenized in water. Free-glucose levels were determined using a commercially available glycaemia kit (Wiener Lab). Glucose values (μg) were normalized to Tt weight (mg). Mann-Whitney U-test (MWU) and Kolmogorov-Smirnov test (K–S) (Statistica 6.1 Statsoft Inc., USA) were used to analyse the data.
M. vogae Tt survival and asexual reproduction rates
The effects of hrINS on parasite survival as well as on asexual reproduction rate were determined using parasites freshly prepared after propagation in mice. M. vogae Tt were collected and washed and the parasites were immediately used to set up cultures in both insulin-treated and untreated reference conditions. Insulin-treated cultures consisted of: Tt in RPMI medium plus 0·002 mU/ml, 0·2 mU/ml, or 20 mU/ml hrINS. Reference cultures consisted of: Tt in RPMI medium plus 10% FCS as positive control and Tt in RPMI medium as negative control. Tt were cultured at 37°C, in 5% CO2 for a total of 11 days. Ten independent bioassays were run for each condition. Parasite analysis involved measuring the number of those alive or those undergoing fission. Worms were considered dead when they failed to demonstrate motility (when viewed for several minutes under the microscope). Data were analysed for significant differences using Student's t-test (Statistica 6.1 Statsoft Inc, USA).
Tyrosine-phosphorylation detection
Tyrosine-phosphorylation status was analysed using the ECL phosphorylation detection system (Amersham, Pharmacia Biotech). M. vogae Tt were cultured for 10 days in the defined medium, and then treated with the following concentrations of hrINS for the indicated times: 0·002 mU/ml, 0·2 mU/ml, 20 mU/ml or 2000 mU/ml for 1, 15 or 30 min. Relevant controls were included with each treatment, and experiments were run in duplicate. Treated (or untreated) Tt were homogenized in phospho-protein extraction buffer (Tris-HCl 50 mm pH 7·5, NaCl 150 mm, NP40 1%, NaF 1 mM, EGTA 1 mm, PMSF 1 mm), and protein concentration was measured by the BCA method (Pierce). Equivalent amounts (in μg) of protein from each analysis were examined and compared after separation by 10% SDS-PAGE, transfer to a Hybond-P membrane (Amersham) and exposed to the (ECL kit) antibody following the manufacturer's instructions. Detection of tyrosine-phosphorylation was done using the SuperSignal West Pico Chemiluminiscent Substrate (Pierce) and Hyperfilm MP Autoradiography films (Amersham Pharmacia Biotech). Quantitative analysis of data was done using Scion Image software.
RT-PCR, cloning and sequence analysis
A degenerate RT-PCR method was used to amplify M. vogae Tt sequences with a potential coding region for a tyrosine kinase domain of an insulin-like receptor, i.e. perspective MvIR. Total RNA was extracted from M. vogae Tt, using Tri-Reagent (Sigma) following the manufacturer's instructions with a Tt:Tri-Reagent ratio of 1:10 (v/v). Retrotranscription was done using Superscript II retrotranscriptase (Sigma) using CDS primer (5′-AAGCAGTGGTAACAACGCAGAGTACT30NN-3′, Clontech) and 1 μg of total RNA. The reaction product was kept at −20°C until use. Primers for degenerate PCR were designed based on the Echinococcus multilocularis receptor homologue (Konrad et al. Reference Konrad, Kroner, Spiliotis, Zavala-Góngora and Brehm2003): IR-MAY (5′-ATCGCCGAYGGNATGGCNTA-3′) and IR-WSF2 (5′-AAGAGCACNCCRAANGACCA-3′). The following PCR conditions were used: initial denaturation at 94°C for 5 min, followed by 30 cycles of 94°C for 30 s, 53°C for 30 s and 72°C for 2 min. The final elongation step at 72°C was for 7 min. PCR products were separated by electrophoresis using 2% agarose, and purified using a GFX Gel Band Purification kit (Amersham Biosciences). Purified PCR products were ligated to the pGEM-T easy vector (Promega), and then ligation products were used to transform Escherichia coli XL1. DNA sequences of the cloned PCR product was determined by the CTAG Service, Faculty of Sciences, UDELAR, Uruguay. Sequences were analysed by BLASTX 2.2.15, (Gish and States, Reference Gish and States1993), using the nr database. Sequence alignments were done with the Clustal-X 1.81 algorithm, using default conditions (Thompson et al. Reference Thompson, Gibson, Plewniak, Jeanmougin and Higgins1997). Representative IR sequences used in the analysis were: EmIR (CAD30260) from Echinococcus multilocularis, SmIR1 (AAN39120) and SmIR2 (AAV65745) from Schistosoma mansoni, DAF-2 (AAC47715) from Caenorhabditis elegans, DmIR (AAC47458) from Drosophila melanogaster and HsIR (AAI17173>) from Homo sapiens.
RESULTS
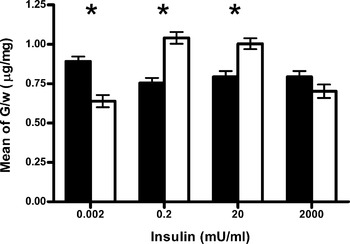
Since insulin induces changes in glucose cellular metabolism, we examined M. vogae parasite-associated free-glucose levels in response to different levels of added host-derived insulin, hrINS. The parasites were first cultured in a defined (RPMI) medium in vitro for 10 days prior to the 30 min challenge with either: 0·002 mU/ml, 0·2 mU/ml, 20 mU/ml or 2000 mU/ml hrINS. Treatment with hrINS resulted in a change in M. vogae Tt free-glucose levels in the RPMI medium without added serum (Fig. 1). This change was dose dependent and could be saturated since, at the highest hrINS concentration tested (i.e. 2000 mU/ml), there were no statistically significant differences in free-glucose levels between the control and insulin-treated parasites. Treatment with the intermediate levels of hrINS (i.e. 0·2 mU/ml and 20 mU/ml) resulted in enhanced free-glucose levels in the parasites. Exposure to 0·2 mU/ml and 20 mU/ml hrINS enhanced glucose concentrations from (0·75±0·17) μg/mg to (1·04±0·20) μg/mg (38%) and from (0·79±0·19) μg/mg to (1·00±0·19) μg/mg (26%), respectively. The opposite effect was observed when the lowest hrINS concentration was tested (0·002 mU/ml) which resulted in a decrease in the free-glucose concentration from (0·89±0·17) μg/mg to (0·64±0·21) μg/mg, (30%). Control groups showed no statistically significant differences in free-glucose levels between them. Since treatment with 2000 mU/ml hrINS did not result in a detectable response in parasite free-glucose content, this level of hrINS was not examined further.
Measurement of glucose content in Mesocestoides vogae tetrathyridia. (▪) Reference group. (□) Challenged group. Data are expressed as glucose content (μg)/ mass of larvae (mg) versus concentration of hrINS (mU/ml). G, glucose content; W, Tt weight. Data shown are the mean±standard error of 30 independent experiments. Asterisks indicate statistically significant differences (P<0·05).

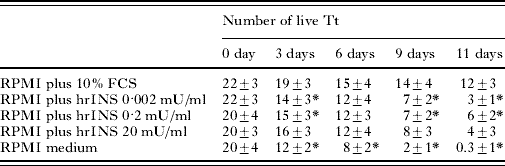
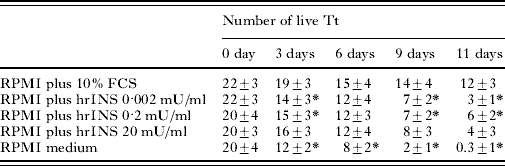
Survival of M. vogae Tt in the modified RPMI medium just after harvesting from mice was analysed in the absence or presence of hrINS. Parasites were cultured and live versus dead Tt were counted on the indicated day for the next 11 days (Table 1). We included 2 control reference conditions, i.e. with and without addition of FCS as positive and negative controls, respectively. On day 0 the means of individuals in all groups were equal. On day 3 no differences in the number of live individuals was observed comparing the group treated with 20 mU/ml hrINS and the positive control, while in the negative control group a significantly lower number of live individuals was evident in comparison. The groups treated with 0·002 or 0·2 mU/ml hrINS survived comparatively less well than those treated with 20 mU/ml hrINS or the positive control, but much better than Tt in the negative control group (see Table 1). By day 6 all insulin-treated cultures had survival levels comparable with survival in the FCS-treated positive control group, and these levels were significantly higher than those of the negative control group. M. vogae larvae survival in vitro for longer periods was also affected by insulin. On day 9 all hrINS-treated groups retained statistically significant higher survival levels compared with the negative control group. On day 9 the hrINS-treated groups, however, had survived less well than the FCS-treated positive control group. Finally, by the end of the experiment, on day 11, all groups had become statistically different from one another. The highest survival level within the hrINS-treated groups was observed those treated with 0·2 mU/ml hrINS (Table 1).
Effect of hrINS on survival of Mesocestoides vogae tetrathyridia in culture
(Tt were maintained in RPMI medium under the culture conditions indicated. The number of live parasites was counted at 0, 3, 6, 9 and 11 days. The numbers shown are the means of live Tt±standard deviation. Asterisks indicate statistically significant differences (P<0·05) for each group with respect to the RPMI plus 10% FCS group.)
The effect of hrINS on in vitro asexual multiplication (reproductive fission) of M. vogae Tt was also investigated. Freshly prepared Tt were maintained in modified RPMI medium at different insulin concentrations, and reproductive fission of the parasites was evaluated after 0, 3, 6, 9 and 11 days. Fission did not affect the whole population neither did it start simultaneously in all dividing organisms. Reproductive fission of Tt was not observed on day 0 in any of the groups, and was not found to occur at any time-point in groups cultured in modified RPMI medium only (negative control) or in RPMI medium supplemented with 0·002 mU/ml insulin. Asexual multiplication was found in 4% of the Tt populations examined from day 3 until the end of the experiment in cultures in which the RPMI medium had been supplemented with 10% FCS (positive control). The level of asexual multiplication observed when Tt were cultured with either 0·2 or 20 mU/ml hrINS was similar to that observed for those treated with 10% FCS, but only until day 6. Reproductive fission was not observed in Tt treated with 0·2 or 20 mU/ml hrINS on the remaining days of the assay, days 9 and 11. Taken together, it can be concluded that hrINS was sufficient to promote M. vogae Tt asexual multiplication, but that this effect was hrINS dose dependent.
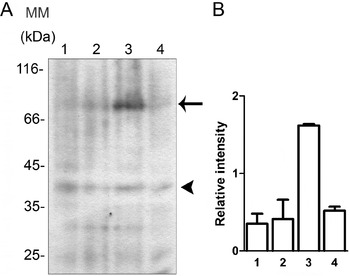
In order to strengthen the link between insulin and the physiological responses observed, i.e. free-glucose content, asexual reproduction and survival, we analysed hrINS-dependent induction of tyrosine-phosphorylation in in vitro cultured M. vogae Tt after 1, 15 or 30 min treatments with the hormone. As shown in Fig. 2, Tt exposed to 0·2 mU/ml of hrINS for 15 min showed strong tyrosine-phosphorylation of a 77 kDa protein. No tyrosine-phosphorylation was detected in either the 1 min or 30 min 0·2 mU/ml hrINS induction treatments. The labelled 77 kDa protein band did not correspond to any intense band observed after Coomassie blue staining of corresponding SDS-PAGE gels (data not shown). The other hrINS concentrations tested did not result in any changes in protein tyrosine-phosphorylation in the cultured M. vogae larvae (data not shown).
Tyrosine-phosphorylation status in Mesocestoides vogae after hrINS treatment (1) without hrINS, (2) 0·002 mU/ml hrINS, (3) 0·2 mU/ml hrINS and (4) 20 mU/ml hrINS. (A) Western blot of Tt homogenates after treatment with hrINS for 15 min. Molecular mass is indicated in kDa. The arrow shows the signal of strong tyrosine-phosphorylation of a 77 kDa protein in a 0·2 mU/ml hrINS challenged group. The arrowhead shows the signal used as internal control in the quantitative analysis. (B) Graphical view of quantitative analysis. Data are expressed as relative intensity between the 77 kDa band (arrow) and the internal control band (arrowhead). Data shown are the mean±standard deviation of biological duplicates.

To address whether an insulin-like receptor could be present in M. vogae a degenerate RT-PCR method was developed and a RT-PCR product of the expected size (250 bp) was obtained. Sequence analysis using BLAST, ScanProsite and ClustalX tools indicated that a single primary structure had been amplified and that it had highest similarity with sequences encoding a putative insulin-like receptor protein tyrosine kinase domain. We designated the corresponding gene product, MvIR. The ORF encoding the MvIR fragment corresponded to conserved subdomains VIb, VII, VIII and the first half of subdomain IX, according to Hanks and Hunter (Reference Hanks and Hunter1995). Crucial motifs for enzymatic function of an insulin receptor tyrosine kinase domain were identified in MvIR: the tyrosine protein kinase specific active-site signature, YVHrDLAARNCLV, where D is an active-site residue, the DFG triplet and the YxxxYY motif (YernYY) of the regulatory region which contains the site for regulatory auto-phosphorylation (White and Kahn, Reference White and Kahn1994; Hanks and Hunter, Reference Hanks and Hunter1995) (Fig. 3). BLASTX searches showed that MvIR had highest similarity with the Echinococcus multilocularis insulin receptor, EmIR (score: 148; E: 9e-35). Alignment with representative insulin receptor sequences using the translated sequence of the (MvIR) RT-PCR product without the primers showed the high conservation degree in this region of the tyrosine kinase domain, where MvIR was 99% identical to the EmIR (Fig. 3).
Alignment of VI-IX subdomains from tyrosine kinase domain insulin receptor sequences. MvIR: Mesocestoides vogae; Emir: Echinococcus multilocularis; SmIR1 and SmIR2: Schistosoma mansoni; DAF-2: Caenorhabditis elegans; DmIR: Drosophila melanogaster; HsIR: Homo sapiens. Dark grey shaded: identical amino acid residues between all sequences; light grey shaded: identical amino acid residues between MvIR and EmIR. Asterisk: tyrosine protein kinase specific signature sequence. Bold-underlined letters: crucial residues for tyrosine kinase activity. Bold letters: putative motif from tyrosine autophosphorylation in subdomain VI. Numbers at the right and left indicate position in the entire protein sequence of the first and last residue, respectively. Top lines indicate the length and number of each subdomain.

DISCUSSION
Host-derived factors are of central importance for development of parasites (Luján et al. Reference Luján, Mowatt, Helman and Nash1994; Goto et al. Reference Goto, Gomes, Corbett, Monteiro and Gidlund1998; Gomes et al. Reference Gomes, Goto, Ribeiro Da Matta, Laurenti, Gidlund and Corbett2000; Mackintosh et al. Reference Mackintosh, Coleman and Davies2003). Receptors for several host-derived growth factors have been identified in helminth parasites suggesting that the parasites may use these molecules for their own metabolism, growth and development. Despite the conservation of insulin-like pathways in metazoans and the importance of this hormone as a growth factor, the potential role of insulin or insulin-like ligands in mammalian hosts on helminth metabolism or development has not been evaluated. In this study we analysed the ability of hrINS to promote changes in M. vogae larvae free-glucose levels, survival and asexual reproduction. The levels of free-glucose in the larvae were increased after treatment with 0·2 and 20 mU/ml hrINS. Changes in glucose levels mediated by this range in hrINS concentration were consistent with concentrations of insulin that are effective for inducing glucose uptake in mammalian cells. An inverse response was seen when Tt were treated with 0·002 mU/ml hrINS, in that Tt levels of free glucose were decreased. This observed response could be the result of a variety of factors related to parasite physiology and further investigation will be necessary to determine the nature of this response.
In addition to its role in cellular glucose metabolism, insulin also promotes cell survival and is well-established as a growth factor throughout the animal kingdom (Barbieri et al. Reference Barbieri, Bonafe, Franceschi and Paolisso2003; Nijhout, Reference Nijhout2003). Parasite survival and proliferation is an infection maintenance mechanism. M. vogae asexual reproduction occurs in the peritoneal cavity of infected mice, and host-derived growth factors, including insulin, should be available for inducing this process. Optimal maintenance and growth, including asexual reproduction, of M. vogae Tt cultured in vitro is usually achieved in modified RPMI culture medium with 10% FCS supplementation (Britos et al. Reference Britos, Dominguez, Ehrlich and Marin2000). Our results demonstrate that after 11 days of culture, 50% of the initial population of Tt was alive in the mentioned culture environment. We show that after 11 days of in vitro culture in the modified RPMI, M. vogae Tt were unable to survive and that all parasites died. However, with the addition 0·2 mU/ml hrINS to the modified RPMI, 30% of the initial population of Tt survived. The parasite also survived, but to a lesser extent, if 0·002 or 20 mU/ml hrINS had been added to the medium. Insulin was also found to be sufficient for induction of M. vogae asexual multiplication. After treatment with hrINS, fission was induced, but again to a lesser extent compared with Tt cultured with FCS. The lack of asexual reproduction in hrINS-treated cultures after day 9 indicated that other signals besides insulin were necessary to trigger binary fission. FCS is a complex mixture of nutrients and numerous biologically active macromolecules. Serum nutrients or growth factors may act independently or in concert with insulin for optimal Tt survival and asexual reproduction.
Evidence for the expression of transcripts encoding a protein having the conserved domain of a putative insulin-like receptor in M. vogae larval stage was also reported. The RT-PCR fragment isolated may represent a portion of an insulin-like receptor tyrosine kinase domain (Fernandez et al. Reference Fernandez, Tabarini, Azpiazu, Frasch and Schlessinger1995; Kimura et al. Reference Kimura, Tissembaum, Liu and Ruvkun1997; Konrad et al. Reference Konrad, Kroner, Spiliotis, Zavala-Góngora and Brehm2003; Khayath et al. Reference Khayath, Vicogne, Ahier, Benyounes, Konrad, Trolet, Viscogliosi, Brehm and Dissous2007). Sequence analysis of the cloned fragment indicated that the encoded protein differed from EmIR in only a single amino acid, and also that it contained crucial residues for enzymatic activity. In addition, no other predicted protein tyrosine kinase encoded in the E. multilocularis genome was found to have high sequence identity with that of the predicted MvIR in the database ftp://ftp.sanger.ac.uk/pub/pathogens/Echinococcus/multilocularis/genome. We are aware that IR-like molecules with very different ligand-binding domains that may have no affinity for insulin have also been described (Dissous et al. Reference Dissous, Khayath, Vicogne and Capron2006). In this regard, further characterization including complete sequence analysis of the predicted MvIR will be necessary for establishing whether our designated MvIR, represents a functional IR in M. vogae.
It is established that the intracellular action of an insulin receptor or its homologues is to trigger a cascade of protein phosphorylations. In this cascade tyrosine-phosphorylation initially occurs in the receptor β-subunit itself by an auto-phosphorylation mechanism. The activated receptor catalyses subsequent tyrosine-phosphorylation of a number of substrates, one of the most important being the Insulin Receptor Substrate (IRS) family. Both tyrosine-phosphorylation events are characteristic of early stages of insulin signal transduction cascades. The remaining phosphorylations occur on serine/threonine residues of downstream substrates (Kido et al. Reference Kido, Nakae and Accili2001). In Tt, tyrosine-phosphorylation in response to hrINS was observed, and was found to be essentially confined to a protein of 77 kDa and, as such, represents a previously unreported tyrosine kinase product in M. vogae. The prompt response resulting in phosphorylation of a 77 kDa protein was consistent with a role for this protein product in early stages of an insulin-like signalling response. The phosphorylated 77 kDa protein may be the M. vogae insulin receptor β-subunit, or it may be an endogenous substrate (IRS or other) acting as a transient intermediary element in the M. vogae insulin responsive pathway. The identification of this protein and further investigation using anti-phosphoserine and anti-phosphothreonine antibodies will contribute to the determination of the nature and complexity of the insulin response pathway in M. vogae.
In conclusion, this work demonstrates that hrINS is capable of affecting the parasite biology, modifying free-glucose content, survival, asexual reproduction and tyrosine-phosphorylation status. Although more studies are necessary to understand the effects of insulin in M. vogae larval biology, our results emphasize the striking conservation of an insulin signalling function throughout evolution.
The authors thank Dr J. Kalemkerian and Dr S. Tellechea for their assistance with the data analysis and Q. F. J. Saldaña and Q. F. L. Dominguez (Departamento de Química y Farmacia, Facultad de Química, Montevideo, Uruguay) for providing the parasites.