Introduction
Oocyte cryopreservation is a rapidly developing assisted reproductive technology thanks to its indispensable importance for fertility preservation, oocyte donation programmes, and overcoming ethical issues related to embryo cryopreservation (Rienzi et al., Reference Rienzi, Romano, Albricci, Maggiulli, Capalbo, Baroni, Colamaria, Sapienza and Ubaldi2010). In farm animals, the establishment of a cryobank of oocytes retrieved from high genetic merit animals would have practical importance for multiplication or conservation of elite genomes (Hosseini et al., Reference Hosseini, Asgari, Ostadhosseini, Hajian, Ghanaei and Nasr-Esfahani2015). The adverse effects of cryopreservation on oocyte competence, however, is still an open challenge in most mammalian species, as the live birth rate per vitrified mature oocyte is currently only 5.9% for mature (MII) human oocytes (Chamayou et al., Reference Chamayou, Bonaventura, Alecci, Tibullo, Di Raimondo, Guglielmino and Barcellona2011) and even less successful for in vitro maturation of immature oocytes (Schattman, Reference Schattman2015; Reader et al., Reference Reader, Stanton and Juengel2017). Accordingly, investigations are underway to improve the current knowledge of oocyte cryobiology (Hosseini and Nasr-Esfahani, Reference Hosseini and Nasr-Esfahani2016).
The changes induced by exposition to cryoprotectants and subphysiological temperature in several aspects of oocyte physiology including biological behaviour (e.g. survival, fertilization, and early embryonic development) and structural cellular features (e.g. meiotic spindle assembly, chromosome alignment, mitochondrial potential and ultrastructure) have been extensively studied (Di Pietro et al., Reference Di Pietro, Vento, Guglielmino, Borzì, Santonocito, Ragusa, Barbagallo, Duro, Majorana, De Palma and Garofalo2010; Hosseini and Nasr-Esfahani, Reference Hosseini and Nasr-Esfahani2016). More recent studies also investigated the effects of oocyte cryopreservation on mRNA transcripts related to cellular homeostasis including redox status, mitochondrial activity, oxidative stress, apoptosis, and cell cycle (Anchamparuthy et al., Reference Anchamparuthy, Pearson and Gwazdauskas2010; Di Pietro et al., Reference Di Pietro, Vento, Guglielmino, Borzì, Santonocito, Ragusa, Barbagallo, Duro, Majorana, De Palma and Garofalo2010; Monzo et al., Reference Monzo, Haouzi, Roman, Assou, Dechaud and Hamamah2012; Chang et al., Reference Chang, Elliott, Wright, Shapiro, Toledo and Nagy2013; de Oliveira Leme et al., Reference de Oliveira Leme, Dufort, Spricigo, Braga, Sirard, Franco and Dode2016; Hosseini and Nasr-Esfahani, Reference Hosseini and Nasr-Esfahani2016; Saadeldin et al., Reference Saadeldin, Moulavi, Swelum, Khorshid, Hamid and Hosseini2020). Importantly, by probing the transcriptome of mouse embryos developed from cryopreserved oocytes, Eroglu et al. (Reference Eroglu, Szurek, Schall, Latham and Eroglu2020) showed that oocyte cryopreservation results in lasting injuries to oocytes that affected embryonic gene expression pattern characterized by distinctly upregulated and downregulated pathways. This may explain the poor development of embryos resulting from cryopreserved oocytes in the context of effects that cryopreservation has on embryonic genome activation and subsequent modulation of gene expression thereafter (Eroglu et al., Reference Eroglu, Szurek, Schall, Latham and Eroglu2020).
Another area of concern that merits further study is the effect of cryopreservation on mRNA content of genes responsible for epigenetic reprogramming in newly developed zygotes (Shirazi et al., Reference Shirazi, Naderi, Hassanpour, Heidari, Borjian, Sarvari and Akhondi2016). Upon fertilization, the complementally parental genomes undergo significant epigenetic reprogramming changes including genomic transcription, genomic imprinting, X-chromosome inactivation, and induction of totipotency in the newly developed zygote (Hackett et al., Reference Hackett and Surani2013). These epigenetic changes are governed by a myriad of known/unknown cytoplasmic factors including mRNAs, protein and other substrates. Therefore, any changes in the epigenetic machinery of oocyte could lead to subsequent changes in developmental competence of the developing embryos. Shirazi et al. (Reference Shirazi, Naderi, Hassanpour, Heidari, Borjian, Sarvari and Akhondi2016) demonstrated changes in transcript abundances of key epigenetic genes including DNA methyltransferases 1 (DNMT1) and 3b (DNMT3B), histone deacetylase (HDAC1), histone acetyl transferase (HAT1), SMARG, and HMG3A in vitrified ovine oocytes. However, Chen et al. (Reference Chen, Zhang, Deng, Zou, Wang, Quan and Zhang2016) did not observe any marked influence of oocyte vitrification on transcript abundances of vitrified bovine oocytes. In human, vitrification of immature oocytes resulted in reduced expression of DNMT1 when assessed after in vitro maturation for 36 h (Shahedi et al., Reference Shahedi, Hosseini, Ali Khalili and Yeganeh2017). This controversy may explain species-specific susceptibilities to vitrification, and perhaps other technical and biological differences that may preclude direct extrapolation of a final conclusion in other non-tried species. Another important question is to know if changes in epigenetic reprogramming transcripts could be translated to actual changes in the epigenetic stability of the resulting embryos. The answer to this question is reflected in a few recent studies in mouse (Cheng et al., Reference Cheng, Fu, Zhang, Jia, Hou and Zhu2014; Cao et al., Reference Cao, Zhang, Xu, Chen, Tong, Zhang, Wang, Zhang, Gao, Luo and Khan2019; Fu et al., Reference Fu, Chang, Wang, Xie, Zhang and Quan2019) and bovine (Chen et al., Reference Chen, Zhang, Deng, Zou, Wang, Quan and Zhang2016). This would enable us to better discover the possible disturbing effects of oocyte vitrification on epigenetic stability of embryos during preimplantation and postimplantation development and the capacity of embryos to adjust the intimate and late effects of oocyte vitrification on epigenetics (Cheng et al., Reference Cheng, Fu, Zhang, Jia, Hou and Zhu2014).
There is a clinical demand for oocyte cryopreservation of elite dromedary camels (Camelus dromedarius) in a cryobank setting. Our recent preliminary study showed particular sensitivity of MII oocytes in this species to the vitrification procedure, possibly due to their high lipid content (Moulavi and Hosseini, Reference Moulavi and Hosseini2019). A study by Fathi et al. (Reference Fathi, Moawad and Badr2018) showed that vitrification of dromedary camel oocytes at the germinal vesicle stage using Cryotop supported superior results compared with solid surface vitrification following IVF. In a recent study, we showed that vitrification of camel MII oocytes adversely affects mitochondrial functions, although the effect was transient without compromising the developmental potential of the oocytes after parthenogenetic activation and intracytoplasmic sperm injection (ICSI) (Saadeldin et al., Reference Saadeldin, Moulavi, Swelum, Khorshid, Hamid and Hosseini2020). However, the effect of vitrification on oocyte transcripts in association with subsequent effects on epigenetic stability of the resulting embryos remain unravelled. Moreover, while ICSI is routinely used for vitrified-warmed oocytes to overcome zona hardening and to ensure a reliable and timed insemination method (O’Neill et al., Reference O’Neill, Chow, Rosenwaks and Palermo2018), the practical usage of ICSI for fertilization of vitrified oocytes has not been not investigated. Therefore, this study evaluates the effects of oocyte vitrification on maternal transcripts linked to epigenetic reprogramming and their subsequent effects on in vitro embryo development and epigenetic status of the resulting embryos during in vitro embryo development at the 2-cell and blastocyst stages.
Materials and methods
Unless specified otherwise, all chemicals and media were obtained from Sigma Chemical Co. (St. Louis, MO, USA) and Gibco (Grand Island, NY, USA), respectively.
Oocyte preparation, in vitro maturation (IVM), and vitrification
The procedure for dromedary camel oocyte IVM has been described previously (Moulavi et al., Reference Moulavi, Asadi-Moghadam, Omidi, Yarmohammadi, Ozegovic, Rastegar and Hosseini2020). In brief, cumulus–oocyte complexes (COCs) were retrieved by aspiration of superficial follicles (2–8 mm) from abattoir-derived camel ovaries cold stored for 24–48 h at 10°C and using an 18-gauge needle into HEPES-buffered tissue culture medium 199 (HTCM199) supplemented with 3 mg/ml polyvinylpyrrolidone (PVP) and 2 IU/ml heparin. COCs with evenly granulated cytoplasm and at least three layers of compacted cumulus cells were selected for culture in groups of 30–35 in 500 µl of IVM medium prepared in Nunc 4-well dishes at 38.5°C, in 6% CO2 in air and maximum humidity for 30–32 h. IVM medium was comprised of TCM199 supplemented with 10% fetal bovine serum (FBS), 2.5 mM Na-pyruvate, 50 µg/ml gentamycin, 1 mg/ml estradiol-17β, 10 µg/ml FSH, 10 µg/ml LH, 1 mM l-glutamine, 0.1 mM cysteamine, and 10 ng/ml EGF. Following IVM, cumulus cells attached to oocytes were removed by brief vortexing in 0.1% hyaluronidase in HTCM199 + 10% FBS. Only matured oocytes with the extruded/extruding first polar body were used for the experiments.
For vitrification, as described previously (Moulavi and Hosseini, Reference Moulavi and Hosseini2019), denuded oocytes in each experimental group were incubated in 100 µl phosphate-buffered saline (PBS) supplemented with 20% FBS (basic solution: BS) for 1 min. In addition, three separate droplets of 100 µl equilibration solution [ES: 7.5% ethylene glycol (EG,) and 7.5% dimethyl sulfoxide (DMSO) in BS] were placed in the vicinity of each other and BS. Under a stereomicroscope, the BS droplet containing oocytes was gently connected to its nearest ES drop, and the BS-ES drop was connected to the next ES drop. Ultimately, the BS-ES-ES drop was connected to the third ES drop (BS-ES-ES-ES). The time taken between each step was 1 min. The equilibrated oocytes were then incubated in vitrification solution (VS: 15% EG, 15% DMSO and 0.5 M sucrose in BS) for 20 to 25 s. In the next step, five oocytes with the minimum VS medium were aspirated and placed on the tip of the Cryotop (Kitazato®, Japan) and quickly plunged into liquid nitrogen in less than 20 s. All incubations were performed at room temperature (RT). For warming, Cryotops were removed from liquid nitrogen and quickly plunged in warming solution 1 (WS1: 1 M sucrose in BS at 38.5°C). After 1 min, warmed oocytes were transferred into WS2 for 3 min (0.5 M sucrose in BS at RT) and then another 3 min into WS3 (0.25 M sucrose in BS at RT). Afterwards, the oocytes were incubated in the washing solution (BS) for 5 min. Vitrified-warmed oocytes were cultured for recovery in maturation medium for 0.5 h before being used for ICSI. The oocytes with morphologic evidence of shrinkage, cytoplasmic vacuolization, or leakage in plasma membrane were recorded as degenerated oocytes.
Intracytoplasmic sperm injection and embryo development
Epididymal sperm were collected from cauda epididymis of testes derived from slaughtered mature bulls as described by Martinez-Pastor et al. (Reference Martinez-Pastor, Garcia-Macias, Alvarez, Chamorro, Herraez, de Paz and Anel2006). The prepared semen samples were washed twice by centrifugation in HEPES-buffered Tyrode’s albumin lactate pyruvate medium and the highly motile sperm was prepared by density gradient centrifugation and the prepared sperm pellet was diluted 1:10 in a Tris-based medium supplemented with 1% lecithin, 20% egg yolk, and 7% (v/v) glycerol, and then frozen and stored in liquid nitrogen until use. At 2 h before commencing ICSI, frozen semen thawed at 37°C and highly motile sperm was diluted and incubated in Tyrode’s albumin lactate pyruvate medium containing 80 mM heparin + 15 mM glutathione (GSH) for 30 min at 38.5°C and 6% CO2 in air for in vitro decondensation. Our previous study in bovine (Sekhavati et al., Reference Sekhavati, Shadanloo, Hosseini, Tahmoorespur, Nasiri, Hajian and Nasr-Esfahani2012) and our preliminary study here (data not shown) showed that sperm in vitro decondensation before ICSI using heparin–GSH substantially increased the efficiency of male pronuclear formation and diploid in vitro development of embryos. Decondensed sperm cells were used for ICSI as routinely performed, except that the decondensed sperm is immotile and the inner diameter of the microinjection needle should be larger (about 10–15 µm) compared with usual ICSI. Vitrified-warmed and control oocytes at approximately 35 h post maturation were used for ICSI. At 30 min following ICSI, oocytes were activated using 5 µM ionomycin prepared in HTCM199 for 5 min, followed by washing in HTCM199. Activated oocytes were rested for 3 h in mSOF medium before being incubated in 2 mM 6-dimethylaminopurine for 4 h. The presumptive embryos were cultured (IVC) in groups of 6–8 in 20-µl droplets of mSOF under mineral oil at 38.5ºC, 6% CO2, and 5% O2 in humidified air for 3 days before refreshing in fresh mSOF containing 10% charcoal stripped FBS for another 4 days. Cleavage was assessed on day 2 post ICSI and development of cleaved embryos to the morula, blastocyst and hatching/hatched blastocyst stages were assessed on days 4, 7, and 7–8 post ICSI, respectively (Moulavi and Hosseini, Reference Moulavi and Hosseini2019).
RNA extraction, cDNA synthesis and relative quantitative PCR (RQ-PCR)
The transcript abundances of four well known epigenetic reprogramming genes (DNA methyltransferase 1 (DNMT1), DNA methyltransferase 3B (DNMT3B), Histone Deacetylase 1 (HDAC1) and suppressor of variegation 3–9 homolog 1 (SUV39H1)) and ACTB housekeeping gene were compared between vitrified and fresh oocytes, as described previously (Saadeldin et al., Reference Saadeldin, Swelum, Elsafadi, Mahmood, Yaqoob, Alfayez and Alowaimer2019). In brief, the specific primers were designed using Primer-Blast 9 (https://www.ncbi.nlm.nih.gov/tools/primer-blast/). The expected products of primers in PCR were checked in Nucleotide-Blast 11 (https://blast.ncbi.nlm.nih.gov/Blast.cgi), which found no similarity with other dromedary camel genes. Table 1 represents the information regarding gene functions, primer sequences, annealing temperatures, and approximate product sizes of the amplified fragments of the candidate genes. The housekeeping gene GAPDH was used as the reference gene. Total RNA extraction from pooled vitrified and control oocytes was performed using the innuPREP RNA Mini Kit (Analytik Jena AG, Jena, Germany) according to the manufacturer’s instruction. Total numbers of oocytes used for Rq-PCR were 33 and 30 for vitrification and control groups, respectively, in three replicates. RNA quantity and quality was checked using a NanoDrop™ spectrophotometer (Thermo Fisher, Waltham, MA, USA). Pulsed reverse transcription was conducted to generate complementary DNA (cDNA). Next, 20 ng RNA in a 20-µl reaction volume was used as the template for cDNA synthesis using a High Capacity cDNA reverse transcription kit (Applied Biosystems, Foster City, CA, USA). Reactions were subjected to 80 cycles of 2 min at 16°C, 1 min at 37°C, 0.1 s at 50°C, followed by final inactivation at 85°C for 5 min. The RT-qPCR was performed using a ViiA 7 thermal cycler (Applied Biosystems). The reactions comprised 100 ng cDNA, 1 µM forward primer, 1 µM reverse primer, and 1× Fast SYBRTM Green Master Mix (Applied Biosystems). The fold change and relative quantities of the target genes were calculated according to the 2−ΔΔCt method. Reactions without reverse transcriptase or cDNA template resulted in no amplification. The thermal cycler was adjusted to 95°C for 10 min, followed by 40 cycles of 95°C for 10 s, 60°C for 30 s, and 72°C for 30 s.
Primers used for relative quantitative PCR

* The melting curve for each primer was evaluated by ViiATM7 apparatus-associated software and the product size was confirmed by gel electrophoresis of PCR products on 1.5% agarose referring to a 1 kb DNA ladder (Invitrogen, Carlsbad, USA).
DNA methylation and H3K9 acetylation
As described previously (Hosseini et al., Reference Hosseini, Dufor, Niemine, Moulav, Ghanae, Hajia, Jafarpou, Forouzanfa, Gourba, Shahverd and Nasr-Esfahani2016), embryos at the 2-cell and blastocyst stages were pooled for immunostaining. Pooled embryos in each stage were washed in PBS containing 1 mg/ml PVA (PBS/PVA) and then fixed in 4% paraformaldehyde in PBS for 30 min, permeabilized by 0.1% Triton X-100 in PBS/PVA for 15 min and blocked with 1% BSA for 1 h. For DNA methylation, embryos were first pre-treated with 4 N HCl for 60 min at RT, and then washed with PBS/PVA. Embryos were then incubated with the primary antibody: either mouse anti-5-methylcytosine (5-mC) antibody [5MC-CD] (ab73938, 1/100 dilution) (for DNA methylation) or mouse monoclonal anti-H3K9 (Invitrogen MA 523517, 1/500 dilution) (for H3K9 acetylation: H3K9ac), for 1 h at RT, followed by three washes in PBS/PVA. Embryos were then incubated with the secondary antibody goat anti-mouse IgG-TRITC (ab6786, Ex: 547 nm, Em: 572 nm, 1/2000 dilution in PBS containing 0.2% BSA) for 45 min at RT. DNA was counterstained with 1 µg/ml Hoechst 33342 stain. Preparations were washed in PBS before mounting and imaging. Negative controls were processed the same way with the exception that the primary antibodies were replaced with blocking buffer. Pixel intensity of randomly selected nuclei was quantified (ImageJ software; National Institute of Mental Health, Bethesda, MD, USA) and normalized to the background. The median pixel intensity of both nuclei in 2-cell stage embryos and 10–15 nuclei in each blastocyst and the average pixel intensity of fluorescence emission was detected.
Statistical analysis
All experimental groups were repeated at least three times. The data were analyzed by one-way analysis of variance methodology using the general linear models procedure from the SAS statistical package (SAS, 2003). Some dependents variables were subjected to logarithm transformation prior analysis. Ryan–Einot–Gabriel–Welsch–Quiot (REGWQ) test was used for comparisons of means, and significance was declared at P ≤ 0.05.
Results
Effect of oocyte vitrification on oocyte survival and in vitro embryo development
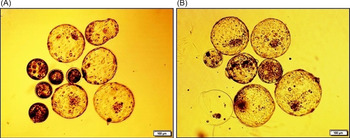
In this study, the average rate of in vitro oocyte maturation was 83.6% (Table 2). The rate of oocytes that survived the vitrification-warming procedure was 91.8 ± 2.9%. No significant difference was found between the survival rates of oocytes following ICSI procedure (93.6 ± 2.1 and 95.8 ± 2.8%, for vitrified and control oocytes, respectively). Following ICSI, the cleavage rates of vitrified and control oocytes showed a significant difference in favour of vitrified oocytes (98.2 ± 2 vs. 72.7 ± 4.1%, respectively). The rates of cleaved embryos that further developed to the morula stage were not significantly different between the two groups (80.1 ± 8.5 vs. 72.9 ± 7.6%, for vitrified and control oocytes, respectively). However, vitrification significantly reduced the rate of resulting embryos that could develop to the blastocyst stage compared with that of the control (7.7 ± 1.1 vs. 28.1 ± 2.6%, respectively). Moreover, the hatching rate of blastocysts derived from vitrified-warmed oocytes was significantly lower compared with that of control oocytes (11.1 ± 11.1 vs. 52.4 ± 9.9%). Morphological quality of developed blastocysts showed no apparent difference between the two experimental groups (Fig. 1 A, B).
The effect of vitrification-warming procedure on oocytes and subsequent embryonic development

* : Values are means ± standard error of the mean (SEM).
Means in a row without a common superscript letter differ (P < 0.05) as analyzed by one-way analysis of variance (ANOVA) and the Tukey test.
In vitro development of vitrified oocytes following ICSI in dromedary camel. Representative images of blastocysts developed in the vitrification (A) and control (B) groups. Scale bar: 100 µm.

Effect of oocyte vitrification on maternal transcripts of epigenetic reprogramming genes
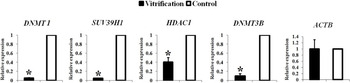
The relative abundances of four genes involved in epigenetic reprogramming were compared between control and vitrified-warmed oocytes. The genes include DNA methyltransferase 1 (DNMT1), DNA methyltransferase 3 beta (DNMT3B), histone deacetylase 1 (HDAC1), suppressor of variegation 3–9 homolog 1 (SUV39H1). The epigenetic roles of the selected genes are described in Table 1. The housekeeping genes ACTB were also included in the comparison to verify the normalization. As shown in Fig. 2, the oocyte vitrification-warming procedure resulted in significant reductions in the relative transcript abundances of all four epigenetic reprogramming genes (P < 0.05), but it did not affect the expression of the housekeeping gene ACTB.
Effect of oocyte vitrification on transcript abundances of key epigenetic reprogramming genes in dromedary camel oocytes. Quantification of mRNA transcripts (DNMT1, DNMT3B, HDAC1, SUV39H1 and ACTB) using RT-qPCR. Expression of mRNA in vitrified-warmed oocytes was normalized to that of fresh control oocytes. The primers used for amplification of these transcripts are listed in Table 1. Asterisk (*) indicates the significant difference between groups (P < 0.05, t-test). All experiments were independently repeated three times. Data were normalized against endogenous housekeeping gene GAPDH. For each replicate, 10–11 oocytes were pooled together. Total numbers of oocytes used for RT-qPCR were 33 and 30 for vitrification and control groups, respectively.

Effect of oocyte vitrification on epigenetic status of 2-cell stage embryos
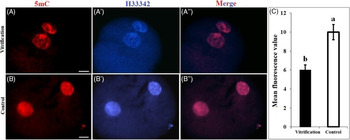
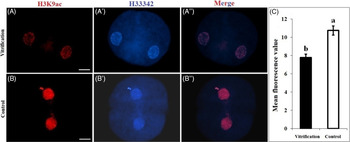
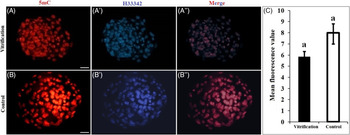
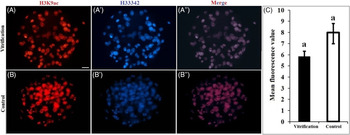
The effect of oocyte vitrification on global DNA methylation (Fig. 3 A–C) and H3K9 acetylation (Fig. 4 A–C) of the resulting ICSI embryos at the 2-cell stage was investigated. Accordingly, measurement of the 5mC fluorescence intensity showed that 2-cell embryos derived from vitrified oocytes were significantly hypomethylated compared with the control (relative intensity means: 6.1 ± 0.3 vs. 9.9 ± 0.5, respectively, P < 0.05) (Fig. 3 C). Measurement of the H3K9ac fluorescence intensity showed a significant effect of oocyte vitrification on reduced histone acetylation level of the resulting embryos compared with that of the control (relative intensity means: 7.8 ± 0.2 vs. 10.7 ± 0.3, respectively, P < 0.05) (Fig. 4 C).
Effect of oocyte vitrification on global DNA methylation of the resulting 2-cell embryos in dromedary camel. In vitro-matured oocytes in the vitrification-warming and control groups used for ICSI, and the resulting 2-cell embryos were used for quantification of 5mC fluorescence intensity. (A–B′′) Representative images of 2-cell embryos immunostained for 5mC (red in A and B) followed by counterstaining with H33342 to visualize DNA (blue in A′ and B′) and their merged views (A′′, B′′) in vitrification and control groups, respectively. (C) Quantification of 5mC signal intensities in 2-cell embryos derived from vitrified oocytes relative to that of the control oocytes. In each group, 11 embryos were used. Data are shown as mean ± SEM and different letters on the bars indicate a statistically significant difference between the two groups (P < 0.05). Scale bars: 25 µm.

Effect of oocyte vitrification on histone acetylation of the resulting 2-cell embryos in dromedary camel. In vitro-matured oocytes in the vitrification-warming and control groups used for ICSI, and the resulting 2-cell embryos were used for quantification of H3K9 fluorescence intensity. A–B′′) Representative images of 2-cell embryos immunostained for H3K9 (red in A and B) followed by counterstaining with H33342 to visualize DNA (blue in A′ and B′) and their merged views (A′′, B′′) in vitrification and control groups, respectively. (C) Quantification of H3K9 signal intensities in 2-cell embryos derived from vitrified oocytes relative to that of the control oocytes. In each group, 11 embryos were used. Data are shown as mean ± SEM and different letters on the bars indicate a statistically significant difference between two groups (P < 0.05). Scale bars: 25 µm.

Effect of oocyte vitrification on epigenetic status of the resulting embryos at the blastocyst stage
To understand if altered epigenetic status of early embryos derived from vitrified oocyte could persist at later stages of embryo development, blastocysts derived from vitrified-warmed and control oocytes were used to measure DNA methylation (Fig. 5 A–C) and H3K9 acetylation (Fig. 6 A–C). The global DNA methylation of blastocysts derived from vitrified oocytes showed a reduction compared with that in the control blastocyst, although this reduction was not statistically significant (relative intensity means: 4.9 ± 0.4 vs. 6.2 ± 0.6, respectively, P > 0.05) (Fig. 5 C). Similarly, the H3K9 acetylation fluorescence intensity of blastocysts in the vitrification group showed a statistically non-significant reduction compared with the control blastocysts (relative intensity means: 5.8 ± 0.3 vs. 8 ± 0.9, respectively, P > 0.05) (Fig. 6 C).
Effect of oocyte vitrification on global DNA methylation of the resulting blastocysts in dromedary camel. In vitro-matured oocytes in the vitrification-warming and control groups used for ICSI, and the resulting embryos were cultured up to the blastocyst stage to be used for quantification of 5mC fluorescence intensity. (A–B′′) Representative images of blastocysts immunostained for 5mC (red in A and B) followed by counterstaining with H33342 to visualize DNA (blue in A′ and B′) and their merged views (A′′, B′′) in vitrification and control groups, respectively. (C) Quantification of 5mC signal intensities in blastocysts derived from vitrified oocytes relative to that of the control oocytes. In each group, 7 blastocysts were used and in each blastocysts, 10–15 nuclei were analyzed. Data are shown as mean ± SEM and common letters on the bars indicate the lack of a statistically significant difference between two groups (P < 0.05). Scale bars: 25 µm.

Effect of oocyte vitrification on histone acetylation of the resulting blastocysts in dromedary camel. In vitro-matured oocytes in the vitrification-warming and control groups used for ICSI, and the resulting embryos were cultured up to the blastocyst stage to be used for quantification of H3K9 fluorescence intensity. (A–B′′) Representative images of blastocysts immunostained for 5mC (red in A and B) followed by counterstaining with H33342 to visualize DNA (blue in A′ and B′) and their merged views (A′′, B′′) in vitrification and control groups, respectively. (C) Quantification of H3K9 signal intensities in blastocysts derived from vitrified oocytes relative to that of the control oocytes. In each group, 7 blastocysts were used and in each blastocysts, 10–15 nuclei were analyzed. Data are shown as mean ± SEM and common letters on the bars indicate the lack of a statistically significant difference between two groups (P < 0.05). Scale bar: 25 µm.

Discussion
Cryopreservation of oocytes retrieved from genetically superior animals has important practical importance for preserving of fertility in women and for multiplication and conservation of elite genomes in animals. Successful cryobanking of oocytes would also ensure a steady supply of oocytes for somatic cell nuclear transfer, stem cell production, and genetic engineering programmes (Hosseini et al., Reference Hosseini, Asgari, Ostadhosseini, Hajian, Ghanaei and Nasr-Esfahani2015). While significant progress has been achieved in cryopreservation of farm animal oocytes with offspring born from frozen oocytes in cattle (Otoi et al., Reference Otoi, Yamamoto, Koyama, Tachikawa and Suzuki1996), horses (Maclellan et al., Reference Maclellan, Carnevale, Da Silva and Scoggin2002), and pig (Somfai et al., Reference Somfai, Yoshioka, Tanihara, Kaneko, Noguchi, Kashiwazaki, Nagai and Kikuchi2014), this goal still remains in camels. In continuation with our previous study on vitrification and parthenogenetic activation of dromedary camel oocytes (Moulavi and Hosseini, Reference Moulavi and Hosseini2019), this study investigated how oocyte vitrification may affect developmental competence and epigenetic status of the resulting ICSI embryos in this species. Obtained results indicate that in vitro-matured vitrified-warmed oocytes support cleavage and in vitro embryo development following ICSI. Although the cleavage rate was unexpectedly increased following vitrification warming, the decreased blastocyst rate indicated the impaired developmental potential of vitrified oocytes, a finding that is in agreement with our previous study in this species (Moulavi and Hosseini, Reference Moulavi and Hosseini2019) and studies in other species [human (Rienzi et al., Reference Rienzi, Romano, Albricci, Maggiulli, Capalbo, Baroni, Colamaria, Sapienza and Ubaldi2010), bovine (Spricigo et al., Reference Spricigo, Diogenes, Leme, Guimaraes, Muterlle, Silva, Solà-Oriol, Pivato, Silva and Dode2015), mouse (Cao et al., Reference Cao, Zhang, Xu, Chen, Tong, Zhang, Wang, Zhang, Gao, Luo and Khan2019), goat (Srirattana et al., Reference Srirattana, Sripunya, Sangmalee, Imsoonthornruksa, Liang, Ketudat-Cairns and Parnpai2013), and ovine (Hosseini and Nasr-Esfahani, Reference Hosseini and Nasr-Esfahani2016)]. Therefore, the observation of higher cleavage rate despite the subsequent lower blastocyst rate may explain an indirect effect of oocyte vitrification on the incidence of spontaneous activation, which results in the progression of oocyte meiosis and embryo mitosis in the absence of participation of the male genome. Spontaneous activation of vitrified oocytes has been demonstrated previously (Gardner et al., Reference Gardner, Sheehan, Rienzi, Katz-Jaffe and Larman2007), and studies showed that vitrification of MII oocytes caused a decrease in MPF level due to the reduction in CYCLIN-B mRNA, which makes oocytes prone to spontaneous activation (Asgari et al., Reference Asgari, Hosseini, Ostadhosseini, Hajian, Azhdari, Mosaie and Nasr-Esfahani2012). Moreover, the blastocyst rate of vitrified oocytes that underwent ICSI in this study (7.7%) was lower, not only compared with fresh oocytes in the same study (28.1%), but also compared with the 22.9% blastocyst rate that was obtained in our previous study after parthenogenetic activation of vitrified-warmed oocytes in dromedary camel (Moulavi and Hosseini, Reference Moulavi and Hosseini2019). The first part of the results in this study, therefore, indicated that in dromedary camels, as in other farm animal species, cryopreservation of MII oocytes is still not optimized and vitrification significantly reduces oocyte developmental competence. The development of an optimized oocyte vitrification protocol needs further studies focusing on the cryobiology of camel oocytes at cellular and molecular levels.
The newly developed embryos of mammals inherit a huge stockpile of maternal mRNAs, which are crucially important during early zygotic mitotic divisions until the activation of major portions of the embryonic genome occurs at a species-specific stage of development, i.e. the 8–16-cell stage in cow (Sirard, Reference Sirard2012). Available data on molecular profiling of vitrified oocytes and ovarian tissues are somewhat contradictory, from no or weak to significant effects of cryopreservation compared with their control counterparts (for review see Monzo et al., Reference Monzo, Haouzi, Roman, Assou, Dechaud and Hamamah2012). The effects of vitrification on genes linked to epigenetic reprogramming have received less attention despite the large influence they have on cell specification and transcriptional regulation during embryo development (Shirazi et al., Reference Shirazi, Naderi, Hassanpour, Heidari, Borjian, Sarvari and Akhondi2016). Focusing on epigenetic-related genes, we observed that vitrification resulted in a significant reduction in the transcript abundances of all four genes assessed, DNMT1, DNMT3B, HDAC1, and SUV39H1. In ovine, Shirazi et al. (Reference Shirazi, Naderi, Hassanpour, Heidari, Borjian, Sarvari and Akhondi2016) observed a significant reduction in the expression profile of DNMT1, DNMT3B, HDAC1, and two other epigenetic genes (SMARCAL1 and HMGN3a), while the relative abundance of SUV39H1 remained unchanged between vitrified and fresh oocytes in their study. In mouse, the increased expression levels of all four types of DNMTs (DNMT1, DNMT3A, DNMT3B, and DNMT3I) were significantly reduced in vitrified oocytes (Cheng et al., Reference Cheng, Fu, Zhang, Jia, Hou and Zhu2014). Assessment of the relative gene expression of the ten-eleven-translocation (TET) family of dioxygenases that oxidize 5mC to 5-hydroxymethylcytosine (5hmC), 5-formylcytosine (5fC), and 5-carboxylcytosine (5caC) in DNA showed that TET2/3 did not change in the first 2 h of vitrification warming in mice, but increased significantly after 2 h in mouse (Hajj and Haaf, Reference El and Haaf2013). Although our observation was in line with the aforementioned reports confirmed an adverse effect of vitrification on transcript abundances of epigenetic-related genes, it was still unclear if these changes in the transcript levels could lead to epigenetic instability of the resultant embryos. Based on the epigenetic roles played by the four genes that were assessed in this study (Table 1), and if the changes in transcripts could lead to parallel changes in abundances of the associated enzymes, one may argue that embryos derived from vitrified oocytes should be globally hypomethylated and hypoacetylated compared with the embryos derived from fresh oocytes. This hypothesis was the main question of the third experiment in this study.
Evaluation of the epigenetic marks in this study showed that oocyte vitrification could lead to the loss of DNA methylation and histone acetylation of the resulting embryos at the 2-cell stage. These epigenetic changes in 2-cell embryos could be considered relevant to the reductions observed in the transcripts of DNMT1, DNMT3B, HDAC1, and SUV39H1 in vitrified oocytes, provided that the roles played by these genes were in epigenetic modification of DNA (Table 1). In agreement, Chen et al. (Reference Chen, Zhang, Deng, Zou, Wang, Quan and Zhang2016) detected reduced levels of DNA methylation and H3K9me3 in oocytes and early ICSI embryos derived from vitrified bovine oocytes. Suo et al. (Reference Suo, Meng, Pei, Fu, Wang, Bunch and Zhu2010) demonstrated a significant increase in AcH4K12 levels in vitrified oocytes and abnormal chromatin distribution or acH4K12 patterns in respective zygotes before and after pronuclear formation in mice. A reduction in global genomic methylation of vitrified mouse MII oocytes and the resulting 2-cell to 8-cell stages embryos was reported by Liang et al. (Reference Liang, Fu, Li, Yuan and Zhu2014). Moreover, Fu et al. (Reference Fu, Chang, Wang, Xie, Zhang and Quan2019) showed that, in mice, the levels of 5mC and 5hmC were significantly decreased 2 h after vitrification. Mechanistically, these epigenetic changes may be caused by either an indirect effect of vitrification on transcripts of genes linked to epigenetic reprogramming, as supposed in this study, or to direct effects of vitrification on reduction of DNA methyltransferases or excessive relaxation of chromosomes in vitrified-warmed oocytes (Cheng et al., Reference Cheng, Fu, Zhang, Jia, Hou and Zhu2014; Chen et al., Reference Chen, Zhang, Deng, Zou, Wang, Quan and Zhang2016). As the maternal genome undergoes a gradual pattern of DNA demethylation followed by de novo DNA methylation during the normal course of early embryo development in mammals (Suo et al., Reference Suo, Meng, Pei, Fu, Wang, Bunch and Zhu2010; Cheng et al., Reference Cheng, Fu, Zhang, Jia, Hou and Zhu2014; Hosseini et al., Reference Hosseini, Asgari, Ostadhosseini, Hajian, Ghanaei and Nasr-Esfahani2015; Chen et al., Reference Chen, Zhang, Deng, Zou, Wang, Quan and Zhang2016), an immediate question was whether initial epigenetic changes of maternal genome induced by vitrification can lead to subsequent changes in the resulting embryos. Therefore, the last part of this study was to understand whether epigenetic changes that were detected following oocyte vitrification in the resulting 2-cell embryos persisted during later stages of in vitro embryo development.
In this study, blastocysts derived from vitrified oocytes had reduced levels of DNA methylation and H3K9 acetylation. Although this may indicate a possible risk for long-term inheritance of epigenetic instabilities caused by oocyte vitrification, the levels of epigenetic differences between vitrified and fresh blastocysts seem to be diluted during mitotic divisions. Available data in mouse indicate that epigenetic changes occur following oocyte vitrification may be partially adjusted by the blastocyst stage, whereas the others could persist and lead to loss of DNA methylation of H19, PEG3, and SNRPN imprinted genes (Cheng et al., Reference Cheng, Fu, Zhang, Jia, Hou and Zhu2014). In bovine, oocyte vitrification reduced DNA methylation and H3K9me3, but increased H3K9 acetylation in early cleavage embryos. When developed to the blastocyst, inner cell mass showed no difference in DNA methylation, H3K9me3, and acH3K9 in the inner cell mass, whereas decreased levels of DNA methylation and acH3K9 observed in trophectoderm cells (Chen et al., Reference Chen, Zhang, Deng, Zou, Wang, Quan and Zhang2016). By tracing the reprogramming of 5mC and its derivatives in resulting mouse embryos, Cao et al. (Reference Cao, Zhang, Xu, Chen, Tong, Zhang, Wang, Zhang, Gao, Luo and Khan2019) observed that oocyte vitrification did not alter the dynamic changes of 5mC, 5hmC and 5fC before the 4-cell stage, whereas the levels of 5hmC and 5fC significantly reduced from the 8-cell stage onwards. Although these results suggest that oocyte vitrification could interfere with critical stages of epigenetic reprogramming during preimplantation embryo development, when the epigenome appears to be most plastic, the epigenetic plasticity steadily decreases during later stages of development (Hajj and Haaf, Reference El and Haaf2013). In the extent of present knowledge, the phenotypic consequences originating from epigenetic changes caused by oocyte vitrification remain largely unknown. Moreover, differential contributions of chemical, thermal and osmotic shocks of oocyte vitrification procedure to the gene expression profile and epigenetic status of the resulting embryos are not well understood. Specifically, some cryoprotectants (CPAs) used during cryopreservation due to their special chemical formula have affinity for the reaction with the epigenetic composition of cells (Hu et al., Reference Hu, Marchesi, Qiao and Feng2012). For example, Hu et al. (Reference Hu, Marchesi, Qiao and Feng2012) showed that dimethyl sulfoxide (DMSO), a commonly used CPA, significantly reduced DNA methylation of oocytes, whereas in contrast, propylene glycol, another commonly used CPA, significantly increased DNA methylation in cryopreserved oocytes. In this regard, novel approaches of oocyte cryopreservation for intra-oocyte injection of safer and natural CPAs, such as trehalose, may subvert any detrimental effects of CPAs on epigenetic stability of the oocyte epigenome (Eroglu et al., Reference Eroglu, Bailey, Toner and Toth2009). Changes observed in the epigenetic status of vitrified oocytes, corrected using current chemical epigenetic modifiers, remain to be understood, because during any intervention to reverse these epigenetic changes, the effects on the oocytes and the resulting embryos will be applied to the level of all genes.
In conclusion, the results of this study indicated that in vitro-matured vitrified-warmed oocytes support cleavage and in vitro embryo development following ICSI in dromedary camels. Vitrification significantly reduced the transcript abundances of four key genes involved in epigenetic modification and led to corresponding changes in epigenetic stability of the resulting embryos. In contrast, hypoacetylation of H3K9 may render the chromatin of the embryos closed, thereby less transcriptionally active. Although differences in global DNA methylation and histone acetylation did not reach a statistically significant level for the number of the analyzed blastocysts, this does not exclude the possibility that the epigenetic status of different genes might have been altered significantly as a result of vitrification (Saenz-de-Juano et al., Reference Saenz-de-Juano, Marco-Jiménez, Schmaltz-Panneau, Jimenez-Trigos, Viudes-de-Castro, Peñaranda, Jouneau, Lecardonnel, Lavara, Naturil-Alfonso and Duranthon2014; Li et al., Reference Li, Chen, Tang, Xiao, Huang, Jiang, Huang, Sun and Wang2016). The long-lasting effects that assisted reproductive technologies may have on the integrity of developing embryos have received much attention recently. Although human studies are fewer compared with animal model studies due to legal issues, growing numbers of studies have shown evidence of transcriptional, proteomics, metabolic and even phenotypic changes in neonates born following assisted reproductive technologies, including oocyte/embryo cryopreservation (Dupont and Sifer, Reference Dupont and Sifer2012; Saenz-de-Juano et al., Reference Saenz-de-Juano, Marco-Jiménez, Schmaltz-Panneau, Jimenez-Trigos, Viudes-de-Castro, Peñaranda, Jouneau, Lecardonnel, Lavara, Naturil-Alfonso and Duranthon2014; Li et al., Reference Li, Chen, Tang, Xiao, Huang, Jiang, Huang, Sun and Wang2016; Wu et al., Reference Wu, Li, Zhu, Zou, Wu, Wang, Wu, Yin, Shi, Lin, Jiang, Xu, Su, Zhang, Sheng, Fraser, Liu and Huang2018; Garcia-Dominguez et al., Reference Garcia-Dominguez, Marco-Jiménez, Peñaranda, Diretto, García-Carpintero, Cañizares and Vicente2020). To best of our knowledge, this is the first study on the effect of MII-oocyte vitrification on in vitro development of ICSI embryos in dromedary camels.
Acknowledgements
The authors are highly thankful to Hamad Buti Mohammed, The General Director of CARTC, for moral and unconditional support. Authors thank the Embryology laboratory staff, for assistance in this study and the administrative office for arrangements.
Authors’ contributions
Conceived and designed the experiments: Moulavi F; Hosseini SM; Saadeldin IM. Performed the experiments: Moulavi F, Saadeldin IM, Tasdighi F, Swelum A, Hosseini SM, Swelum AA, Hosseini-Fahraji H. Drafting the manuscript: Moulavi F, Saadeldin IM, Hosseini SM. Final edition: Moulavi F, Saadeldin IM, Hosseini SM.
Financial support
This study was sponsored by the Zaabeel Office for H.H. Sheikh Mohammed Bin Rashid Al Maktoum, Vice-President and Prime Minister of the UAE and Ruler of Dubai. Part of this study was funded by the Deanship of Scientific Research at King Saud University through research group RG-1438-018.
Conflicting interests
Authors declare that there is no competing interest in this study.
Ethical standards
None. The authors of this study did not work with any living animals in the context of this study.