Introduction
Consortium to Establish a Registry for Alzheimer's Disease (CERAD) is a neuropsychological battery developed for screening of Alzheimer's disease (Morris et al., Reference Morris1989). The battery has been validated in Colombia (Aguirre-Acevedo et al., Reference Aguirre-Acevedo2007) and in other countries (Unverzagt et al., Reference Unverzagt1999; Lee et al., Reference Lee2002; Fillenbaum et al., Reference Fillenbaum2008). It is extensively used to diagnose and follow patients with dementia, particularly those with Alzheimer's disease (AD) and Mild Cognitive Impairment (MCI) (Barth et al., Reference Barth, Schönknecht, Pantel and Schröder2005; Sotaniemi et al., Reference Sotaniemi2012). It comprises the following eight sub-tests: Mini-Mental State Examination (MMSE/30), Verbal Fluency (VF/24), Modified Boston Naming Test (BNT/15), Word List Learning (WLL/30), Word List Recall (WLR/10), Word Recognition Discriminability (WLRD/10), Constructional Praxis Copy (CP/11), and Constructional Praxis Recall (PR/11).
Each CERAD sub-test provides a score that measures individual cognitive domain, although Chandler et al. (Reference Chandler2005) suggested using the total CERAD score (CERADTS) as a useful measurement of dementia and MCI diagnosis. The Chandler method comprises a score calculated by the sum of sub-test, excluding the MMSE and the Constructional PR/11 on a scale ranging from 0 to 100 points. The CERADTS has been validated with normative samples (Han et al., Reference Han2014), has a high sensitivity and specificity for dementia and MCI diagnosis (Chandler et al., Reference Chandler2005; Seo et al., Reference Seo2010), and has shown usefulness in the follow up of the natural course of AD (Rossetti et al., Reference Rossetti, Munro-Cullum, Hynan and Lacritz2010; Hallikainen et al., Reference Hallikainen2013; Wolfsgruber et al., Reference Wolfsgruber2014).
Using composite scores provides advantages over the use of specific tests (Morris et al., Reference Morris, Evans, Hebert and Bienias1999). First, “floor” and “ceiling” effects – which are expressed by extreme low and high individual score values, respectively, during the natural course of the disease – are reduced. Second, they have symmetric distribution with better adjustment to normal distribution, whereas skewness is more marked on specific tests. Third, the learning effect on patients is reduced. Fourth, they provide statistical advantages regarding compliance with analytical model assumptions and for estimating power and sample size.
The world's largest population (Larner and Doran, Reference Larner and Doran2006) with early-onset familial AD (FAD) carrying the E280A (Glu280Ala) mutation on presenilin-1 gene (PSEN1) exists in Antioquia (Colombia) (Cornejo et al., Reference Cornejo, Lopera, Uribe and Salinas1987; Lemere et al., Reference Lemere1996; Lopera et al., Reference Lopera1997; Pastor et al., Reference Pastor2003). These families include more than 800 carriers and 2,300 non-carriers among children and adults, and the median onset age of MCI and dementia is 44 (43 to 45) and 49 (49 to 50) years, respectively (Acosta-Baena et al., Reference Acosta-Baena2011).
Although the CERAD battery has been a clinical assessment tool used routinely in the E280A cohort (Ardila et al., Reference Ardila2000), the usefulness of CERADTS as a tool of diagnosis for MCI and genetic AD has not been determined. In fact, studies of this type on any FAD population in the world do not exist.
The goal of this study was to determine the accuracy of CERADTS diagnosis in assessing MCI and dementia in a cohort with E280A mutation on PSEN1.
Methods
A cross-sectional study was performed using the first neuropsychological assessment of the cohort of E280A PSEN1 carriers and non-carriers. The members of this cohort came from the cities of north of Antioquia, Colombia and the capital city of Medellin-Antioquia, Colombia, South America.
Participants
The participants were chosen from the cohort assessed from January 1995 to February 2013. The inclusion criteria were as follows: Having PSEN1 E280A genotyping; aged 18 years or older, and having completed the neuropsychological assessment (first assessment) of CERAD tests, MMSE, and the Clinical Dementia Rating (CDR) (Morris, Reference Morris1993). Based on self-reported clinical assessment, we excluded participants with psychiatric disorder, alcoholism, drug addiction, mental retardation, learning disabilities, illiteracy, cerebrovascular disease, cranioencephalic trauma, other dementias (Lewy bodies, mixed or late-onset sporadic AD-type dementia), and incomplete or impossible mental status assessment due to advanced stage of dementia. This study was approved by the medical ethics board of School of Medicine at the University of Antioquia.
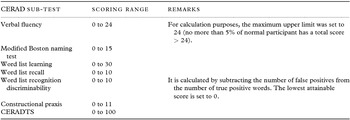
We used the Spanish–Colombian version of the CERAD-COL battery (Aguirre-Acevedo et al., Reference Aguirre-Acevedo2007). Then CERADTS was calculated using the Chandler method (Chandler et al., Reference Chandler2005), with the sum of the following six sub-tests: VF/24, BNT/15, WLL/30, WLR/10, WLRD/10, and CP/11. This score ranges from 0 to 100 points (Table 1). Patients were also assessed using the CDR, which has 5-point scale: 0 = asymptomatic, 0.5 = questionable, 1 = mild, 2 = moderate, and 3 = severe (Morris, Reference Morris1993). The neuropsychological assessment was performed by neuropsychologists with extensive clinical experience in FAD assessment and were blinded to the participant's genetic status.
The Chandler method to calculate CERADTS

Gold standard
Criteria from the National Institute of Neurological and Communication Disorders and Stroke–Alzheimer's Disease and Related Disorders Association (NINCDS-ADRDA; McKhann et al., Reference Mckhann, Drachman, Folstein, Katzman, Price and Stadlan1984) and Diagnostic and Statistical Manual of Mental Disorders, Fourth Edition (DSM-IV; American Psychiatric Association, 2000) were used to diagnose dementia. The Petersen criteria (Petersen et al., Reference Petersen2001) were used for MCI diagnosis. All asymptomatic participants had a CDR = 0, and the MCI group had a CDR = 0.5. Our cohort predominantly comprised amnestic MCI (Ardila et al., Reference Ardila2000; Acosta-Baena et al., Reference Acosta-Baena2011). Neurologists and neuropsychologist were blinded to genetic status to avoid bias in clinical assessments.
Statistical analysis
Descriptive statistics for CERADTS and sub-tests are presented for asymptomatic, MCI, and dementia groups with observed ranges (minimum and maximum), mean values and standard deviation (SD), floor effect (% of the sample placed at the minimal value of the test), ceiling effect (% of the sample placed at the maximum value of the test), standardized skewness, and Kurtosis coefficient. To estimate the CERADTS cut-off points to discriminate among asymptomatic participants (carriers and non-carriers) versus MCI and dementia, an analysis using Receiver Operating Characteristic (ROC) curves was used. The sensitivity and specificity values and likelihood ratios (LR) were calculated based on the cut-off points. We determined the optimal cut-off point for the value in which the minimum level of sensitivity or specificity was 90% for dementia, or a minimum level of sensitivity or specificity was 90% for MCI. We did a secondary analysis to compare the discriminant capacity of CERADTS and sub-tests for MCI and dementia.
Exploratory analysis
Effect of education on cut-off
Carriers and non-carriers overall had low education with a median of eight years of education. Two groups were analyzed using the median of education to explore effect on the performance assessment of test: Group 1 – low education level (eight years or less), and Group 2 – high education level (over eight years). The estimated data are presented with the corresponding 95% confidence intervals (CI).
Sensitivity analysis
We considered another analysis to control some bias related to the overestimation of the discriminant capacity of CERADTS. First, we performed a sensitivity analysis in which we excluded participants with a CDR score of 2 or 3 from the analysis. Then we conducted a sensitivity analysis using a linear method to adjust ROC curves for age and education (Janes et al., 2009). The method uses bootstrapping by default for inference with 1,000 replications. We compared the area under curve (AUC)–ROC curves of dementia and MCI with and without adjusting for covariates.
Results
Demographic and clinical characteristics
Between 1995 and 2013, 1,698 of the 2,013 assessed participants were included in the analysis (Figure 1). Of these, 535 (31.5%) were mutation carriers, and 1,163 (68.5%) were non-carriers. A total of 76 individuals had dementia (all were carriers), 46 had MCI (37 carriers and 9 non-carriers), and 1,576 (1,154 non-carriers and 422 carriers) were asymptomatic according to the first neuropsychological assessment.
Flowchart of a cohort of PSEN1 E280A carriers and non-carriers.

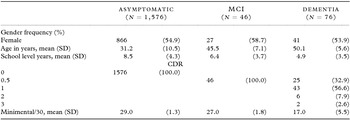
Table 2 shows the demographic and clinical characteristics of the participants included in the study. More than half were females. The average age was 31.2 years (SD = 10.5) in the asymptomatic, 45.5 years (SD = 7.1) in the MCI, and 50.1 years (SD = 5.6) in the dementia group. Education level was 8.5 years (SD = 4.3) in the asymptomatic, 6.4 years (SD = 3.7) in the MCI, and 4.9 years (SD = 3.5) in the dementia group. The average MMSE score was 29.0 (SD = 1.3) in the asymptomatic, 27.0 (SD = 1.8) in the MCI, and 17.0 (SD = 5.5) in the dementia group.
Demographic and clinical characteristic of asymptomatic MCI and dementia individuals in the cohort with PSEN1 E280A mutations

Note: CDR: clinical dementia rating; MCI: mild cognitive impairment; SD: standard deviation.
Descriptive characteristics of CERADTS
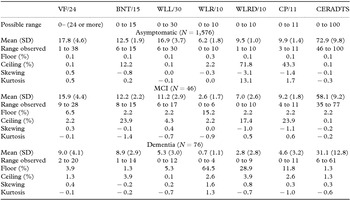
The median CERADTS was 70.6 (SD = 13.3) with values between 6 and 100 points, which indicates 94% of the possible range. Table 3 shows the descriptive statistics of test and sub-tests on asymptomatic participants with MCI or dementia. Compared with the sub-tests, CERADTS presented better results with the lowest floor and ceiling effects, and skewness and Kurtosis indexes between –1 and 1 in all groups.
Descriptive statistics of single and total score of CERAD battery on asymptomatic MCI and AD-type dementia individuals on the PSEN1 E280A cohort

Notes: SD: Standard deviation.
Floor (%): Percentage of individuals located at the minimum value observed during the test.
Ceiling (%): Percentage of individuals located at the maximum value observed during the test.
VF/24: Verbal fluency/24; BNT/15: Modified Boston naming test/15; WLL/30: Word list learning/30; WLR/10: Word list recall/10; WLRD/10: Word list recognition discriminability/10; CP/11: Constructional Praxis/11 Copy; PR/11: Constructional Praxis/11 Recall; CERADTS/100: CERAD total score.
Discrimination
The AUC–ROC of CERADTS was 0.994 (95% CI = 0.989–0.999) in discriminating between the dementia and asymptomatic + MCI groups and 0.862 (95% CI = 0.816–0.908) between the MCI and asymptomatic groups.
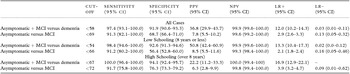
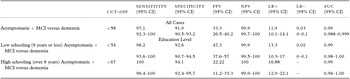
Table 4 shows the MCI and dementia cut-off points based on the best performance achieved on the ROC curve. For dementia, the cut-off point of 58 had a sensitivity of 97.4% (95% CI = 93.1–100.0) and a specificity of 91.9% (95% CI = 90.5–93.2). The cut-off point of 69 for MCI had a sensitivity of 91.3% (95% CI = 82.1–100.0) and a specificity of 68.7% (95% CI = 66.3–71.9). The graphic representation of ROC curves of CERADTS, CERAD sub-test, and MMSE are shown in Figure S1 (available as supplementary material attached to the electronic version of this paper at www.journals.cambridge.org/jid_IPG). Comparisons of discriminant capacity between CERADTS, CERAD sub-test, and MMSE were performed (see Table S1, available as supplementary material attached to the electronic version of this paper at www.journals.cambridge.org/jid_IPG). In the dementia versus asymptomatic + MCI comparison, the AUC was 0.90 or more, except in the Boston naming test. In the MCI versus asymptomatic comparison, the CERADTS had a similar discriminant capacity as that of the WLL/30 and WLRD/10, and better than that of the MMSE. The WLR/10 showed the best discriminant capacity (see Table S1).
Cut-off points for CERADTS and operating characteristics of the test in diagnosing MCI and dementia in a cohort of PSEN1 E280A mutation carriers

Notes: MCI: Mild cognitive impairment; CI: Confidence interval; PPV: Positive predictive value; NPV: Negative predictive value; LR+: Positive Likelihood ratio. LR–: Negative likelihood ratio.
The cut-off point for the diagnosis of dementia in the low education group was 54, with a sensitivity of 98.4% (95% CI = 94.5–100) and a specificity of 92.6% (95% CI = 90.7–94.5); in the high education group, the cut-off point was 67 with 100% sensitivity (95% CI = 96.4–100.0) and a specificity of 94.1% (95% CI = 92.4–95.7).
For the diagnosis of MCI, the cut-off point for the low education group was 66 with a sensitivity of 91.2% (95% CI = 80.2–100.0) and a specificity of 56.4% (95% CI = 52.8–60.0), and in the high education group, the cut-off point was 72 with a sensitivity of 91.7% (95% CI = 71.9–100.0) and a specificity of 76.3% (95% CI = 73.3–79.3).
Sensitivity analysis
In our sample, six participants were at moderate stage (CDR = 2), and two were at late stage (CDR = 3). We excluded these participants because they would cause an overestimate of sensitivity and specificity values, positive predictive value (PPV), negative predictive value (NPV), positive likelihood ratio (LR+) and negative LR (LR−). Table 5 shows the operating characteristics of CERADTS without these participants. The results showed no significant changes in the values of sensitivity, specificity, PPV, NPV, LR+, or LR−.
Sensitivity analyses of the operating characteristics of CERADTS for diagnosing dementia on a cohort of PSEN1 E280A mutation carriers. Dementia cases with CDR = 2 or 3 are excluded.

Adjusting for covariates
The AUC–ROC, sensitivity, and specificity values after adjusting for age and age + education were lower than the values without adjustment in diagnosing dementia. For diagnosing MCI, the AUC–ROC, sensitivity, and specificity values after adjusting for age were lower than the values without adjustment (see Table S2, available as supplementary material attached to the electronic version of this paper at www.journals.cambridge.org/jid_IPG).
Discussion
In this study, CERADTS was highly accurate in screening for dementia in a cohort of carriers of E280A mutation on PSEN1. This study is the first one to demonstrate the discriminating capacity of CERAD score in a sample with FAD. In addition, we found differences in the cut-off point for the optimum diagnosis of the disease based on the level of schooling: 54 for the participants with eight or less years of schooling and 67 for those with more than eight years of schooling.
The cut-off points encountered differences from those reported in other studies. In the study by Chandler et al. (Reference Chandler2005), the cut-off point to diagnose AD was set at 77, and in the study done by Seo et al. (Reference Seo2010), the cut-off points to diagnose dementia and MCI were set at 49.5 and 59.0 respectively. In the former study, the average education years were double that of the population with E280A, and the years of education in the second control group were two years lower than that of our cohort (a population with a low level of education with a basic training median of eight years).
These results support our findings that a direct relationship exists between education level and discriminating capacity, and specifically in the cut-off points required using the CERAD score to diagnose dementia. Paajanen et al. (Reference Paajanen2010) conducted a study of six European countries to determine CERAD cut-off points to diagnose MCI adjusted by age, gender, and education. Paajanen et al. (Reference Paajanen2010) proposed a cut-off point of 68.5 for all countries with variations between 58.5 and 73.5. This variation in cut-off points may be related to the recruitment of participants, especially if participants were recruited from memory hospitals, or selection was based on populations, or the size of the samples varied by countries (Paajanen et al., Reference Paajanen2010). Our results are consistent with a recent study (Han et al., Reference Han2014) that found the influence of demographic characteristics on the results of CERADTS.
However, in estimating cut-off points for diagnosis, a control group comprising healthy individuals according to the gold standard of the disease should be used for comparison with a dementia group. In previous studies (Chandler et al., Reference Chandler2005; Seo et al., Reference Seo2010), the group with dementia was compared against a group of asymptomatic participants, apparently free of MCI. However, the clinical spectrum of dementia, as confirmed previously in this cohort, appears to be a continuum ranging from a pre-MCI state to asymptomatic or symptomatic to the florid manifestations of dementia (Petersen, Reference Petersen2009; Acosta-Baena et al., Reference Acosta-Baena2011). Therefore, across the entire spectrum of potential clinical manifestations of cognitive impairment, the comparison between patients diagnosed with dementia and those without dementia is more valid and has more clinical applicability.
During the clinical course of the disease, tests measuring specific memory domains present ceiling effects (higher values) at pre-clinical AD stages; and as the disease advances, floor effects appear at moderate to serious stages (Barth et al., Reference Barth, Schönknecht, Pantel and Schröder2005). This property limits the use of specific tests for statistical modeling in longitudinal studies (Morris et al., Reference Morris, Evans, Hebert and Bienias1999). A recent study (Wolfsgruber et al., Reference Wolfsgruber2014), in addition to finding a high level of diagnostic precision for dementia with an AUC of 0.97, showed high predictive capacity for the incidence of dementia in a longitudinal study with two measurements with a time interval of 1.5 years.
It is necessary to consider some limitations in the interpretation of the results of this study. To control potential learning effects on the members of E280A, only the first neuropsychological assessment was used; therefore the recruitment of total population took place between 1995 and 2013, and the possible cohort effects related to external conditions, changes in clinical practice, and pharmacological and non-pharmacological interventions may have influenced the results. Exclusions were performed on the basis of the self-reported clinical assessments, and some false negatives were entered in the analysis. The participants without symptoms of MCI or dementia were younger than the participants with symptoms. We found an overestimation of AUC–ROC, sensitivity, and specificity values. We recommend that the future study of the normative data of CERADTS stratifies the results by age and education level. In addition, the possibilities for the generalization of results are limited in a population with low education levels and an established genetic condition with an early age of onset of MCI and dementia.
Conclusions
The CERADTS is a useful measurement in screening FAD and MCI. In addition, it does not have the methodological limitations of floor and ceiling effects present in specific sub-tests. Its implementation in clinical practice is being suggested, considering the cut-off points according to education level, not only as a diagnostic tool but also as a tool in studies to follow the clinical course of the disease.
Conflict of interest
None.
Description of authors’ roles
Daniel Aguirre, Fabian Jaimes, and Francisco Lopera contributed to the study design, data analysis, and writing of the paper. Eliana Henao, Victoria Tirado, and Claudia Muñoz contributed to data collection and assisted with the writing of the paper. Eric Reiman, Pierre Tariot, and Jessica Langbaum supervised data collection and assisted with the writing of the paper.
Acknowledgments
The authors wish to express their appreciation toward the participating Colombian families with E280A mutation on PSEN1. The authors also express their thanks to the following: Medical clinical staff and neuropsychologists at the Grupo de Neurociencias de Antioquia, the Banner Alzheimer's Institute, Comité para el Desarrollo de la Investigación (CODI). This work was supported by Comité para el desarrollo de la investigación CODI-Mediana cuantía (No. 609, August 2011), Grupo de Neurociencias de Antioquia, and Banner Alzheimer's Institute.
Supplementary Material
To view supplementary material for this paper, please visit http://dx.doi.org/10.1017/S1041610215001660.