


1. Introduction
The relationship between health and mortality is well established with those in poorer health experiencing higher mortality than the average population. The actuarial profession has long recognised the higher mortality and lower life expectancy of those in poor health with the underwriting process for assured lives designed to identify those in poor health for which special terms may be required. Individuals in poor health may be forced to retire early from the workforce before normal retirement age. Retirements from the workforce can therefore be split between those who are forced to retire early specifically for health reasons referred to as ill-health retirements and all other retirements referred to as normal-health retirements. Normal-health retirements, which include those who retire at normal retirement age and those who choose to retire at earlier or later ages form, fortunately, the majority of retirements from UK occupational pension schemes.
The mortality of ill-health pensioners can be expected to become more important for pension schemes in the future. Rates of retirement in ill-health increase with age and as pension schemes increase their normal retirement age in line with increasing life expectancy the number of ill-health retirements can also be expected to increase. Women tend to experience higher rates of chronic illness than men and are more likely to be in receipt of a disability pension than men (Claussen & Dalgard, Reference Claussen and Dalgard2009; Haukenes et al., Reference Haukenes, Gjesdal, Rortveit, Riise and Maelan2012; Malmusi et al., Reference Malmusi, Artazcoz, Benach and Borrell2012). Therefore, as the proportion of women in the workforce (and subsequently in occupational pension schemes) increases the number of ill-health retirements can also be expected to rise. Consequently, accurate models of the mortality experience of ill-health pensioners are required in order to fund for current and future ill-health retirement liabilities. Investigations into the mortality experience of ill-health pensioners, however, tend to be limited by the low volumes of data available for analysis. Pitacco (Reference Olivieri2012) provides an introduction to parametric models of excess mortality for modelling disability insurance products and discusses available life tables for disabled lives including ill-health retirement pensioners.
Pension scheme members seeking to retire on ill-health grounds must prove they are in sufficiently poor health (mental and/or physical) that they are prevented from performing their normal employment and that the incapacity is likely to be permanent. Typically, for UK defined benefit occupational pension schemes, the terms available on ill-health retirement are more generous than those available under normal-health retirement. This reflects the fact that the individual taking ill-health retirement is being forced to retire early for health reasons rather than choosing to do so for lifestyle reasons. For example, there may be no minimum age for ill-health retirement and the ill-health retirement pension may be based on prospective pensionable service to normal retirement age rather than actual service. For defined contribution (DC) type arrangements members retiring in ill-health may be entitled to receive their pension benefits early. However, as the amount received will be lower than what they would have received if they had of remained in the scheme with contributions accumulating until normal retirement age it is common for DC occupational pension schemes to provide permanent health insurance type cover for members forced to retire early for health reasons.
For those in employment retirement is generally a major lifestyle change. Research on the effect of retirement itself on health and mortality is often conflicting with some studies showing a beneficial influence of retirement on mortality in the period immediately following retirement and others showing a negative effect. Beneficial effects of retirement include a reduction in work-related stress and more free time to devote to maintaining personal health. Conversely, however, retirement can also result in a reduced social network and less mental and physical activity. Zweerink (Reference Zayatz2013) report lower mortality in the first 5 years after retirement amongst early retirees relative to those who retire at later ages. However, Dave et al. (Reference Dave, Rashad and Spasojevic2008) and Bloemen et al. (Reference Bloemen, Hochguertel and Zweerink2013) find that retirement increases the risk of morbidity and mortality from certain chronic diseases. Studies of the mortality of those in receipt of the state disability pension show that such pensioners experience significantly higher mortality in the year following retirement with a few exceptions by cause of illness most notably for those who retire for psychiatric reasons (Zayatz, Reference Zweerink2005; Ellingsen, Reference Ellingsen2010). Such studies are biased by the fact that recipients of the state disability pension may not have retired directly from the workforce and the mortality experience is therefore not directly comparable with that of ill-health retirements from occupational pension schemes. This “negative” or “reverse” select period has also been observed in the initial period following ill-health retirement from occupational pension schemes in the United States (American Academy of Actuaries, 2011).
Recent research on the effects of age at retirement on mortality is also conflicting with some studies showing lower mortality among those who retire earlier and vice versa. Hernaes et al. (Reference Hernaes, Markussen, Piggott and Vestad2013) provide a review of these studies before going on to show that for those retire who retire after age 60 age at retirement has no effect on future mortality. The “00” series of tables released by the Institute and Faculty of Actuaries, United Kingdom include separate life tables for life office pensioners who retire at normal retirement age and those who retire early (Continuous Mortality Investigation (CMI), 2009). Due to the relatively small number of ill-health retirements mortality estimates for ill-health pensioners are often based on the mortality experience of normal-health pensioners – for example, the mortality of an ill-health pensioner may be assumed to be that of an older normal-health pensioner (age rating) or a percentage adjustment may be applied to normal-health mortality rates. However, as discussed by Booth et al. (Reference Booth, Chadburn, Cooper, Haberman and James1998) this does not allow for effect of the “reverse” select period and assumes that the effect of impairment on mortality rates increases with age which may not be the case. At any retirement age the most seriously ill pensioners are likely to die first leaving a more robust group of ill-health pensioners remaining who were either less seriously ill initially or who have made a reasonable recovery from their illness. As a result ill-health retirement mortality rates can be expected to vary by duration since retirement. Ill-health retirement therefore has a short-term effect on mortality in the “reverse select” period immediately following retirement and a longer term or ultimate effect dependant on the age of and duration since retirement and accurate models of the mortality of ill-health retirement pensioners need to allow for these features.
In 2002, the CMI of the Institute and Faculty of Actuaries, UK, commenced an investigation into the mortality experience post retirement of UK pensioners in Self-Administered Pension Schemes (SAPS) (CMI, 2001). As a result of this investigation the CMI produced life tables in 2007 based on the 2001–2006 experience (“S1” tables) and in 2014 based on the 2004–2011 experience (“S2” tables) for normal-health pensioners by age, gender and pension band and for ill-health pensioners by age and gender (CMI, 2008 a , 2008 b , 2013 b , 2014). As expected the ill-health retirement mortality rates increase rapidly from the early fifties onwards for both males and females with the gap between males and females decreasing with age. The ill-health tables do not distinguish between “reverse select” and ultimate mortality and consequently for the “S2” tables the ill-health retirement mortality rates fluctuate at ages under age 50. This fluctuation does not occur in the earlier “S1” tables where mortality rates are assumed constant below a certain age.
Using the data collected by the CMI SAPS investigation for the period 2004–2011 this paper seeks to model, for the first time, the mortality of ill-health pensioners during the “reverse select” period immediately following retirement and during the subsequent ultimate mortality period. One- and two-dimensional generalised additive models (GAMs) are used to model the reverse select and ultimate mortality experience. The paper is organised as follows: section 2 describes the ill-health pensioner data used, section 3 models the mortality experience of ill-health pensioners during the “reverse select” period, section 4 models the ultimate mortality experience of the ill-health pensioners, section 5 compares the mortality experience of the ill-health pensioners with those of normal-health pensioners over the same period and section 6 concludes with a discussion of the results.
2. Data
In 2013, the CMI released the “S2” series of mortality tables based on the mortality experience of UK SAPS over the period 2004–2011 with the majority of the data relating to the period 2005–2008. The “S2” series of tables include graduated life tables for normal-health and ill-health pensioners. Further details on the SAPS data and the graduation of the “S2” series tables can be found in CMI working papers 65, 66 and 71 (CMI, 2013 a , 2013 b , 2014). The CMI has kindly made the data on which the “S2” ill-health life tables are based available for this analysis. This comprises approximately 345,000 male lives and 240,000 female lives. Ill-health retirements are, fortunately, less common than normal-health retirements in the United Kingdom. For comparison for the SAPS data collected by the CMI for the period 2004–2011 the exposure for the ill-health pensioners is approximately 1/6th and 1/5th that of the exposure for normal-health pensioners for males and females, respectively. The data made available for this analysis included the gender, date of birth, date of retirement, date of death where applicable and the exposure period for each pensioner. The date of retirement was missing for <2% of the records and these missing records were excluded from this analysis. No allowance has been made for late reported deaths.
The ill-health pensioner data included approximately 25,000 and 23,000 new male and female retirements during the period 2004–2011 and Figure 1 shows the proportion of new ill-health retirements by age group. The average age of retirement was 55.04 for males and 54.01 for females. There are proportionally slightly more ill-health retirements at younger ages (<50) for females relative to males. In general, however, the proportions retiring within each age group are relatively similar for males and females. As expected the number of ill-health retirements increases with age with almost 80% occurring after age 50. Due to the small number of ill-health retirements before age 40 and resulting low volume of data for analysis the reverse select and ultimate mortality experience of ill-health retirement pensioners was modelled for those retiring from age 40 onwards.
Proportion of ill-health retirements by age group at retirement for new retirements over the period 2004–2011 for males and females.

3. ''Reverse Select'' Mortality
In order to determine the duration of the reverse select period crude mortality rates were calculated and plotted for the first 10 years post retirement for those retiring aged 40–49, 50–54, 55–59 and 60–64. These crude rates are plotted in Figures 2 and 3 for males and females, respectively. From these plots it can be seen that mortality is highest in the 1st year after retirement and then falls rapidly before starting to rise again. The duration over which mortality rates fall is taken to be the reverse select period. The duration of the reverse select period varies with younger ages having a slightly longer reverse select period than older ages. From Figures 2 and 3 it can be seen that the reverse select period is typically between 4 and 5 years for males and between 5 and 6 years for females. The variation in the reverse select period appears to be larger for females with females at younger ages experiencing reverse select periods of up to 8 years.
Plots of the crude mortality rates for the first 10 years post ill-health retirement for males retiring aged (a) 40–49, (b) 50–54, (c) 55–59 and (d) 60–64.

Plots of the crude mortality rates for the first 10 years post ill-health retirement for females retiring aged (a) 40–49, (b) 50–54, (c) 55–59 and (d) 60–64.

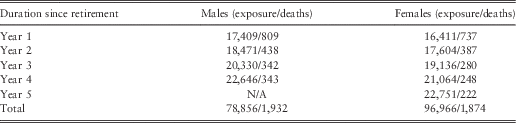
As the largest proportion of ill-health retirements occur in the age range 55–59, it was decided to use the reverse select period for this age group when modelling the reverse select mortality of the ill-health pensioners. Consequently, the reverse select period was set at 4 years for males and 5 years for females for this analysis. Male and female mortality was modelled separately during the reverse select period using the following factors:
Age: 40–64
Year: Duration since retirement in years: 1–4 for males and 1–5 for females
Table 1 summaries the data used to model the “reverse select” mortality experience. Exposures and deaths were calculated using age definition age last birthday and the exposure calculated is the central exposed to risk.
Exposure and deaths for modelling the reverse select mortality experience for ill-health pensioners.
GAMs are used to model the mortality experience during the reverse select period. GAMs extend generalised linear models (GLMs) (Nelder & Wedderburn, Reference Pitacco1972) which model a linear relationship between a non-normal response y and predictors x 1, … , x n for a set of subjects by allowing the linear predictor to include smooth functions of the covariates. Two-dimensional smooth functions allow for joint modelling of covariates. By relaxing the linearity assumptions of GLMs and allowing the linear predictor to include smooth functions of the covariates GAMs allow complex relationships to be implemented while still retaining a simple linear relationship amongst the predictor variables. Deaths are assumed to follow a Poisson distribution and the following models were fitted to the data:
 $$\eqalignno{ & d_{{ij}} \,\sim\,{\rm Poisson}\left( {E_{{ij}}^{c} \mu _{{ij}} } \right) \cr & {\rm Males}\,\colon\,\eta _{{ij}} \,{\equals}\,\log \left( {\mu _{{ij}} } \right)\,{\equals}\,\beta _{0} {\plus}f_{1} \left( {Age_{{ij}} } \right){\plus}f_{2} \left( {Age_{{ij}} } \right){\plus}f_{3} \left( {Age_{{ij}} } \right){\plus}f_{4} \left( {Age_{{ij}} } \right){\plus}\log \left( {E_{{ij}}^{c} } \right) \cr & {\rm Females}\,\colon\,\eta _{{ij}} \,{\equals}\,\log \left( {\mu _{{ij}} } \right)\,{\equals}\,\beta _{0} {\plus}f_{1} \left( {Age_{{ij}} } \right){\plus}f_{2} \left( {Age_{{ij}} } \right){\plus}f_{3} \left( {Age_{{ij}} } \right){\plus}f_{4} \left( {Age_{{ij}} } \right){\plus}f_{5} \left( {Age_{{ij}} } \right){\plus}\log \left( {E_{{ij}}^{c} } \right) $$
where i and j indicate the current age and year since retirement, respectively. d the number of deaths and E and μ the central exposed to risk and force of mortality, respectively. f is a one-dimensional smooth function with separate smooths for each year of the reverse select period. The smooth functions are implemented using thin plate regression splines (Wood, Reference Wood2003, Reference Wood2006). Unlike other spline-based smoothing functions thin plate regressions splines avoid the need to choose “knot” locations and they extend relatively easily to multi dimensions. The GAMs were implemented using the R (R Development Core Team, 2014), version 3.0.0 package mgcv version 1.8-6 (Wood, Reference Wood2001). The degrees of freedom (DOF) in the model specification determine the smoothness of the smooth functions. When specifying the DOF for a smooth function in a GAM a trade-off is needed between a sufficiently high DOF to correctly capture variations in the data and a low DOF to allow the overall trend in the data to be modelled. The models were fitted using penalised maximum likelihood where the model likelihood is modified by the addition of a penalty for each smooth function penalising its “wiggliness”. Each penalty is multiplied by an associated smoothing parameter which controls the trade-off between goodness of fit and smoothness. The application of the penalties during fitting reduces the DOF in the model specification to yield the effective DOF for the smooth functions. The smoothing parameters are estimated automatically from the data. The DOF in the model specification place an upper limit on the flexibility of a smooth function while the smoothing parameters determine the effective DOF within that limit. The lower the effective DOF the smoother the resulting smooth function will be. The choice of DOF for the smooth functions in the GAM specification is not generally critical as long as they are sufficiently large to model the underlying smooth structure as the penalisation process determines the effective DOF. Further details on specifying smooth functions for GAMs can be found in Hall & Friel (Reference Hall and Friel2011).
The resulting models were checked for appropriateness using the method described by Wood (Reference Wood2006). In summary, this involved extracting and smoothing the deviance residuals with respect to the covariates but using significantly increased DOF to ensure that there was no pattern in the residuals that could be explained by increasing the DOF. Non-significant terms were dropped and Table 2 presents the final models for males and females, respectively, while Figure 4 presents the corresponding residual plots. The adjusted R 2 values for the models are 0.90 and 0.89 for males and females, respectively.
Generalised additive model residual plots for modelling the ill-health retirement reverse select mortality experience for males and females, respectively.

Parameter values for modelling the reverse select mortality of the self-administered pension schemes ill-health pensioners for males and females, respectively.
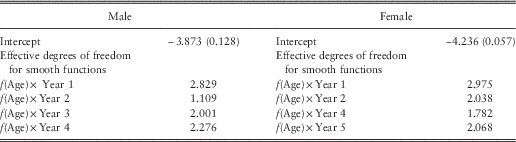
Figure 5 presents the resultant values of log(μ x ) and the associated 95% Bayesian confidence intervals for each year of the reverse select period for males and females. The confidence intervals are generalisations of the Bayesian confidence intervals of Wahba (Reference Wahba1983) and Silverman (Reference Silverman1985), and further details can be found in Marra & Wood (Reference Marra and Wood2012) and Wood (Reference Wood2006). As expected mortality is highest is the 1st year following retirement due to ill-health and then falls rapidly with year since retirement with the greatest improvements in mortality occurring at the younger ages for both males and females. In contrast to the expected pattern of increasing mortality with age in the 1st year after retirement female mortality is highest for those retiring at younger ages peaking in the late forties before starting to decline. Male mortality in the 1st year after retirement peaks for those retiring in their early sixties before declining slightly. One possible reason for the lower mortality at later ages may be a relaxation in the qualifying conditions for ill-health retirement as normal retirement age approaches. Post year 1 males exhibit the expected pattern of increasing mortality with age and show a steady improvement with duration or year since retirement. Similarly, females exhibit improving mortality with duration since retirement. As discussed previously females at younger ages have the longest select period and this is reflected in the higher female mortality relative to males at these ages in years 3 and 4 post retirement.
Reverse select mortality, log(μ
x
), and associated 95% confidence intervals for ill-health retirement pensioners for males ( ) and females (
 ).

4. Ultimate Mortality
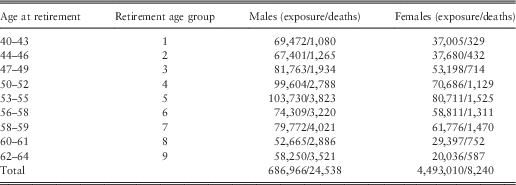
The ill-health pensioners were divided into nine groups depending upon their age at retirement. Analysis of the data showed convergence of mortality rates by age 85 for males and age 80 for females, and consequently the corresponding ultimate mortality models were fitted to ages 85 and 80. For comparison mortality models were also fitted to ages 90 and 95 for both males and females but there was little difference in the resulting mortality rates before convergence. Table 3 summarises the data used to model the ultimate mortality by age at retirement for males and females, respectively. As before the exposure is the central exposed to risk and age is defined as age last birthday.
Summary of deaths and exposure for modelling the ultimate mortality experience for ill-health pensioners.
Two-dimensional Poisson GAMs were used to model the ultimate mortality by current age and age at retirement as follows:
 $$\eqalignno{ & d_{{ij}} \,\sim\,{\rm Poisson}\left( {E_{{ij}}^{c} \mu _{{ij}} } \right) \cr & \eta _{{ij}} \,{\equals}\,\log \left( {\mu _{{ij}} } \right)\,{\equals}\,\beta _{0} {\plus}f(Age_{i} ,RetirementAgeGroup_{j} ){\plus}\log \left( {E_{{ij}}^{c} } \right) $$
where i and j indicate the current age and age group at retirement, respectively. d the number of deaths and E and μ the central exposed to risk and force of mortality, respectively. f a two-dimensional smooth function implemented using thin plate regression splines. Separate models were implemented for males and females. The two-dimensional smooth function allows mortality rates to vary smoothly by current age and age group at retirement. The GAMs were fitted in the same way as for the “reverse select” mortality models in section 3.The resulting models are presented in Table 4 with the corresponding residual plots in Figure 6.
Two-dimensional generalised additive model residual plots for modelling the ill-health retirement ultimate mortality experience for males and females, respectively.

Results of fitting two-dimensional generalised additive models to ultimate mortality data by current age and age at retirement for male and female ill-health retirements.

Figure 7 presents the resulting ultimate mortality μ x from age 65 by age group at retirement relative to those who retired in the youngest age group 40–43 for both males and females. From Figure 7 it can be seen that the effect of age at retirement decreases with increasing age for both males and females. Age at retirement has a greater effect on female mortality at younger ages relative to males with a gap of ~40% between the mortality at age 65 for females who retired aged 40–44 and those who retired between ages 62 and 64. The corresponding gap for males is ~20%. Mortality, however, tends to converge faster for females with mortality converging by approximately age 80 for females and age 85 for males.
Ultimate mortality μ
x
for ill-health retirement pensioners from age 65 by age group at retirement relative to those who retired aged 40–43. Retirement age groups: 44–46 (), 47–49 ( ), 50–52 (
 ), 53–55 (
 ), 56–58 (), 58–59 (
 ), 60–61 (
 ), 62–64 (
 ).

For comparison, Figure 8 plots the ultimate mortality μ x and corresponding 95% Bayesian confidence intervals at ages 70, 75 and 80 for males and females, respectively. The width of the confidence intervals increase with age reflecting the lower relative data volumes at later ages. From Figure 8 it can be seen that mortality decreases with age group at retirement with males experiencing a larger decrease than females for the ages shown.
Ultimate μ
x
and associated 95% confidence intervals for ill-health retirement pensioners at ages 70 (), 75 () and 80 () for males and females.

Post-convergence mortality was calculated by aggregating deaths and exposures by age and fitting the following simple GAM with age as the only covariate for males and females separately:
 $$\eta _{i} \,{\equals}\,\log \left( {\mu _{i} } \right)\,{\equals}\,\beta _{0} {\plus}f\left( {Age} \right)_{i} {\plus}\log \left( {E_{i}^{c} } \right)$$
where, as before, i indicates the current age and the smooth function, f, is implemented using thin plate regression splines. The models were fitted to age 102 for both males and females – the last age at which a death occurred.
Post-convergence mortality rates were blended with the rates pre-convergence by interpolating between ages 85 and 90 for males and 80 and 85 for females. The mortality rates were calculated from the forces of mortality, μ x , as follows:
 $$q_{x} \,{\equals}\,1{\minus}{\rm exp}({\minus}\left( {\mu _{x} {\plus}\mu _{{x{\plus}1}} } \right)\,/\,2)$$
The relative difference in the 30-year probabilities of survival at age 65, 30 p 65, for ill-health pensioners retiring at ages 40 and 60 was approximately 1.3 for males and 1.18 for females.
5. Comparison of Ill-Health and Normal-Health Pensioner Mortality Experience
To put the impact of ill-health retirement on mortality in context this section compares the mortality experience of the ill-health pensioners with that of normal-health pensioners. As discussed in section 1, the CMI SAPS investigations also include the mortality experience of normal-health pensioners. The CMI has made available the SAPS “S2” normal-health pensioner life tables based on the mortality experience for the period 2004–2011.
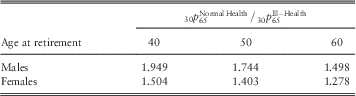
Table 5 compares 30-year probabilities of survival at age 65, 30 p 65, for ill-health pensioners retiring at ages 40, 50 and 60 with those for normal-health pensioners for males and females. Survival probabilities for normal-health pensioners use life tables “S2PML” and “S2PFL” for males and females, respectively. As expected the difference in the survival probabilities, 30 p 65, between normal-health and ill-health pensioners decreases with age at retirement. The difference between the normal-health and ill-health survival probabilities is larger for males than for females.
Ratio of 30-year survival probabilities at age 65 between ill-health pensioners retiring at ages 40, 50 and 60 and normal-health pensioners.
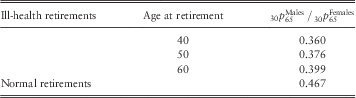
Similarly, Table 6 compares the difference or the gap in the 30-year probability of survival at age 65 between males and females for ill-health pensioners retiring at ages 40, 50 and 60 and for normal-health pensioners. The gap between males and females is greater for ill-health pensioners with the gap decreasing with age at retirement.
Ratio of gap in 30-year survival probabilities at age 65 between males and females for ill-health pensioners retiring at ages 40, 50 and 60 and normal-health pensioners.
6. Discussion
Accurate mortality models are required in order to fund pension liabilities for ill-health pensioners. Using data from the CMI investigation into the mortality experience of occupational pension scheme members in the United Kingdom, we have shown that mortality models for ill-health pensioners should allow for reverse select mortality and the effect of age of retirement on ultimate mortality rates. For both males and females the impact of the reverse select period is most important at younger ages and females experience a longer reverse select period than males. Post the reverse select period the effect of age at retirement tends to decrease with age. While the age of retirement has a greater effect on females relative to males at younger ages the effect wears off faster with female mortality rates converging by age 80 and males converging slightly later by the mid-eighties.
GAMs provide a simple, intuitive and flexible method of modelling the mortality of ill-health pensioners. A range of models was used to model the reverse select and ultimate mortality experience. The models were implemented using the R (R Development Core Team, 2014) package mgcv which provides a choice of smoothing functions in one and multiple dimensions and diagnostic and graphing facilities for interpreting and visualising the model results. The degree of smoothing in the smooth functions of mortality by age are chosen automatically which simplifies model fitting. However, automatic smoothness selection can be problematic with low or volatile data and the final model should always be checked for reasonableness. GAMs can be difficult to interpret and interactions between smooth functions can result in very complex models. The authors found it more difficult to fit the GAMs to the smaller, more volatile, reverse select mortality experience than to the ultimate experience. Different smoothness selection methods were tried and it was found that restricted maximum likelihood provided the smoothest fits. There was little difference between the smoothing methods when fitting the ultimate mortality models and generalised cross-validation was used in the final models. Further information on estimating smoothing parameters can be found in Wood (Reference Wood2006).
The non-parametric nature of the smooth functions in GAMs means that they are well suited for exploratory analysis of data where there is little or no prior knowledge of the form or structure of the data as was the case when modelling the ill-health mortality experience. However, GAMs are not well known in actuarial science where GLMs are more common (Haberman & Renshaw, Reference Haberman and Renshaw1996; Jong & Heller, Reference Jong and Heller2008). In general GLMs are easier to interpret and to fit than GAMs. Where the GAMs fit relatively simple smooth functions to the data the models can be refitted using GLMs if a parametric model is desired.
The models discussed in this paper assume that mortality varies only by current age and year since retirement in the case of reverse select mortality and by current age and age group at retirement in the case of ultimate mortality. In practice, mortality rates will be affected by a range of other factors both observable and unobservable. Pension amount is known to have a significant impact on pensioner mortality rates (Brown & Mc Daid, Reference Brown and Mc Daid2003; Madrigal et al., Reference Madrigal, Matthews, Patel, Gaches and Baxter2011) and future work will look at extending the models to examine the impact of pension amount on mortality rates for ill-health retirements. Unobservable factors affecting mortality leads to heterogeneity in the underlying data. Heterogeneity can arise due to differences in individuals susceptibility to death with frailer or less healthy lives dying sooner than more healthy lives. Ill-health retirements range from those with life-threatening illness to those who are unable to perform their normal occupational duties but are otherwise healthy. Individuals will also vary in their ability to recover from or to mitigate the effects of their illness. Various methods have been developed to allow for frailty or heterogeneity in mortality models (Butt & Haberman, Reference Butt and Haberman2004; Olivieri, Reference Nelder and Wedderburn2006). Future work will look at allowing for heterogeneity when modelling ill-health pensioner mortality.
In conclusion, mortality models for ill-health retirement pensioners should allow for reverse select mortality and ultimate mortality experience by age at retirement. Further work is required to extend the models to allow for heterogeneity in the underlying data and to investigate the impact of pension amount on the mortality of ill-health pensioners during both the reverse select and ultimate mortality period.
Acknowledgements
The authors wish to thank both the CMI of the Institute and Faculty of Actuaries, UK, for providing the ill-health retirement pensioner data for analysis and the anonymous referees whose constructive comments have substantially improved the paper.



