I. Introduction
The use of chemical inputs in agriculture has never been as extensive and as severely criticized as in recent years. Used heavily over decades in the name of production-oriented agriculture, chemical inputs have provided the basis for ensuring and substantial agricultural production (Just and Pope, Reference Just and Pope2003). While pesticides represent a way of protecting plants, fertilizers are designed to stimulate growth (Horowitz and Lichtenberg, Reference Horowitz and Lichtenberg1994; Mishra et al., Reference Mishra, Nimon and El-Osta2005). The former play a major role in stabilizing farm income while the latter contribute to increasing this income. However, due to the intensive use of these chemical inputs in agriculture, various types of pollution have appeared over time and are at the heart of current environmental concerns.
The increasing precision of scientific analyses means that the direct and indirect impacts of chemical inputs, both on the environment and on human health, can be assessed more clearly (Leach and Mumford, Reference Leach and Mumford2008). Three major issues can be identified with regard to sustainable development. First, in ecological terms, it has now been established that chemical inputs contribute significantly to ground pollution through a process of leaching (Craven and Hoy, Reference Craven and Hoy2005), and sustained use threatens the integrity of the water table (Anderson et al., Reference Anderson, Opaluch and Sullivan1985; Arias-Esévez et al., Reference Arias-Esévez, Lopez-Periago, Martinez-Carballo, Simal-Gandara, Merut and Garcia-Rio2008). Second, in social terms, pesticides represent a proven source of danger to consumers of products treated with these inputs (Pan et al., Reference Pan, Plant, Voulvoulis, Oates and Ihlenfeld2010) and to farmers who apply them to their crops (Antle and Capalbo, Reference Antle and Capalbo1994; Antle et al., Reference Antle, Cole and Crissman1998). Third, in economic and financial terms, chemical inputs are an integral part of the production model of farms, which raises questions concerning the feasibility of reducing them in the agricultural sector (Shumway et al., Reference Shumway, Saez and Gottret1988).
Together, these issues have led to increased oversight in the use of chemical inputs. The European Union (EU) is especially prominent in this area, implementing a new legislative framework on September 1, 2008 (Regulation No. 396/2005 of the European Parliament and of the Council on “maximum residue levels of pesticides in or on food and feed of plant and animal origin”). The aim is to protect consumers from excessive levels of pesticides in food products determined by the European Environment Agency (EEA).Footnote 1 Within the EU, the French government initiated the Grenelle Environnement in May 2007, which targeted preservation of biodiversity and natural resources while adopting more environmentally friendly production methods. The Grenelle Environnement was an open-debate conference that involved the government (both national and local authorities) as well as political parties, scientists, trade unions, employers' associations and environmental protection associations. The resulting commitments were enshrined into the legislation.
The French government is particularly concerned about this issue because France is the leading consumer of phytosanitary products in Europe and the third-largest user worldwide (Aubertot et al., Reference Aubertot, Barbier, Carpentier, Gril, Guichard, Lucas, Savary, Savini and Voltz2005). French farms are characterized by a level of use of phytosanitary products similar to that of the other European countries, at an average of 4.4 kg per hectare (ha) (Baschet and Pingault, Reference Baschet and Pingault2009). Nevertheless, different behavior patterns regarding chemical inputs exist according to different types of production. One-third of the usable agricultural area is intended for large-scale crops and accounts for 48% of spending on inputs, while winegrowing represents 4% of the usable surface area and 14% of spending on chemical inputs. Due to this fact, the legislation (Article 31 of law no. 2009-967 of August 3, 2009) was adopted with a target of reducing the use of phytosanitary products in agriculture by 50% by 2018. In light of the high dependence of wine production on inputs, a target reduction rate of 37% by 2012 may be more realistic for this specific sector (Butault et al., Reference Butault, Dedryver, Gary, Guichard, Jacquet, Meynard, Nicot, Pitrat, Reau, Sauphanor, Savini and Volay2010).
Given this context, we propose to study the determinants of winegrowers' demand for chemical inputs. This analysis is designed to identify the motivations of French farmers using pesticides and fertilizers when confronted by risks affecting their harvests. The case of French winemakers is particularly interesting because the consumption of chemical inputs in the wine grape–growing industry has not, to the best of our knowledge, been the subject of any previous studies.
Because agricultural practices will have to evolve in the coming years, one must also consider the perspective of input reduction. Such a change in farming practices represents a leap into the unknown, as pesticides offer protection against certain diseases. The disappearance of pesticides may increase yield volatility and, by the same token, increase the volatility of farmers' income (Foster and Babcock, Reference Foster and Babock1991), while a reduction in fertilizers may lead to a direct reduction in production. Reducing these inputs should, therefore, be accompanied by the development of alternative products to protect farmers against yield volatility and to secure their income. Given these contingencies, we must consider the different insurance strategies adopted by winegrowers (Babcock and Hennessy, Reference Babcock and Hennessy1996). The use of chemical inputs can be compared to a sort of self-insurance (Ehrlich and Becker, Reference Ehrlich and Becker1972), given that the winegrower also uses these products to limit exposure to diseases. Other forms of self-protection include the diversification of crops or activities outside the farm on the part of the winegrower (Coble and Knight, Reference Coble, Knight, Just and Pope2002; Feinerman et al., Reference Feinerman, Herriges and Holtkamp1992).
Some insurance products are specifically dedicated to covering crops or their yields. The development of these policies progressed considerably in France during the first decade of the twenty-first century with the introduction of private insurance aimed at covering crop yield (Enjolras and Sentis, Reference Enjolras and Sentis2011). French crop insurance policies provide compensation if a farmer's yield falls below a defined threshold. Consequently, they do not hedge against price variations. The question remains whether insurance strategies are substitutable or complementary to the application of inputs (Smith and Goodwin, Reference Smith and Goodwin1996; Wu, Reference Wu1999). Both pesticides and crop insurance share the same goal: to protect farmers against losses due to natural disasters and therefore to stabilize their income. For this reason, the literature generally considers them substitutable. The relationship between fertilizers and crop insurance is less clear because the aim of crop insurance is not to enhance farmers' income.
Our analysis applies information from the French Farm Accountancy Data Network (FADN) databases between 2002 and 2007, which offer an overview representative of professional French vineyards, in terms of productive orientation. They are, in fact, the most complete and appropriate information sources when incorporating both the structural and financial aspects of vineyards. Using this data, we consider a number of characteristics of vineyards by focusing on their structure (size, quality of vineyards, etc.) and their financial situation (profitability, yield volatility, indebtedness, etc.). We also introduce several variables, primarily to control for climatic conditions, which are crucial factors in the spread of crop disease and, thus, in the use of inputs (Caswell and Shoemaker, Reference Caswell and Shoemaker1993). To ensure the highest level of precision, meteorological readings are taken for each village. Using a combination of these data for the very first time, the analysis offers insight into both the determinants and the dynamics of chemical input use.
The article is organized as follows: in section I, we describe the empirical framework of our research. In section II, we explain the methodology and the variables adopted in our analysis. In section III, we present the results obtained using static and dynamic analyses. Finally, we conclude with a summary of the determinants of the use of chemical inputs by winegrowers and examine the perspectives offered in this study.
II. Empirical Framework Explaining the Use of Chemical Inputs in the Wine Grape–Growing Industry
In this section, we begin by developing a model explaining the farmer's level of chemical input use. We then present the main variables and the associated testable hypotheses.
A. A Model of Farm-level Input Use
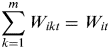
Farmers apply inputs in order to increase or preserve their profits. As in Rahman (Reference Rahman2003), the maximization function of the farm's profit (Πit) can be written as:
 $$\Pi _{it} = \mathop \sum \limits_{k = 1}^m s_{ikt} Y_{ikt} - \alpha F_{it} - \beta P_{it} - \gamma W_{it} $$
with:
 $$Y_{ikt} = f\,(F_{ikt}, P_{ikt}, W_{ikt}, A_{ikt}, E_{it} )$$
and:
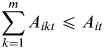 $$\mathop \sum \limits_{k = 1}^m A_{ikt} \leqslant A_{it} $$
where:
 $$\mathop \sum \limits_{k = 1}^m F_{ikt} = F_{it} $$
 $$\mathop \sum \limits_{k = 1}^m P_{ikt} = P_{it} $$
 $$\mathop \sum \limits_{k = 1}^m W_{ikt} = W_{it} $$
Equation (1) is the individual production function for each farm i in year t. Y ikt corresponds to the yield of each crop k, depending on fertilizer use F ikt, pesticide use P ikt, workforce use W ikt, the relative area allocated to each crop A ikt and a set of exogenous factors E it. s, α, β, and γ represent the market prices of crops, fertilizers, pesticides, and labor, respectively.
The first-order condition determines the function of demand for all kinds of inputs I it (fertilizers, pesticides, or workforce):
 $$I_{it} = I_{it} (\alpha, \beta, \gamma, s_{1t}, \; \ldots \;, s_{mt,} A_{1t}, \; \ldots \;, A_{mt}, E_{it} )$$
Equation (7) states that we can estimate individual functions of demand for each type of input. It also indicates which variables may affect the demand for chemical inputs.
B. Factors Explaining Input Demand
The use of chemical inputs is determined by several factors relating to the characteristics of the vineyards, mainly the structure of the farm, its financial situation, the subscription of crop insurance policies, and the climate. To ensure maximum precision, we use several measurements of the demand for inputs: the consumption of fertilizers, the consumption of pesticides, and the total consumption of inputs. Considerable differences may indeed exist between the use of pesticides and fertilizers considered separately (Mishra el al., 2005).
(1) Chronology of the wine grape–growing season
As explained in the previous section, many factors, for example, the area farmed and the financial results, can explain the use of pesticides. The same factors can also determine the decision whether to take out crop insurance, which means that pesticide use and crop insurance may be endogenous. This assumption of endogeneity has been explored abundantly in the literature (Babcock and Hennessy, Reference Babcock and Hennessy1996; Chakir and Hardelin, Reference Chakir and Hardelin2010; Goodwin et al., Reference Goodwin, Vandeveer and Deal2004; Wu, Reference Wu1999).
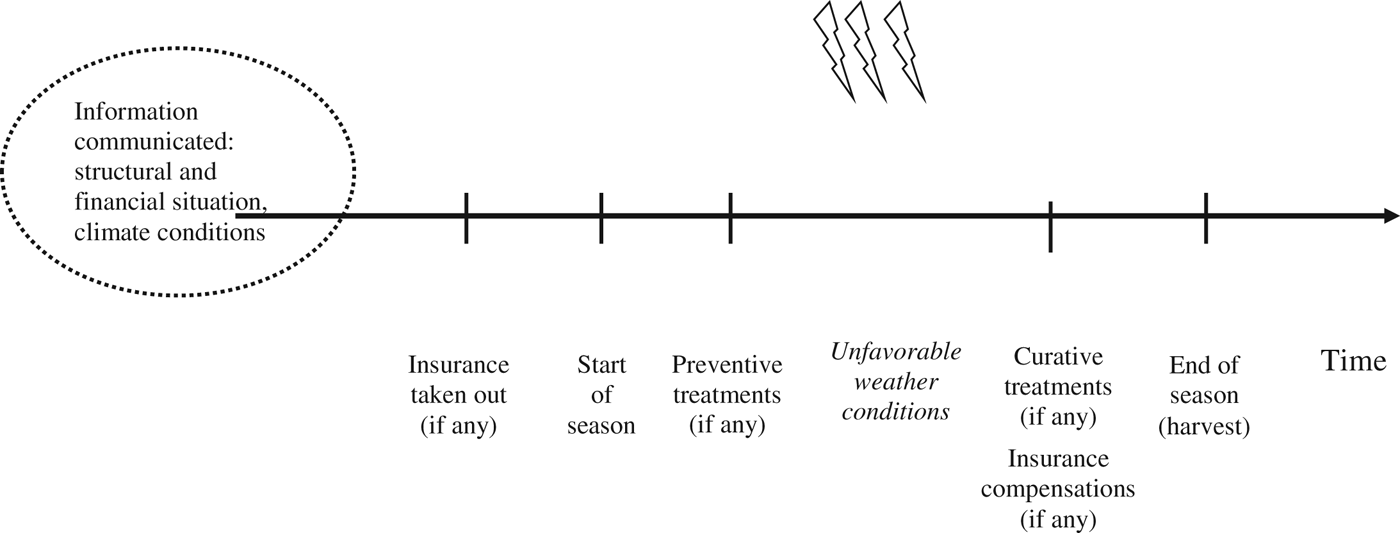
One essential parameter is nevertheless often neglected: the timeframe of the action (Figure 1). For instance, the decision to take out insurance must be made before the beginning of the season to avoid, in theory, moral hazard effects. Without this clause, an opportunistic farmer could take out insurance after he is in a position to observe low yields. However, when insured, winegrowers may reduce their consumption of chemical inputs (Goodwin et al., Reference Goodwin, Vandeveer and Deal2004; Smith and Goodwin, Reference Smith and Goodwin1996). Such behavior is unbeknownst to the insurance company. Consequently, the application of inputs on vines, whether preventive or curative, must take into account the farmer's decision to purchase crop insurance.
Chronology of the Wine Grape-growing Season

(2) Structure of the vineyard
The structural variables must enable us to examine the impact of the size of the farm on its consumption of inputs (Babcock et al., Reference Babcock, Chalfant and Collender1987). We also consider the quality of the vineyards, which is a decisive factor in their valuation (Reynolds, 2000). The financial variables enable us to test financial performance and to measure the risk exposure of those farms using inputs (Fernandez-Cornejo, Reference Fernandez-Cornejo, Jans and Smith1998). We include in the analysis the profitability of the farm, its yield volatility, and its level of indebtedness.
A vineyard can be described as drawing on structural factors. These indicators include the size of the farm. In absolute terms, it would seem reasonable to expect a positive correlation between the size of the farm and the consumption of chemical inputs. To take size into account, we standardize the consumption of fertilizers and pesticides per ha. We can assume a negative relationship between the use of inputs per ha and the size of the vineyard due to their decreasing profitability.
Other characteristics must also be incorporated in the analysis, such as any specialization observed in the vineyard, because some produce higher-quality wines corresponding to a protected geographical origin. The desire for quality might seem to offer an incentive to reduce the volume of inputs in the production process. At the same time, a high price level may encourage winegrowers to maintain their yields and to continue consuming inputs.
The decision to use chemical inputs also depends on the individual strategy of the winegrower. It would therefore appear necessary to consider education level (Wu, Reference Wu1999). According to the literature, an educated farmer is more aware of the harmful effects linked to chemical inputs and better able to manage input use (Fernandez-Conejo and Ferraioli, Reference Fernandez-Cornejo and Ferraioli1999; McNamara et al., Reference McNamara, Wetzstein and Douce1991). We test whether winegrowers who have received more education adopt a more moderate level of input consumption.
Hypothesis 1a: There is a negative link between the standardized use of chemical inputs and the total area of the vineyard.
Hypothesis 1b: There is a negative link between the standardized use of chemical inputs and the education level of the winegrower.
(3) Financial situation of the vineyard
To evaluate the financial situation of those vineyards that use inputs, we called on a set of criteria usually adopted in corporate finance. As inputs increase yields and reduce the variability of profit (Just and Pope, Reference Just and Pope2003), turnover is a reference indicator, which offers a complementary measurement to the area farmed, expressed as the size of the vineyard.
This must be complemented by other indicators that measure a vineyard's risk. With this in mind, it is essential to incorporate yield volatility, as the use of fertilizers and pesticides is intended to increase and stabilize yields, respectively (Babcock and Hennessy, Reference Babcock and Hennessy1996; Wu, Reference Wu1999). The level of risk aversion of the winegrower conditions chemical input use. Another risk factor is indebtedness, which reflects the solvency of a farm (Chakir and Hardelin, Reference Chakir and Hardelin2010). Risk management through inputs is nevertheless costly and may increase the level of indebtedness. However, inputs can ensure the survival of an indebted farm by guaranteeing a proportion of its yields.
Other indicators can also be used, such as intermediate management balances, which offer indications concerning the structure of earnings. A farm's performance must also be measured by calculating its economic profitability. Maintaining earnings or performance may prove to be an incentive to use inputs.
Hypothesis 2a: The greater the financial size and profitability of a vineyard, the more chemical inputs it uses.
Hypothesis 2b: The existence of financial risks to a vineyard has a positive impact on the use of chemical inputs.
(4) Crop insurance strategy
This paper aims to provide new elements for the debate on the substitutability or complementarity between chemical inputs and crop insurance in the wine grape–growing sector. More broadly, one objective is to determine whether chemical inputs increase or reduce risk for winegrowers.
As with the use of chemical inputs, the decision to take out insurance is the winegrower's personal choice aimed at reducing the risk linked to this activity. Insurance involves a cost—the premium—in exchange for which the policyholder may receive compensation in the event of the partial or total destruction of the harvest. Similarly, inputs involve an expense for the farmer. In exchange, pesticides protect yields while fertilizers tend to increase yields. In these conditions, pesticides and crop insurance would appear to be substitutable products (Smith and Goodwin, Reference Smith and Goodwin1996).
One should also note that all kinds of chemical inputs increase expected yield, some of which decrease risk, combating specific risks, while others increase risk, exacerbating other risks. For instance, pesticides reduce the risks associated with pests, thereby resulting in better yields. At the same time, they also increase the variability of outputs by increasing yields value in good years. In this context, the use of chemical inputs appears to be an additional risk factor, thereby justifying the decision to take out insurance (Horowitz and Lichtenberg, Reference Horowitz and Lichtenberg1993).
Measuring the farmer's level of risk aversion helps to clarify the situation (Pannell, Reference Pannell1991). A farmer who is highly risk averse will increase consumption of inputs. However, this increase will probably be limited by taking out insurance contracts (Feinerman et al., Reference Feinerman, Herriges and Holtkamp1992). Inversely, farmers demonstrating little risk aversion will view inputs and insurance products as substitutes (Babcock and Hennessy, Reference Babcock and Hennessy1996).
Hypothesis 3: There is a negative link between chemical inputs and the decision to take out crop insurance.
(5) Climatic conditions
“We do not treat when we want, but when we can.” (Flandin, Reference Flandin1983).
In addition to the timing of the application (Hall and Norgaard, Reference Hall and Norgaard1974), it is essential to consider climatic conditions (Shoemaker, Reference Shoemaker1979).
As with numerous crops, the yield of vines is naturally highly sensitive to excessive climate variation (Rosenzweig et al., Reference Rosenzweig, Iglesias, Yang, Epstein and Chivian2001). For example, high levels of precipitation damage the development of grapes. If these grapes have been treated, the protection would be washed away through seepage into the soil. Because they are now more vulnerable, the vines would then be subject to attack by mold and disease.
Aggregate precipitation is traditionally the only criterion retained in the existing literature (Horowitz and Lichtenberg, Reference Horowitz and Lichtenberg1993; Mishra et al., Reference Mishra, Nimon and El-Osta2005) while numerous studies ignore the link between climate and pesticide dosage. To explore this question further, the field of variables considered must be extended to include temperature and even levels of sunshine. These two measurements reflect the climatic conditions throughout a season.
Hypothesis 4: Extreme climatic conditions or those favorable to epidemics lead to increased consumption of chemical inputs.
The aim of the following sections is to test these different hypotheses.
III. Methodology
Based on the detailed empirical framework described above, the methodology we have developed identifies the determinants of the use of chemical inputs in the wine production sector. We introduce a full range of variables and econometric models suited to a transversal and longitudinal analysis.
A. Sources of Data
The intensity of chemical input use depends on the structure of the vineyard, its financial results, and the climatic conditions. In order to incorporate all these aspects, we have made simultaneous use of the FADN databases for the vineyards and Météo France for the climate.
(1) FADN data
The FADN databases refer to professional farms in France. By definition, these farms cultivate at least the equivalent of 12 ha (29 acres) of wheat. They also employ the equivalent of at least one person working more than 75% of a full-time workload. Data are obtained annually through a detailed survey performed by the French Ministry of Agriculture. Collected information includes the structural and financial characteristics of the vineyards as well as their practices in terms of input use. Inputs' costs differentiate fertilizers from phytosanitary products. We can retain this distinction of fertilizer versus pesticides while also calculating the total volume of inputs. This enables us to determine whether the criteria for the use of fertilizers are the same as those for the use of pesticides and whether inputs can be considered as a whole.
The data at our disposal cover the period from 2002 to 2007. In 2002, 1,058 farms were surveyed for a total of 44,270 farms operating vineyards in France, while in 2007, 1,042 farms were surveyed, representing a real figure of 43,015 wine farms. In order to assess the changing practices of farmers in terms of input use, our analysis focuses on a balanced panel of 607 French vineyards in permanent activity over the entire period. We observe that almost 60% of the farms represented in the original sample are retained in the balanced panel since they were present for the entire period. Our database, as a result, contains 3,035 observations.Footnote 2
With a concern for representativeness, the data collected satisfy the quota method: The stratification takes into account the region, the productive orientation, and the economic dimension of the farms. Data are weighted by the Ministry of Agriculture regarding this stratification in order to represent the entire population of farms more accurately.
(2) Meteorological data
Climate conditions are beyond human control but affect the application of inputs. Following Houmy (Reference Houmy1994), we pay close attention to the microclimate in which vines grow so as to enhance the accuracy of the analysis. Yet Lecocq and Visser (Reference Lecocq and Visser2006) and Storchmann (Reference Storchmann2005) showed that while highly localized weather data improved model fit, less localized data were also quite accurate.
By using targeted climatic variables provided by Météo France, our analysis places meteorological conditions at the heart of the decision-making process. Using a pairing operated at communal level between the FADN data and the meteorological data, we obtain the exact figures for rainfall and temperature observed for each vineyard over the 2002–2007 period.
B. Variables
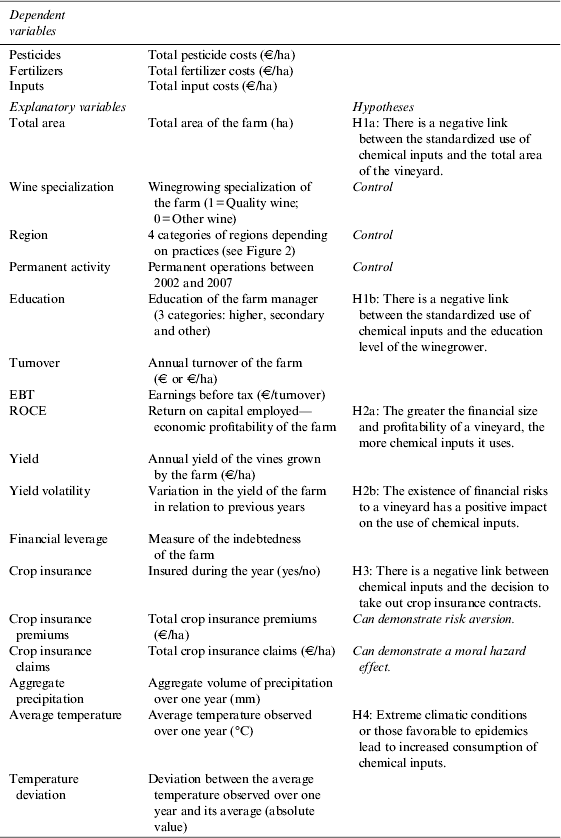
Our empirical framework considers that the use of chemical inputs depends on several factors. Some are associated with the farm itself, such as structural and financial factors. Others are exogenous, such as climate variations. Table 1 links the variables presented below with the hypotheses developed in the previous section.
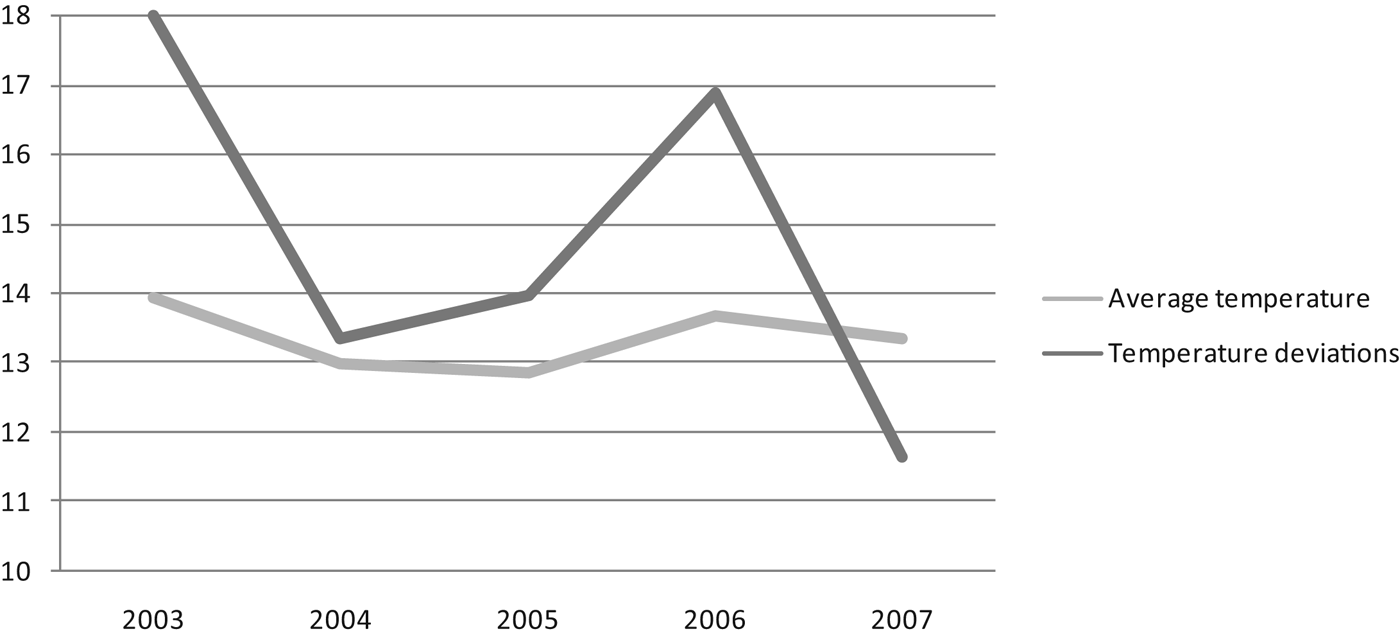
Change in Average Temperatures and Temperature Deviations Per Year
Definition of the Variables and Associated Hypotheses
(1) Chemical inputs
Based on the pesticide and fertilizer costs reported by the farms, three indicators of the intensity of use were defined. The first two quantify the costs relating to a specific input: pesticide or fertilizer. The third refers to the total cost of inputs per hectare. This distinction provides a new contribution to the existing literature, which primarily considers inputs an aggregate value.
(2) Structure of the vineyard
The characteristics linked to the farm and the farmer facilitate the measurement of individual particularities at the moment when the decision to use inputs is made. The total area of the farm expressed in hectares is an essential indicator of the economic dimension.
Productive orientation allows us to distinguish between farms specializing in “designated origin wine” and other vineyards. This distinction reflects the level of specialization of vineyards in quality wines: If this level represents more than two-thirds of their standard gross margin,Footnote 3 a farm is said to be specialized in quality wine production. The differentiation is fundamental as the requirements linked to these origins are different. Moreover, wine quality can be considered a proxy for the output price, which is not provided by our database.
The education level of the farm manager is also included in the analysis, with three levels of study defined “higher” education, “secondary” education, and “other” (primary education and no general education).
(3) Financial situation of the vineyard
We have retained several indicators including turnover, which reflects the financial size of the farm, and earnings before tax, which measures the difference between revenue and costs.
The financial risk linked to wine production is perceived through indebtedness, measured by calculating financial leverage.
 $$Financial\; Leverage = \displaystyle{{Total\; Debt} \over {Total\; Equity}}$$
We also consider yield and, more specifically, its variability from one year to the next (OECD, 2000). High yield volatility could encourage farmers to target stability through the increased use of inputs.
 $$Yield\; Volatility = \; \displaystyle{{{\raise0.7ex\hbox{${Production\; (t)}$} \!\mathord{\left/ {\vphantom {{Production\; (t)} {Cultivated\; Area\; (t)}}}\right.\kern-\nulldelimiterspace} \!\lower0.7ex\hbox{${Cultivated\; Area\; (t)}$}}} \over {{\raise0.7ex\hbox{${Production\; (t - 1)}$} \!\mathord{\left/ {\vphantom {{Production\; (t - 1)} {Cultivated\; Area\; (t - 1)}}}\right.\kern-\nulldelimiterspace} \!\lower0.7ex\hbox{${Cultivated\; Area\; (t - 1)}$}}}}$$
Each farm's performance is measured with respect to its economic profitability, which reflects the farm's capacity to generate earnings using its capital. This performance can be improved through the use of fertilizers or protected by pesticides.
 $${Return\; On\; Capital\; Employed = \displaystyle{{Net\; Operating\; Profit\; After\; Tax} \over {Capital\; Employed}}$$
(4) Crop insurance strategy
The FADN database provides information about the amount of crop insurance premiums and compensations received by a farmer for a given year. The original values are expressed in euros per ha.
(5) Climatic conditions
The choice of meteorological variables is primarily dictated by the conditions in which diseases affecting the vines can develop. Excessively high temperature deviations are not favorable to the development of epidemics whereas a regular accumulation of precipitation is much more conducive to their spread.
Similarly, it is important to assess the conditions of input efficiency. Excessively low temperatures make the dormant vegetation relatively unreceptive to pesticides (Houmy, Reference Houmy1994). Conversely, hot weather leads to the evaporation of inputs, which results in low efficiency levels of the treatment. Inputs are also washed out by heavy rain to seep into the soil.
We observe a high level of variability in temperature deviations (Figure 2). Not all farms face the same climatic conditions and do not adjust their use of inputs in the same way, all other things being equal. The indicators and means of measuring them must be chosen correctly, as shown by the differences between the average temperatures in France. Consequently, we take into account for each year and each farm both the average temperature and the deviation of this average compared to the historical mean (computed over the five previous years).
(6) Control variables
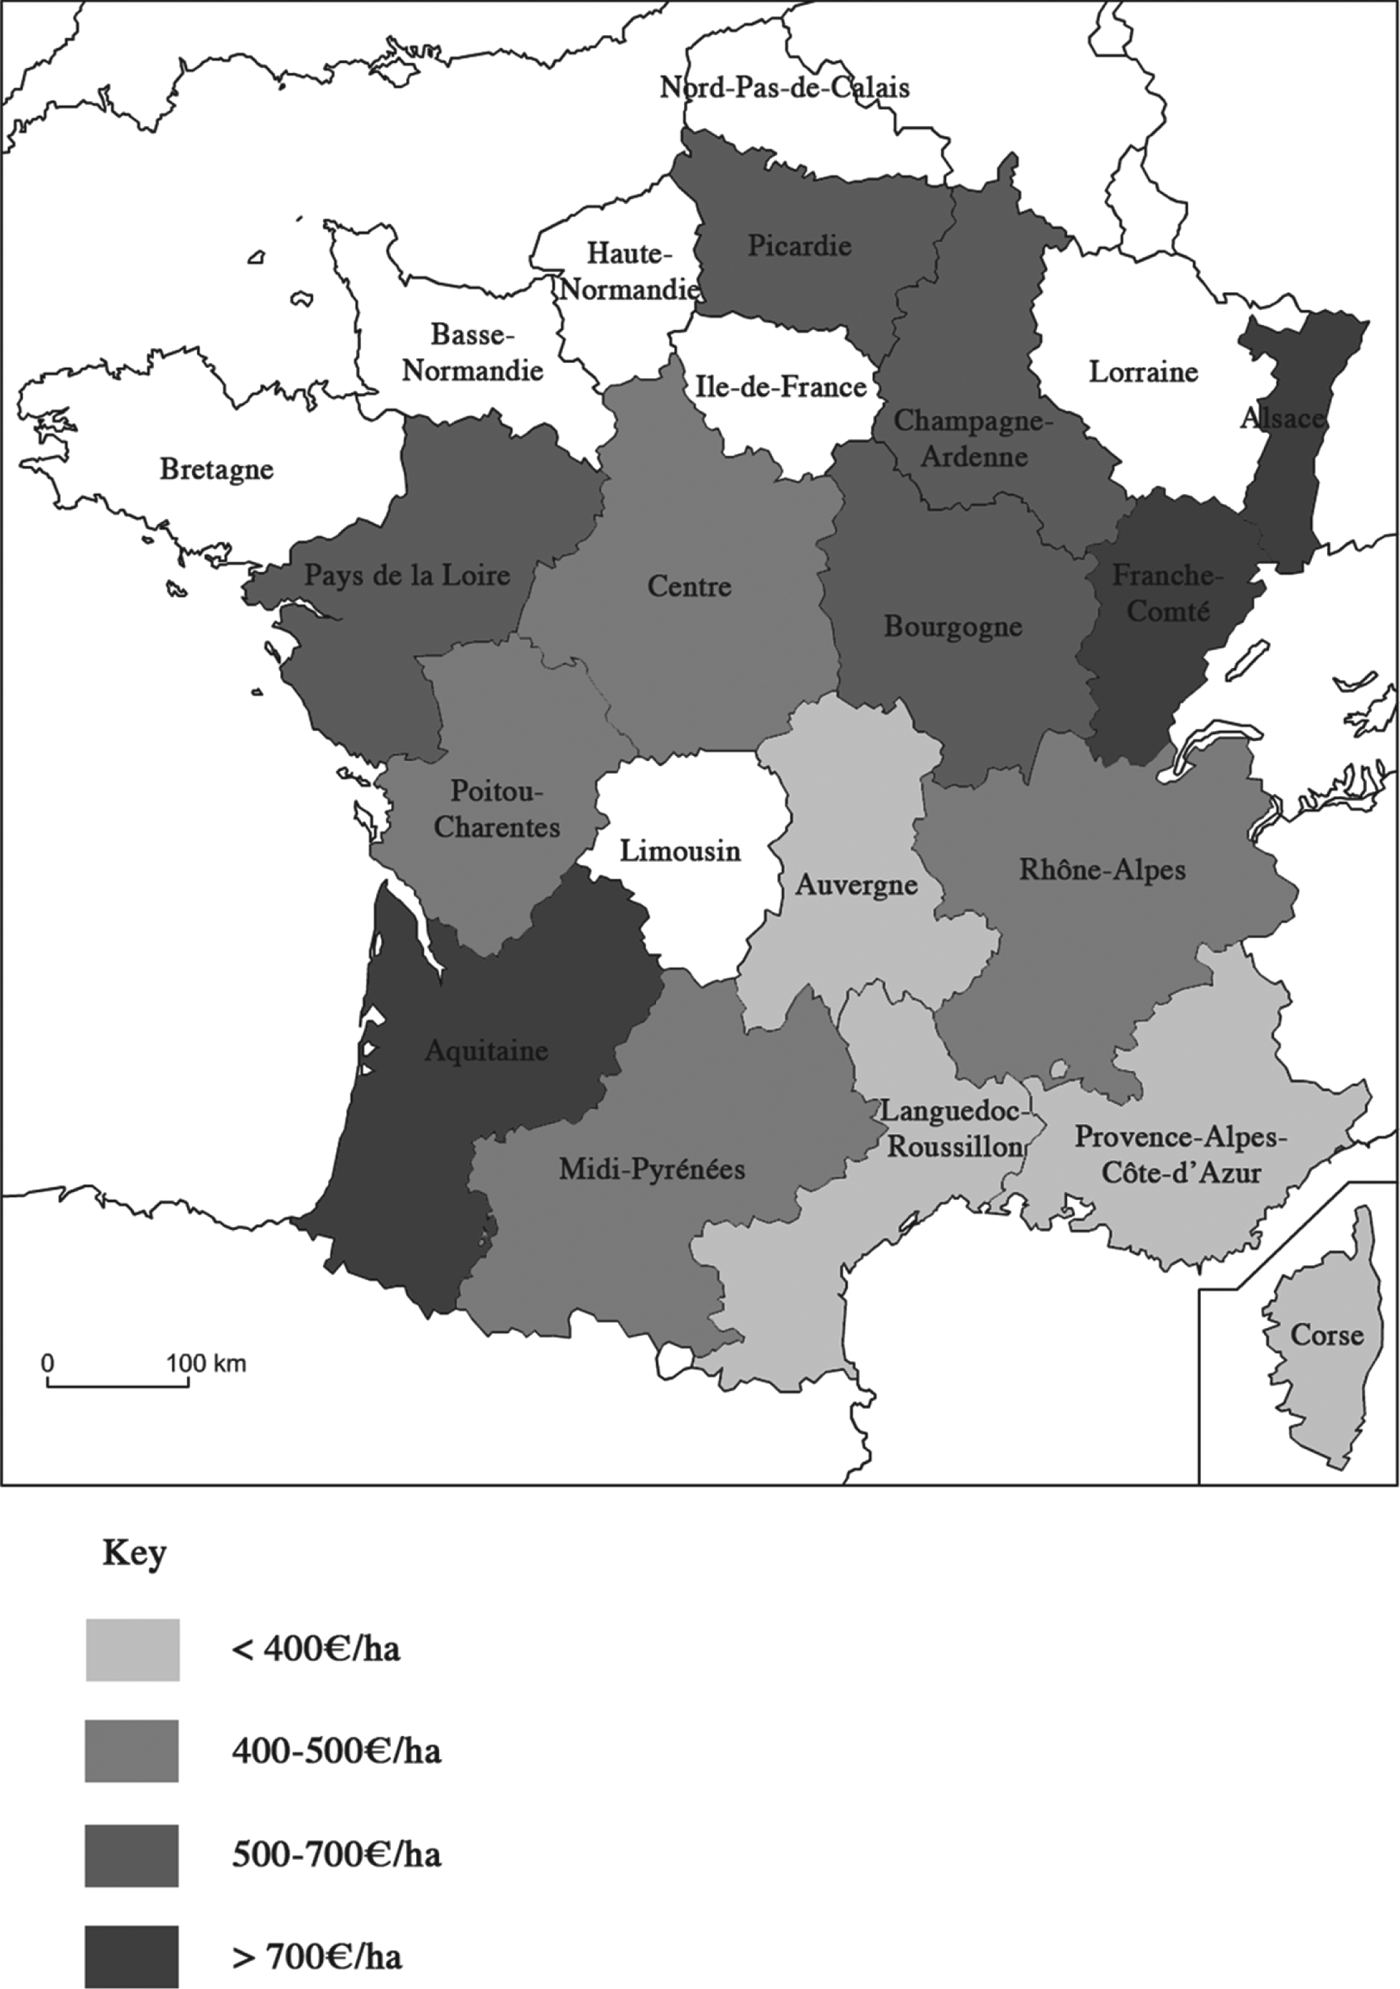
In order to take into consideration the different intensities of input use per geographic location, we consider the different regions for which data exists in the FADN database. Since all regions are not sufficiently well represented, we define four zones according to inputs use (Figure 3). Hence, the regions of Aquitaine, Burgundy, and Champagne-Ardenne, famous for their grands crus, are considered together because they are where inputs are most intensively used.
Intensity of Chemical Input Use Per Hectare and Per Region
(7) Standardization of variables
To neutralize size effects, we calculate the total cost of chemical inputs in relation to the area farmed. Similarly, the structural and financial variables (not including ratios) are standardized per area and turnover, respectively. We also control for the effects of endogeneity by lagging the financial variables and certain meteorological variables.
C. Models
The use of a balanced panel allows us to conduct an econometric analysis in order to identify the determinants of the intensity of input use. It also enables us to quantify the progression of the main structural and financial indicators according to the changing practices of input use.
The econometric model considered takes into account the individual dimension (i) and the temporal dimension (t). Thus:
 $$y_{it} = \beta + \mathop \sum \limits_{\,j = 1} \gamma _j x_{ijt} + \mathop \sum \limits_{k = 1} \varphi _k w_{ikt - 1} + \mathop \sum \limits_{m = 1} \alpha _m z_{imt - 1} + \mathop \sum \limits_{\,f = 1} \lambda _f h_{ift} + \varsigma _i r_i + \varepsilon _{it} $$
where:
- y it is the cost/ha in pesticides, fertilizers, and chemical inputs
- β is the constant
- γ j are the coefficients associated with j structural variables—expressed as x ijt
- φ k are the coefficients associated with k lagged financial variables—expressed as w ikt−1
- α m are the coefficients associated with m lagged meteorological data—expressed as z imt−1
- λ f are the coefficients associated with f meteorological data—expressed as h ift
- ζ i is the coefficient associated with regional practices—expressed as r i
- ε it are the error terms assumed to be iid
We compute three complementary models in order to understand the specificity of each kind of input. Model 1 relates to the costs of pesticides per hectare; model 2 relates to the costs of fertilizer per ha; and model 3 relates to the total costs of inputs per ha.
Within the framework of the panel data, we must define whether our model corresponds to a fixed-effects model or a random-effects model (Greene, Reference Greene2006). The data at our disposal do not cover all French vineyards. According to Nerlove (Reference Nerlove2003) and Trognon (Reference Trognon2003), this nonexhaustiveness justifies the use of a random-effects model. Two other justifications support this choice: first, the high number of observations and, second, the existence of regional effects of user practices. Heteroskedasticity and autocorrelation tests were carried out to confirm the quality of our estimators (Wooldridge, Reference Wooldridge2002). Model 1 was corrected for the autocorrelation observed between the error terms.
Another series of models was created for 2007 to confirm the stability of the panel results. The lagged data are based on data for 2006. The explanatory variable for models 4, 5, and 6 is the cost of pesticides, fertilizers, and chemical inputs per ha, respectively. In these models, the tests relating to the error terms were also carried out.
IV. Results
A. Descriptive Statistics
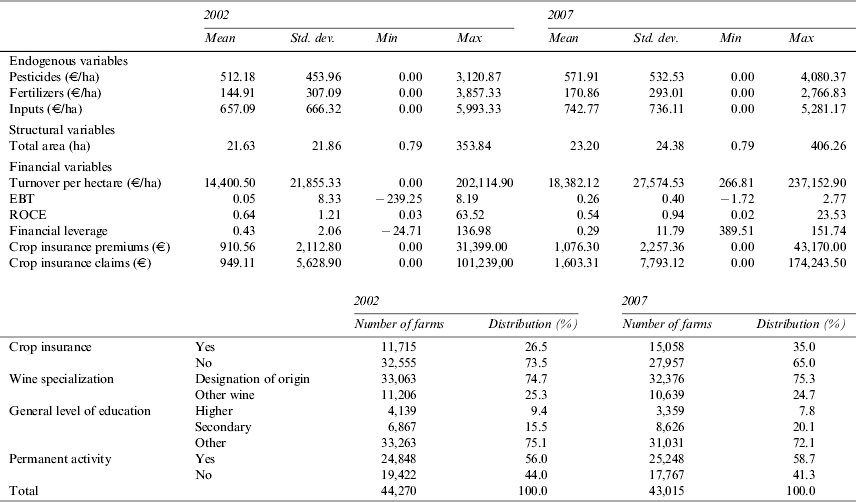
Table 2 describes our sample for the period considered on the basis of extrapolated data at the national level in France.
Descriptive Statistics of the Main Variables for 2002 to 2007
Source: Authors' calculations based on FADN—Agreste data from 2002 to 2007, weighted values.
One should note that both input costs (pesticides and fertilizers) and crop insurance increased slightly from 2002 to 2007. Moreover, we notice that insurance premiums are significantly more expensive than the sum of chemical inputs (about 40% more). We also observe a very strong rise in insurance claims over time. Insurance indemnities greatly exceed premiums for winegrowers in 2007.
B. Regressions on the Demand for Chemical Inputs
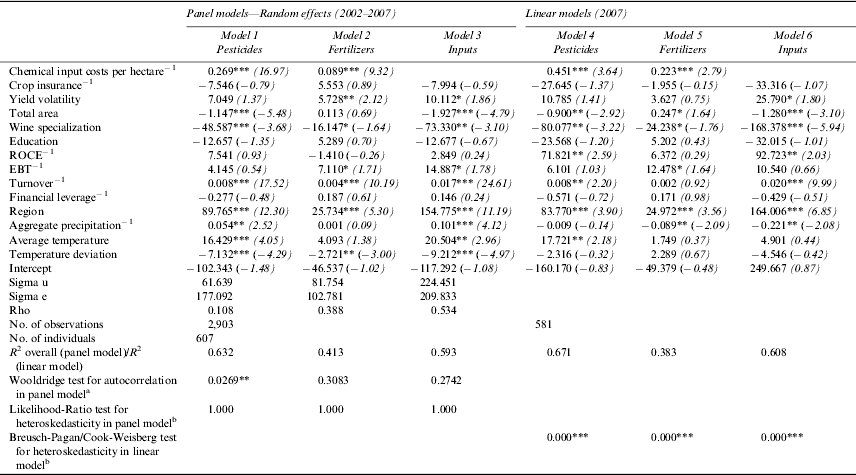
We estimate the six regression models described in section III.C. The results are presented in Table 3.
Estimated Results of the Random Effects Panel Data and of the Linear Models
Source: Authors' calculations based on FADN—Agreste data from 2002 to 2007 and meteorological data.
Notes: * p<10%; ** p<5%; *** p<1%, z and t statistics are indicated in parentheses for panel and linear models respectively. −1 denotes a lagged variable.
a. The null hypothesis tested is: no first-order autocorrelation. b. The null hypothesis is: homoscedasticity.
First and foremost, the estimations highlight the benefits of differentiating the types of chemical input as certain significant variables differ from one model to another. Pesticides correspond to products that protect vines, whereas fertilizers correspond to products serving to encourage the growth of the plant. The different uses made of these products are underpinned by a particular rationale and specific determinants. One benefit of our modeling process is that it clearly highlights the advantages of this differentiation. The area farmed mainly affects the use of pesticides. The larger the farm, the less pesticide the farmer uses per ha. This result probably reflects pesticide targeting on certain plots or grape varieties. Inversely, higher yield volatility gives rise to a more intensive use of fertilizers per ha but has no impact on the use of pesticides. The application of fertilizer is therefore determined by a desire to guarantee a minimum yield in all circumstances. Finally, in meteorological terms, we observe that abundant rainfall during a previous period is reflected by a more intensive use of pesticides per ha because the conditions for the development of diseases are more favorable; nevertheless, pesticides have a negative impact on the use of fertilizers for 2007.
Most determinants of the use of inputs remain common to both forms, no matter whether we examine protective products or growth-stimulating products. Farms that specialize in quality wine production correspond to farms that use fewer inputs regardless of the input concerned. Conversely, the greater the turnover (standardized to the area farmed) in the previous period, the more use winegrowers make of inputs per ha in the current period. The model indicates that meteorological factors and, more specifically, the average temperature and temperature deviations, have an effect on the use of inputs. The higher the temperature, the more farmers make intensive use of inputs. Conversely, the greater the temperature deviations, the less farmers make intensive use of inputs. Inputs are therefore applied primarily when the meteorological conditions are conducive to their efficacy.
We also observe that certain factors have no impact on input use. This is the case for the education level of farm managers, earnings before tax (EBT), and the financial leverage observed during the previous period, none of which demonstrates significant coefficients. More surprising is the nonsignificance of crop insurance on input practices. Being insured does not imply any change in consumption of pesticides and fertilizers.
Vineyards differ from other farms in the longevity of the vines. This durability is shown in our analysis through the consistency of past and present use of inputs of any kind. A farm that uses more inputs in the previous period also uses more in the current period. We observe consistent use of inputs, which would appear to be indicative of a permanent production pattern. In the same way, we confirm the existence of a geographic location effect. Certain regions tend to use more inputs per ha than other regions over a number of years.
The models created for a balanced panel or for 2007 alone reflect a relative stability of results obtained. We confirm the significance and direction observed for the majority of the factors considered in relation to the cost of phytosanitary products per ha between models 1 and 4: stability of use between two periods, differential practices at the regional level, specific productive orientations, a level of turnover standardized per area farmed, and the importance of meteorological data. Regarding the cost of fertilizers per ha, we observe that the factors relating to geographic location, previous use of fertilizer per ha, and EBT are significant in models 2 and 5.
Generally speaking, the adjustment quality of the models is satisfactory, in particular for pesticides and total inputs (models 1, 3, 4, and 6). It appears that the adjustment quality of models 2 and 5 relating to the use of fertilizer per ha is not as high. Other factors not incorporated in our analysis have an impact on the intensity of fertilizer use, although not necessarily or to a lesser extent, on the use of pesticides and of inputs in general.
C. Dynamics of the Demand for Chemical Inputs
In addition to identifying the factors determining the intensity of input use, the temporal dimension of our sample enables us to characterize the farms in structural and financial terms according to their changing use of inputs.
In 2007, the joint use of pesticides and fertilizers per ha was correlated at a level of 50%. The dynamics of progression of their respective use between 2002 and 2007 was correlated at a level of 30%. Consequently, the changes observed in the use of these two inputs are different, thereby consolidating our strategy of differentiating these two indicators.
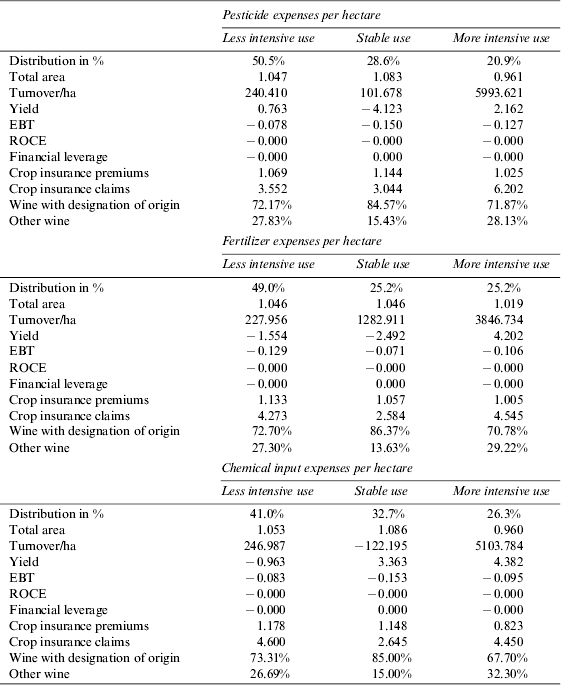
Three dynamics were defined on the basis of the change in the use of pesticides, fertilizers, and inputs: stability of behavior, lower use of inputs or, on the contrary, more intensive use of inputs. The thresholds demarcating each of these dynamics differ according to the distribution of the change in consumption of the input considered. With regard to the costs of pesticides or inputs, farms with a coefficient of change between −100 and 100 correspond to those demonstrating the most stable behavior. With regard to the costs of fertilizers, the thresholds adopted in light of the distribution of the coefficient are −50 and 50. The results of the analysis are presented in Table 4.
Structural and Financial Characterizations of Vineyards, Differentiated According to the Evolution of their Practices in Terms of Input Use Per Hectare Between 2002 and 2007
Source: Authors' calculations based on FADN—Agreste data from 2002 to 2007.
One of the objectives of applying inputs is to increase yields. This is confirmed in the dynamic analysis. Farms that make more intensive use of inputs enjoyed the largest increase in yields. This increase reflects an increase in production, as the area farmed remains stable irrespective of the change in practices considered. The increase in production goes hand in hand with an increase in turnover. Inversely, for farms that reduce their consumption of inputs, the observed fall in production is coupled with an increase in turnover, reflecting an improved valuation of production. Finally, the production of wine with designation of origin is associated with a greater stability in chemical input consumption compared to other types of wine.
The dynamic analysis provides innovative elements concerning the link between insurance and inputs. While insurance is often viewed as an alternative to the use of inputs, our analysis highlights the fact that winegrowers who increased their level of insurance coverage also reduced their consumption of inputs. At the same time, they received more compensation, reflecting a moral hazard effect. In the case of farmers who did not change their crop insurance strategy, their demand for chemical inputs remained unchanged. Finally, it should be noted that farmers who took out less insurance coverage or increased their insurance consumption by less than the other groups made more intensive use of fertilizers or pesticides. Correspondingly, they also demonstrated the largest increase in insurance claims. This would suggest other evidence of moral hazard in that these farmers take more risks by using more inputs. Such results are in line with observations made by Horowitz and Lichtenberg (Reference Horowitz and Lichtenberg1993).
Generally speaking, all farms experienced a fall in the economic profitability of their activity, a clear indication of the crisis affecting the wine grape–growing sector in France in recent years. This loss is felt more severely by farms that use relatively more inputs, perhaps due to the cost of inputs and the associated risks. Nevertheless, the change in financial leverage and EBT is not significant, reflecting stability with the results of the regressions.
V. Conclusion
In our article, we have endeavored to determine the factors that encourage professional French winegrowers to use chemical inputs in order to protect or increase the yield of their crops. First and foremost, the results show that differentiating the inputs is a key element to be taken into consideration. Not all inputs offer the same utility: Whether to protect or stimulate the growth of a plant, each input satisfies a distinct rationale that must be taken into account. The results obtained remain globally stable between the panel data models estimated for the period from 2002 to 2007 and the models developed for 2007 alone.
Among the variables positively affecting the use of inputs, farm size plays an incontestable role. Input-intensive farms are characterized by a small area (H1a) combined with a high turnover per ha (H2a). A salient result is that the application of fertilizers and pesticides is driven mostly by unfavorable climatic conditions (H4). Risk, measured by yield volatility, is also an essential criterion in determining the application of inputs, particularly with regard to fertilizers (H2b). All of these results indicate an adaptive behavior on the part of farmers.
Nevertheless, the other risk factor–indebtedness–is not significant (H2b). This is also true of economic profitability and earnings before tax (H2a). Most of the financial variables are irrelevant, reflecting the predominance of structural variables in the decision to treat the vines. Personal criteria, such as education level, do not appear to exercise any major impact (H1b).
The last set of results has major implications in terms of public policy. We attempted to review the interaction between crop insurance and chemical inputs, starting with the principle that the farmer must decide to take out insurance before applying the fertilizers or pesticides. The interest in this interaction is considerable because insurance can serve to compensate for the scheduled diminution of chemical inputs. The results from the regressions show that the decision to take out insurance does not in and of itself influence the use of chemical inputs. However, the dynamic analysis demonstrates a substitutability effect over time as farmers who reduce their consumption of inputs increase their demand for crop insurance significantly (H3).
Crop insurance claims paid to these farmers increase more quickly than the average. This result clearly denotes a moral hazard effect, which may jeopardize the insurability of crops as restrictions on the use of inputs become more severe. Moreover, winegrowers who increase their consumption of pesticides also submit more insurance claims, probably because excessive use of an input becomes a new risk factor.
The phenomenon of asymmetric information means that the results observed must be refined, and the perspectives revealed by our research are numerous given the paucity of studies exploring the demand for inputs in the wine grape–growing sector. It would be interesting to study in greater detail the dynamic behavior of winegrowers according to their consumption of inputs. Types of vineyard by region or variety would provide results enabling the reduction of inputs and the implementation of alternative and precisely planned solutions.