INTRODUCTION
All marine mammals occurring in Irish waters are protected by a range of legislative instruments, which include the Wildlife Act (1976: http://www.irishstatutebook.ie/1976/en/act/pub/0039/index.html) and the EU Habitats Directive (1992: EEC, 1992). All cetaceans are listed under Annex IV of the Habitats Directive (species of community interest in need of strict protection). The harbour porpoise (Phocoena phocoena) and bottlenose dolphin (Tursiops truncatus), as well as the Atlantic grey (Halichoerus grypus) and harbour seal (Phoca vitulina), are additionally listed under Annex II (species of community interest whose conservation requires the designation of Special Areas of Conservation (SACs)). The requirement that populations of these species be maintained at ‘favourable conservation status' (EEC, 1992) necessitates appropriate monitoring programmes. However, sighting surveys for marine mammals often suffer from seasonal and spatial biases in observer coverage. Due to weather constraints, most surveys are conducted during the summer months, and regular effort-corrected watches (as opposed to the collection of incidental sightings) are more difficult to achieve in remote areas due to logistical constraints.
To date, 24 cetacean species have been known to occur in Irish waters, including both sightings and strandings data (Berrow & Rogan, Reference Berrow and Rogan1997; Berrow et al., Reference Berrow, Whooley and Ferriss2002; O'Brien et al., Reference O'Brien, Berrow, McGrath and Evans2009a). The Irish Whale and Dolphin Group (IWDG) run an observer scheme with volunteers conducting effort-related, land-based watches from several locations (cliffs and headlands) around the coast. However, effort is biased towards the more populated and accessible areas, i.e. mainly around the south and south-east coasts, with less coverage in the west, and particularly the north-west of the country (http://www.iwdg.ie/iscope/sightings).
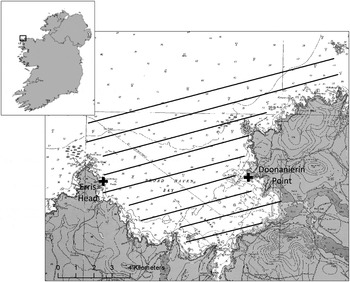
Historically, the waters off north-west Ireland were recognized as an important cetacean habitat, probably due to the relative proximity of the continental shelf edge. Two Norwegian-owned whaling stations were operated in north-west County Mayo between 1908 and 1923; one was located on the Mullet Peninsula and one on the island of South Inishkea, ~20 and 25 km south of our study area in Broadhaven Bay, respectively (Figure 1). These stations processed mainly fin whales (Balaenoptera physalus; ~66% of the total catch), which were caught within 95–120 km of the Mullet Peninsula mostly during summer months (Fairley, Reference Fairley1981).
Study area of Broadhaven Bay and surrounding area, indicating the two sites for land-based observations (crosses) and transect lines.

The remoteness and harsh weather conditions of north-west Mayo (with direct exposure to the high swell and sea state of the North Atlantic) have resulted in a relative scarcity of dedicated cetacean surveys in the region. Vessel-based surveys by Evans (Reference Evans1981), Pollock et al. (Reference Pollock, Reid, Webb and Tasker1997), Berrow & Petch (Reference Berrow and Petch1998), Gordon et al. (Reference Gordon, Berrow, Rogan and Fennelly1999), Ó Cadhla et al. (Reference Ó Cadhla, Mackey, Aguilar de Soto, Rogan and Connolly2004), Hammond (Reference Hammond2006) and Hammond et al. (Reference Hammond, Macleod, Gillespie, Swift, Winship, Burt, Cañadas, Vázquez, Ridoux, Certain, Van Canneyt, Lens, Santos, Uriarte, Hernandez and Castro2009) have provided snap-shots of cetacean presence in the wider area. Between the Mayo coast and the continental shelf edge, cetacean sightings have included: minke whale (Balaenoptera acutorostrata), northern bottlenose whale (Hyperoodon ampullatus), common dolphin (Delphinus delphis), bottlenose dolphin (Tursiops truncatus) and harbour porpoise (Phocoena phocoena), while Atlantic white-sided dolphin (Lagenorhynchus acutus) and long-finned pilot whale (Globicephala melas) were found in the deeper waters over and beyond the shelf edge. By contrast, the larger baleen whales and sperm whales (Physeter macrocephalus) were not recorded from continental shelf waters off Mayo. In the context of the wider area, the SCANS-II survey (Hammond, Reference Hammond2006), conducted during July 2005, suggested that by comparison to the south coast of Ireland, Mayo was a less significant area for harbour porpoise and minke whale, while common dolphins appeared to favour the area off the mid-west coast, i.e. counties Galway and Clare. However, due to the restricted temporal coverage of all these surveys, most of which were not designed to cover in detail the areas close inshore, it has not been possible to assess seasonal patterns in the occurrence of different species, nor differences in their habitat use at a finer scale.
Broadhaven Bay (Figure 1) was designated as a candidate Special Area of Conservation (cSAC) in 2000 due to: (i) the presence of four key marine/coastal habitat types listed under Annex I of the EU Habitats Directive (EEC, 1992): Atlantic salt marsh, tidal mud and sand flats, reefs and large shallow bay; (ii) the presence of a number of unusual marine communities and species; and (iii) the seasonal presence of wintering wildfowl, and breeding terns in summer (Sterna spp.). However, no marine mammal species is currently listed as a feature of the cSAC.
Following plans for the construction of an underwater gas pipeline from the Corrib gas field 65 km offshore to its landfall site near Glengad in Broadhaven Bay, a marine mammal monitoring programme was initiated in the area in 2001, given the limited background knowledge of marine mammal occurrence within the bay and adjacent waters. This programme has continued in each year of construction activity, i.e. during 2002, 2005 and continuously (including winter months) since 2008 (Ó Cadhla et al., Reference Ó Cadhla, Englund, Philpott, Mackey and Simon2003; Englund et al., Reference Englund, Coleman and Collins2006; Coleman et al., Reference Coleman, Philpott, O'Donovan, Denniston, Walshe, Haberlin and Englund2009; Visser et al., Reference Visser, Coleman, Denniston, O'Donovan, Walshe, Ponzo and Cronin2010; Anderwald et al., Reference Anderwald, Coleman, O'Donovan, Pinfield, Walshe, Haberlin, Jessopp and Cronin2011, Reference Anderwald, Brandecker, Haberlin, Coleman, Collins, O'Donovan, Pinfield and Cronin2012). Construction activities within the bay consisted of acoustic and remotely-operated vehicle surveys, dredging, trenching, pipe-laying and rock-placement over the pipeline, and were conducted between May and October. However, construction works were not found to have any significant (short-term) effects on the temporal or spatial occurrence of the most frequently recorded marine mammal species within the study area (Anderwald et al., Reference Anderwald, Brandecker, Haberlin, Coleman, Collins, O'Donovan, Pinfield and Cronin2012), so that any seasonal or spatial differences in occurrence and habitat use investigated here can be assumed to represent natural patterns. Due to its focus on a relatively small area, this dataset provides extensive temporal coverage, thus ideally complementing previous vessel-based surveys which covered a larger area but were restricted to short periods of time, mostly during the summer months.
Based on this multi-year dataset of marine mammal occurrence in Broadhaven Bay, the aims of the analysis presented here were to: (a) model seasonal patterns in the presence of the most frequently recorded species while correcting for effort; and (b) compare the spatial habitat use between these species with respect to environmental variables.
MATERIALS AND METHODS
Study area
The study area is a relatively shallow open bay (8.6 km wide at the entrance) with a northward aspect and depths less than 50 m. Tidal fronts occur primarily around Erris Head at the western entrance to the bay (Figure 1). The nearby Inishkea Islands are part of one of the most important breeding areas for grey seals (Halichoerus grypus) in Ireland, and a smaller colony exists at Benwee Head, ~6 km from the eastern entrance to Broadhaven Bay (Kiely & Myers, Reference Kiely and Myers1998; Ó Cadhla & Strong, Reference Ó Cadhla and Strong2003; Cronin et al., Reference Cronin, Duck and Ó Cadhla2007a; Ó Cadhla et al., Reference Ó Cadhla, Strong, O'Keeffe, Coleman, Cronin, Duck, Murray, Dower, Nairn, Murphy, Smiddy, Saich, Lyons and Hiby2008). Haul-out sites for harbour seals (Phoca vitulina vitulina) are also found within Broadhaven Bay and nearby Blacksod Bay (Cronin et al., Reference Cronin, Duck, Ó Cadhla, Nairn, Strong and O'Keeffe2007b).
Fieldwork
Fieldwork was carried out during October and November 2001 (these data were excluded from the analysis due to low coverage), from March to September 2002, June to September 2005, and continuously from May 2008 until November 2011. Land-based observers were positioned at two sites: Gubastuckaun at Erris Head (hereafter referred to as Erris Head; 62 m above mean sea level (MSL)) at the western entrance to the bay, and Doonanierin Point (54 m above MSL) on its eastern shoreline (Figure 1), which between them provide a view over the entire study area of Broadhaven Bay and extending up to ~8 km offshore. Visual survey effort was conducted by one to two observers per site during all daylight hours in favourable weather conditions (sea state < Beaufort Force 4; swell height ≤2 m; visibility ≥7 km). The study area was scanned systematically with handheld or monopod-mounted binoculars (7 × 50 Steiner; 8 × 42 Nikon; covering the entire visible sea area) and a telescope (Kowa) equipped with a 32 × wide-angle eye-piece (covering mainly areas ≥2 km from the observation point). Scans lasted one hour ± 15 minutes (allowing for variation in time needed to record sightings and determine positions of animals using a digital theodolite (Sokkia DT500)) and included one thorough scan of the search area with binoculars and telescope. Each scan was followed by a one hour break to allow observers to rest their eyes. Environmental conditions (sea state, swell height, visibility, precipitation and the extent of glare) were recorded at the start of each scan. All marine mammal, basking shark (Cetorhinus maximus), sunfish (Mola mola), turtle and otter (Lutra lutra) sightings were recorded, noting theodolite angles for positional calculation, group size and composition, direction of travel, behaviour, and whether the record constituted a re-sighting (from the same platform) or duplicate (repeat sighting of animals already seen from the other observation site). Where feasible, animals were tracked by one observer for as long as possible, noting their positions and behaviour every 5 to 10 minutes. Animals sighted during a break between scans were recorded as opportunistic sightings.
Line-transects were carried out at a speed of ~10 knots on-board a 7.5 m rigid inflatable boat (observer height of 2 m) in 2002 and a 12 m sea-angling boat (observer height of ~4 m) in more recent years. Boat-based surveys were conducted only during late spring and summer months in sea states ≤ Beaufort Force 3 and at swell heights of ≤1.5 m. Two observers scanned a 90° angle from the bow to the port and starboard sides, respectively, recording all sightings of marine mammals, basking sharks, sunfish or turtles along with their GPS positions, group size and composition, direction of travel and behaviour. Line-transect surveys were used to provide additional independent information on the distribution of the smaller, more elusive marine mammal species (harbour porpoise, grey and harbour seals) since their detection probability was likely to decrease rapidly with increasing distance from the cliff-based observation points at the spatial scales (~8 km) examined here.
Seasonal occurrence
Due to the low frequency of vessel-based line-transect surveys by comparison to land-based observations, and in order to ensure comparability between years and months, all analyses of temporal trends in species occurrence were based on effort-related observations from the cliffs only.
From a land-based observation platform, it is problematic to assess whether multiple sightings of the same species within a day represent members of the same group of individuals. The seasonal occurrence of four of the most frequently recorded species (minke whale, bottlenose and common dolphins, and grey seal) was therefore expressed as presence/absence per survey day, which was modelled as a function of several explanatory variables in order to correct for potential biases in observer effort and sighting conditions. Due to the difficulty in distinguishing harbour seals from juvenile grey seals at a distance, harbour seals were excluded from further analysis and only positively identified grey seal sightings included. A comparison with acoustic data collected simultaneously as part of the monitoring programme suggested that harbour porpoises were by far under-recorded during cliff-based observations due to the species' small size and inconspicuous surface behaviour (Anderwald et al., Reference Anderwald, Brandecker, Haberlin, Coleman, Collins, O'Donovan, Pinfield and Cronin2012). Harbour porpoises were therefore also excluded from further analysis.
A generalized additive model (GAM: Hastie & Tibshirani, Reference Hastie and Tibshirani1990) with a binomial error distribution and logit link function was constructed for presence/absence of minke whale, bottlenose dolphin, common dolphin and grey seal with the following explanatory variables: Julian day (cyclic smoother); average sea state between the two observation sites per day (smoother); daily observer effort (in hours) for each of the two observation sites (smoother) including an interaction term; and year (factor: with 2002 used as the reference level). The average sea state during scans per day was incorporated in the models as a correction parameter for the detectability of animals (e.g. Buckland et al., Reference Buckland, Anderson, Burnham and Laake1993; Hammond et al., Reference Hammond, Berggren, Benke, Borchers, Collet, Heide-Jørgensen, Heimlich, Hiby, Leopold and Øien2002) and the number of hours watched per site as a measure for observer effort. Thin plate regression splines, implemented in the mgcv library (Wood, Reference Wood2006) in the freeware R (R Development Core Team, 2006), were used as penalized regression smoothers for all models. The amount of smoothing was estimated using generalized cross-validation. However, the maximum degrees of freedom used for a single parameter was set to 4 in order to avoid over-fitting. Model selection was performed in a stepwise backward procedure by minimizing the unbiased risk estimator (UBRE) score (Wood, Reference Wood2006). The UBRE score is the mgcv equivalent to Akaike's information criterion (AIC), which measures the goodness of fit of the model, penalized by the number of parameters included. Non-significant parameters were retained in the model if they contributed to minimizing the UBRE score, but only significant parameters were plotted.
Differences in spatial distribution between species
Theodolite angles to animals recorded in the field were used to derive Irish National Grid co-ordinates (eastings and northings) via trigonometric calculations. These took the following into account: curvature of the earth; height of cliff observation sites above sea level; tidal height at the time of each sighting record; eye height of the theodolite for each record; and bearing from due east of the theodolite ‘zero’ target, relative to the cliff site locations (e.g. Lerczak & Hobbs, Reference Lerczak and Hobbs1998). The co-ordinates were plotted in ArcGIS (Version 10) using the relevant scanned and geo-referenced section of the Admirality chart 2703 ‘Broad Haven Bay and Approaches' as a background.
Differences in spatial habitat use between the four most frequently recorded marine mammal species (i.e. minke whale, bottlenose and common dolphins, and grey seal, but excluding harbour seal and harbour porpoise) were investigated using a classification tree, based on the parameters depth and distance from the tidally active area at Erris Head. The latter parameter was included because Erris Head appeared to be particularly important for marine mammals in the area, consistently showing high species diversity and high sighting rates (Anderwald et al., Reference Anderwald, Coleman, O'Donovan, Pinfield, Walshe, Haberlin, Jessopp and Cronin2011, Reference Anderwald, Brandecker, Haberlin, Coleman, Collins, O'Donovan, Pinfield and Cronin2012). Bathymetry data were digitized from the Admirality chart 2703. A triangular integrated network was created and subsequently converted into a raster using the ArcView extensions 3D-Analyst and Spatial Analyst 3.3, respectively. Sightings positions were then linked with the nearest available depth data point via the spatial join function in ArcView 3.3.
In order to reduce the risk of violating independence between sightings positions, any tracking positions or positions of possible re-sightings of the same animals taken within one hour were deleted. A classification tree was then constructed based on the remaining sightings positions, with species as the response variable, and depth and distance from Erris Head as explanatory variables. Classification trees split the data repeatedly into two homogeneous groups, so that between-group variation is as large and within-group variation as small as possible (e.g. Zuur et al., Reference Zuur, Ieno and Smith2007). The optimal grouping is calculated automatically by the software. The optimal tree size (i.e. number of splits necessary) is then calculated as a trade-off between the goodness of fit and the complexity of the tree (i.e. number of branches), similar to AIC (Burnham & Anderson, Reference Burnham and Anderson2002). Using the rpart-library in R, the optimal tree size was selected by cross-validation and application of the one standard deviation rule (Zuur et al., Reference Zuur, Ieno and Smith2007).
RESULTS
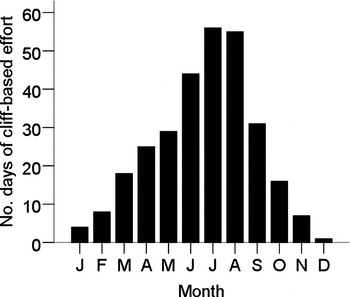
Total cliff-based observer effort amounted to 292 days for the years 2002, 2005 and 2008–2011, with 1433 scans of one hour ± 15 minutes duration. 755 of these scans were conducted from Erris Head (amounting to 795 hours) and 678 from Doonanierin Point (705 hours) in good viewing conditions. Survey effort was highest during the months of July and August (Figure 2).
Monthly distribution of cliff-based observer effort (N = 292 days) over the years 2002, 2005 and 2008–2011.

Line-transect surveys were carried out on 26 days in total between April and October (nine transects in 2002, two in 2008, six in 2009 and 2010, and three in 2011).
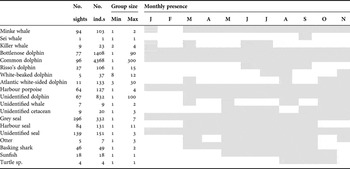
The grey seal was the most frequently observed species overall, while common dolphins accounted for the highest number of individuals recorded over the study period (Table 1).
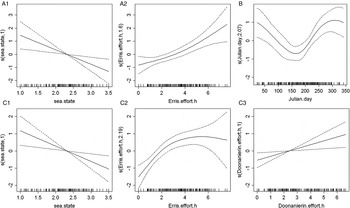
Smoothing curves for generalized additive models of significant parameters in final models for (A) minke whale, (B) common dolphin, and (C) grey seal presence/absence. Broken lines represent 2-standard error ranges around the main effects. The degrees of freedom for each smoothing curve are indicated on the y-axis. Vertical dashes on the x-axis represent the distribution of the explanatory variable.

Summary of all sightings in the Broadhaven Bay study area, including cliff-based effort-related, opportunistic and vessel-based sightings. Grey-shaded fields indicate the presence of a species during that month. Survey effort during December was very low (see Figure 1), and this month was therefore omitted.

Min, minimum; Max, maximum.
Seasonal occurrence
Minke whale, bottlenose and common dolphins, harbour porpoise and grey seal were recorded within Broadhaven Bay throughout the year, while sightings of Risso's dolphins were confined to summer and early autumn (Table 1). Harbour seals were positively identified only between March and September, but due to the difficulty in distinguishing them from grey seals at a distance, some unidentified seals may also have been attributable to this species during winter.
Apart from marine mammals, basking sharks, sunfish, turtles (most likely leatherback turtle Dermochelys coriacea) and otters were also recorded within the study area (Table 1).
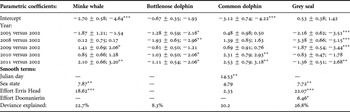
Among the four key species examined for seasonal variation in occurrence, only common dolphins showed a significant seasonal pattern, with lower daily presence during spring and summer (i.e. April to August) by comparison to autumn and winter (i.e. September to March: Table 2; Figure 3B). Parameters included to correct for sighting efficiency (sea state and observer effort from Erris Head and Doonanierin Point, respectively) were significant for the two species that were observed mostly as single individuals (i.e. minke whales and grey seals (Figure 3A, C)), but not for the more gregarious common and bottlenose dolphins which were usually recorded in groups and often showed conspicuous surface behaviour (Table 2). As expected, the probability of detecting both minke whales and grey seals showed a linear decline with increasing sea state (Figure 3A1, C1) and increased with increasing number of hours watched per day (Figure 3A2, C2, C3). Minke whales and grey seals were more frequently recorded from Erris Head than from Doonanierin Point, reflected by the significant positive relationship between observer effort from this site and the detection of both species. In contrast, observer effort from Doonanierin Point was significant only in the model for grey seal presence and showed a lower Chi-square (χ2)-value than effort from Erris Head. However, while the positive relationship between sighting probability for grey seal and effort from Doonanierin Point was linear (Figure 3C3), the smoothing curve showed a plateau above 4 hours for Erris Head (Figure 3C2), indicating that 4 hours were sufficient effort to detect grey seals from Erris Head if they were present. The interaction term between observer effort from both sites showed no significance in any of the models. Significant interannual differences were detected in the occurrence of all four species, with minke whales and common dolphins showing a peak in daily presence during 2011 and 2010–2011, respectively. Bottlenose dolphins were most frequently observed during 2002 and 2009, and grey seals during 2002 and 2010 (Table 2).
Summaries for final seasonal models of daily presence/absence of minke whale, bottlenose dolphin, common dolphin and grey seal. For parametric coefficients, the first term represents the parameter estimate ± standard error; the second term represents the z-value. For smoothers, the χ 2-value is given. Significance levels: *, P < 0.05; **, P < 0.01; ***, P < 0.001. A dash (−) indicates that the variable was not included in the final model.

Differences in spatial distribution between species
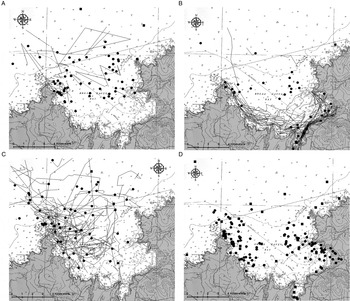
In spite of effective survey coverage of the bay as a whole, minke whale and common dolphin sightings were concentrated predominantly in the outer and western parts of the bay, particularly in the vicinity of the area of tidal upwelling around Erris Head (Figure 4A, C). In contrast, bottlenose dolphins showed a more inshore distribution, concentrated on the inner part of the bay. The quite consistent preference for waters in proximity to the indented coastline is particularly evident from the plotted tracks of individual bottlenose dolphin groups (Figure 4B). Grey seals were distributed widely throughout Broadhaven Bay, although there was a potential bias towards a greater number of sightings closer to the two land-based observation sites as a result of decreasing detectability with increasing distance from the observer position (Figure 4D).
Cliff-based theodolite positions of both effort-related and opportunistic sightings (circles), boat-based sightings (squares) and surface tracks of (A) minke whale, (B) bottlenose dolphin, (C) common dolphin and (D) grey seal within Broadhaven Bay and adjacent waters. Grey seals could not be tracked from the cliff. The broken straight line outside Broadhaven Bay indicates the Special Area of Conservation boundary.

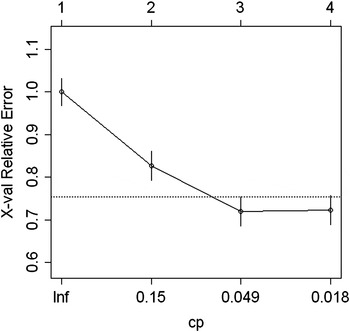
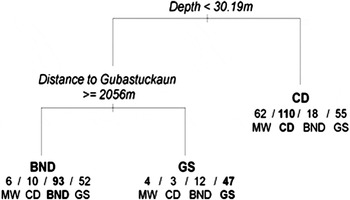
Based on the results of the classification tree, depth was more important in spatially separating the four species within Broadhaven Bay than distance from the tidally active area at Erris Head. The optimal tree size determined by cross-validation was three (Figure 5). This tree had an error of 69.8% of the root node error (i.e. classification error with no splits). However, the only successful differentiation was between bottlenose dolphins (75.6% of data points correctly classified) and common dolphins (89.4% correctly classified), and bottlenose dolphins and minke whales (86.1% classified as common dolphins), based on their different depth preferences (bottlenose dolphins predominantly at <30 m; common dolphins and minke whales at >30 m: Figure 6). An additional category, classified as grey seal since the species contributed to the highest number of data points, was differentiated from bottlenose dolphins by a closer proximity to the tidally active area around Erris Head. However, grey seals appeared in all three categories with approximately equal frequency (Figure 6), reflecting their wide distribution within the bay.
Determination of optimal tree size: the y-axis represents the relative error of the predictions calculated by cross-validation; cp stands for the complexity parameter of the tree. Corresponding tree sizes (i.e. the number of splits plus 1) are indicated along the top. The horizontal dotted line represents the mean error plus standard deviation of the cross-validations at convergence. According to the one standard deviation rule, the optimal tree size is at cp = 0.049 with a corresponding tree size of 3.

Optimal classification tree of species according to spatial distribution: conditions indicated at the top of each split apply to the left-hand branch. Figures at the bottom of each branch refer to the number of data points for each species classified as the dominant species of that branch. MW, minke whale; CD, common dolphin; BND, bottlenose dolphin; GS, grey seal.

DISCUSSION
Seasonal occurrence
When corrected for observer effort and sighting conditions in the models for temporal occurrence, only common dolphins showed a seasonal pattern in their presence within Broadhaven Bay, while minke whales, bottlenose dolphins and grey seals did not.
Based on data collected by the Irish Whale and Dolphin Group's observer network, numbers of sighting records of minke whales, bottlenose and common dolphins around the Irish coast peak during the summer and early autumn months (Berrow et al., Reference Berrow, Whooley, O'Connell and Wall2010), i.e. when sighting conditions are best and observer effort is highest. Effort-corrected sighting rates for common dolphins along the west coast (data pooled for Slea Head, Loop Head and Black Head) also showed highest occurrence during summer and autumn, whereas a peak was recorded during autumn and winter along the south coast (Berrow et al., Reference Berrow, Whooley, O'Connell and Wall2010). In Broadhaven Bay, common dolphins showed a seasonal pattern which was more similar to records from the south coast, i.e. with highest occurrence during autumn and winter. However, it is likely that there is some variation between different sites along the west coast, and effort is not directly comparable between the monthly watches conducted by the Irish Whale and Dolphin Group and the monitoring programme in Broadhaven Bay.
The lack of any seasonal peak in occurrence for bottlenose dolphins in our study area is not unexpected; results from photo-ID within Broadhaven Bay (Anderwald et al., Reference Anderwald, Brandecker, Haberlin, Coleman, Collins, O'Donovan, Pinfield and Cronin2012) have shown that individuals visiting the area belong to a population which appears to use the inshore waters of the entire west coast of Ireland and is genetically distinct from both the resident population of the Shannon Estuary and animals which occur further offshore (O'Brien et al., Reference O'Brien, Berrow, Ryan, McGrath, O'Connor, Pesante, Burrows, Massett, Klötzer and Whooley2009b; Mirimin et al., Reference Mirimin, Miller, Dillane, Berrow, Ingram, Cross and Rogan2011). The bottlenose dolphins of Broadhaven Bay should therefore not be considered as resident, but rather as regular visitors to the study area (approximately once or twice a month on average), possibly on their way north or south along the coast. When dolphins are present in the bay, they are usually re-sighted within the study area and adjacent waters over a period of two days or more, with feeding and socializing being the most common behaviours observed.
The fact that minke whales did not show any seasonal patterns in occurrence within the study area is interesting, given that the species is thought to undertake seasonal migrations between higher latitude summer feeding areas and lower latitude winter breeding grounds (e.g. Stewart & Leatherwood, Reference Stewart, Leatherwood, Ridgway and Sir Harrison1985). Indeed, sighting rates of the species in UK waters, as well as off the north and east coasts of Ireland, tend to be strongly biased towards the summer months (Evans et al., Reference Evans, Anderwald and Baines2003; Berrow et al., Reference Berrow, Whooley, O'Connell and Wall2010). However, some winter sightings have been recorded during land-based, effort-related watches from both the south and west coasts of Ireland (Berrow et al., Reference Berrow, Whooley, O'Connell and Wall2010), consistent with our own observations in north-west Mayo. Given that sighting rates in Berrow et al. (Reference Berrow, Whooley, O'Connell and Wall2010) were not corrected for sea state, it is likely that minke whale presence during winter was under-estimated due to the relatively unfavourable viewing conditions at this time of year (sighting efficiency for this species showed a linear decline even between sea states 1 and 3 in our study: Figure 3A1). These higher sighting rates during winter for the south and west coasts of Ireland by comparison to the east and north coasts, as well as in UK waters, might be an indication of a general west- or south-west, offshore migration during late autumn/early winter, as suggested by Anderwald et al. (Reference Anderwald, Evans, Hoelzel, Papastavrou, Harris and Yalden2008).
The lack of any seasonal pattern in grey seal occurrence when corrected for observer effort and sighting conditions suggests that the species uses Broadhaven Bay as a feeding area year-round. This is probably due to the proximity of the breeding and haul-out sites of the Inishkea Islands SAC and at Benwee Head.
Spatial differences in habitat use
Results from the classification tree suggest differential habitat use of the study area by bottlenose dolphins from both common dolphins and minke whales with respect to depth and distance to an area of tidal upwelling, possibly reflecting differences in the behavioural ecology of these species. Due to the solitary nature of minke whales and their relatively inconspicuous surface behaviour by comparison to common and bottlenose dolphins, it would be expected that the detection range for this species is more limited. However, this effect did not appear to influence the outcome of the analysis, as reflected by the lack of a spatial differentiation between minke whale and common dolphin sightings. Nevertheless, sightings in the deeper, offshore waters are probably under-represented for all species due to the decline in detection probability with increasing distance from the two land-based observation sites.
With respect to bottlenose dolphins, the findings for a local area using fine-scale environmental parameters are comparable to results on the niche differentiation of cetaceans from a much wider region covering waters (primarily over the continental shelf) all around the UK and Ireland (Anderwald, Reference Anderwald2002). In that study, bottlenose dolphins could also be differentiated from other species including minke whale and common dolphin by their distribution mainly close inshore (reflected by their association with areas of shallow depths, highly variable seafloor topography and low salinity). On the other hand, the differentiation between minke whales and common dolphins indicated an overall distribution of common dolphin sightings further from the coast into deeper waters than for minke whales (Anderwald, Reference Anderwald2002), but there was no evidence of spatial partitioning between common dolphin and minke whale sightings at the fine scale investigated in Broadhaven Bay and adjacent waters. Both species were occasionally seen feeding on bait balls of pelagic fish (with gannets associated) off Erris Head in close proximity to each other, i.e. probably taking the same prey at the time.
The wide distribution observed for grey seals within Broadhaven Bay is surprising in that sighting efficiency for this species is expected to decline rapidly with increasing distance from the two cliff-based observation sites due to its relatively small size and inconspicuous behaviour at the surface. The fact that this detection bias, which was more pronounced than for minke whales, did not seem to influence the outcome of the analysis may be due to a compensation for this effect by the boat-based surveys which covered the entire bay, and the result likely represents a genuine reflection of the high occurrence of grey seals throughout the whole study area. The species is known to have a very varied diet, consisting of both benthic and pelagic fish (including gadoids, sandeels and flatfish: Strong, Reference Strong1996; Hammond & Grellier, Reference Hammond and Grellier2006; Hammond & Harris, Reference Hammond and Harris2006). Seals would therefore be expected to forage in both shallow waters close to the coast, as well as deeper areas in the outer parts of the bay, and this is reflected in their distribution.
Importance of Broadhaven Bay as a marine mammal habitat
Broadhaven Bay and adjacent waters appear to be an important habitat for marine mammals in terms of high species diversity (nine species of cetacean and both species of seal occurring in Ireland). This includes high numbers of sightings of all four marine mammal species listed under Annex II of the EU Habitats Directive (bottlenose dolphin, harbour porpoise, grey and harbour seals: EEC, 1992) and year-round sightings of five species (minke whale, bottlenose and common dolphins, harbour porpoise and grey seal: Table 1).
In terms of overall species diversity for cetaceans, Broadhaven Bay compares favourably to all 14 coastal sites in Ireland where regular effort-related watches have been conducted by members of the Irish Whale and Dolphin Group between 2000 and 2009. Only three of these sites have had a comparable number of species, with eight recorded off Galley Head (County Cork), and seven each at Ram Head (County Waterford) and Slea Head (County Kerry: Berrow et al., Reference Berrow, Whooley, O'Connell and Wall2010). Those sites, however, are more important for fin and humpback whales than Broadhaven Bay, where neither of these two large whale species has been recorded despite the higher survey effort during the years of the monitoring project. The relative lack of sightings of large baleen whales in our study area (just one sei whale record in 2009: Table 1) is consistent with land-based observations at other sites along the north-west and north coasts (Berrow et al., 2010).
Despite the high marine mammal diversity found in Broadhaven Bay, most species recorded here appear to range far beyond the boundaries of the study area. They cannot therefore be considered resident, and no important breeding areas have been documented within the small study area itself. The only species which may possibly show year-round residency within Broadhaven Bay and adjacent waters are the harbour porpoise and grey seal. For the harbour porpoise, insufficient data are available from land-based visual observations to reach any firm conclusions, and the questions of seasonal patterns in occurrence, habitat use and residency are therefore being investigated using passive acoustic monitoring (see Anderwald et al., Reference Anderwald, Brandecker, Haberlin, Coleman, Collins, O'Donovan, Pinfield and Cronin2012).
With 296 confirmed sightings (i.e. three times as many sightings as the two next most frequently encountered species, the common dolphin and minke whale) during the monitoring programme, the grey seal is the most common marine mammal species of Broadhaven Bay and is present in the study area year-round (Table 1), showing no obvious seasonal pattern in occurrence (Table 2). It is at present unknown whether individual seals recorded foraging/feeding in the study area come from the colony at Benwee Head (at a distance of ~6 km) or the nationally important breeding colony on the Inishkea Islands (at a distance of ~25 km: Cronin et al., 2007b; Ó Cadhla et al., 2007), or from both. Satellite telemetry studies would confirm whether or not Broadhaven Bay SAC is indeed an important feeding area for grey seals from the Inishkea SAC, which might justify listing this Annex II species as an additional feature for Broadhaven Bay SAC.
ACKNOWLEDGEMENTS
The present monitoring programme has been funded by Shell E&P Ireland Ltd, having been established initially by Enterprise Energy Ireland Ltd. Our thanks go to all past and present observers on the project: A. Brandecker, C. Collins, H. Denniston, M. Haberlin, S. Ingram, M. Mackey, M. O'Donovan, E. Philpott, R. Pinfield, A. Ponzo and L. Walshe. Numerous people have supported the project locally and have helped out with logistics or reported sightings: A. Irwin, G. O'Connor, P. O'Donnell, M. Oudejans, G. and E. Reilly and V. and S. Sweeney. Finally, we would like to thank E. Reilly and other local land-owners for allowing the team to access their land in order to conduct the cliff-based observations. Background maps in Figures 1 & 4 are ©Crown Copyright and/or database rights; reproduced by permission of the Controller of Her Majesty's Stationery Office and the UK Hydrographic Office (www.ukho.gov.uk), licence no. 15985.