Introduction
Long-run growth and economic inequality are increasingly the topic of international economic history (Piketty Reference Piketty2014; Roine and Waldenstrom Reference Roine and Waldenstrom2014). Piketty's thesis, that when the rate of return to wealth is greater than the rate of economic growth the result is greater inequality, is a pessimistic one. Moreover, it is at odds with the more hopeful Kuznets curve hypothesis that inequality grows during industrialization and economic growth but declines once industrialization is widespread and economic growth moderates (Kuznets Reference Kuznets1955, Reference Kuznets1966).
Deaton (Reference Deaton2013: 78) remarks that rapid economic growth and change can be accompanied by greater inequality. Indeed, inequality is “one of the ‘gifts’ of civilization” in that innovation, growth, and progress must start somewhere and differential timing inevitably results in some divergence in material standards of living. The economic inequality characterizing late-nineteenth-century Europe and America during their economic expansion and industrialization that also raised individual material welfare is evidence of this. Certainly, evidence for Canada also suggests periods of rapid growth like the wheat boom era were also associated with rising inequality.Footnote 1
There is debate and mixed evidence over whether long-term economic growth, development, and industrialization reduced or increased inequality. For example, recent research suggests that income inequality across countries, at preindustrial times and today, is similar.Footnote 2 In the case of the United States, Williamson and LindertFootnote 3 have argued that industrialization brought about increased inequality whereas Soltow (Reference Soltow1989: 5) has felt that the Industrial Revolution had the opposite long-term effect because the factory revolution offered greater employment opportunities than previously existed. Yet, Soltow has documented that even eighteenth-century America appears to have exhibited significant wealth inequality that was nevertheless tolerated because of wider rates of property holding relative to Europe.Footnote 4
To provide another dimension to addressing the relationship between economic performance and wealth inequality—a relationship usually addressed using national-level data—evidence at a regional level is examined using county-level wealth for Ontario in 1892 and 1902. The Canadian province of Ontario has been a keystone of the Canadian economy since Confederation with the largest provincial share of national population and output. Yet, late-nineteenth-century Ontario was marked by an economic slump that was not reversed until the early-twentieth-century boom. At the same time, this period for Ontario was accompanied by declining inequality of wealth.
Most studies of the relationship between inequality and economic growth and performance use national-level data.Footnote 5 There are potentially several methodological issues when it comes to examining wealth inequality that are compounded if international comparisons are to be made. Among them are the actual definition of what wealth is, the unit of observation, assorted biases of the data source being made use of, asset coverage, sampling differences as well as institutional differences when data from different countries are compared (Wolff Reference Wolff and Osberg1991: 94).
These issues are exacerbated when long-term international comparisons of historical wealth inequality are made given the diversity of data sources over time. Roine and Waldenstrom (Reference Roine and Waldenstrom2014) in their look at long-term trends in wealth inequality use international data sets that cover households, adults, families, and males only and that were generated from surveys, tax records, and probate. They note that even when a common unit of comparison is available across countries (e.g., households) the definition is not identical across countries and can even vary over time within a country.Footnote 6
In this article, the availability of data from one large jurisdiction with substantial geographic diversity and a common set of institutions is an opportunity to examine inequality free from some of these data issues. The results here find that after controlling for confounding factors, declining wealth inequality was generally accompanied by slower economic performance as measured by changes in wealth levels. This suggests that a more unequal wealth distribution may sometimes be the price of more robust economic growth.
Economic Inequality and Economic Performance
Economic inequality was a prominent feature of nineteenth-century economies (see Piketty Reference Piketty2014). The complex determinants of inequality ultimately depend on individual abilities to take advantage of economic opportunities as well as absorb economic shocks. Any study of inequality using historical microdata must be placed into the context of Simon Kuznets (Reference Kuznets1955, Reference Kuznets1966) and the inverted-U hypothesis relationship between economic growth and inequality. The relative optimism of the Kuznetsian hypothesis lies in the inverted u-shaped relationship demonstrating rising inequality during the initial phase of industrialization and rapid economic growth and then declining inequality.
However, Piketty (Reference Piketty2014) argues inequality rises when the rate of return to capital exceeds the economy's growth rate. Furthermore, Piketty's work implies an era of slower economic growth will inevitably be associated with rising inequality given the long-term trend in rates of return to capital.Footnote 7 Piketty (ibid.) argues that increasing equality during the twentieth century was at best an aberration brought about by war, which eroded the return to capital.
Causal links between economic inequality and economic growth include capital market imperfections that hinder the poor from borrowing to invest in human capital, policy responses to economic inequality, the disruptive effect of social unrest and revolution on the economy from high economic inequality, and the effect of inequality on savings rates.Footnote 8 While most of the literature on the relationship between inequality and economic performance growth focuses on income inequality, it can apply to wealth inequality (see Forbes Reference Forbes2000).
Persson and Tabellini (Reference Persson and Tabellini1994) maintain that in a society where distributional conflict is important, political decisions produce economic policies that tax investment and growth-promoting activities in order to redistribute income. They find a significant and negative empirical relationship between inequality and growth. Alesina and Rodrik (Reference Alesina and Rodrik1994) present a model in which the public sector provides a public input into production financed using a tax on capital income with the result that a more equal distribution of income results in lower taxation rates and faster economic growth. Alesina and Perotti (Reference Alesina and Perotti1996) model high levels of income inequality creating social unrest, which results in instability and less investment thereby reducing economic growth.
The effect of inequality of savings rates is also the subject of some debate with the traditional view being that because the rich have higher savings rates, inequality may lead to greater saving and investment (see Ashton Reference Ashton1948: 7; Kaldor Reference Kaldor1957). However, Stiglitz (Reference Stigliz2012) argues that greater inequality leads to a higher savings rate but this results in a decline in aggregate demand, which reduces economic growth.
Most developed economies saw increasing wealth inequality during nineteenth-century industrialization that abated during the first three-quarters of the twentieth century.Footnote 9 North American studies of wealth accumulation document high rates of accumulation as well as high wealth inequality, even in frontier areas of recent settlement.Footnote 10 Wealth inequality was also high for continental Europe, Australia, and New Zealand in the nineteenth century and early part of the twentieth century.Footnote 11
Banerjee and Duflo (Reference Banerjee and Duflo2003) estimate an inverted u-shaped relationship between growth and inequality using cross-country data but caution that while this result is consistent with a Kuznets curve, it could also reflect measurement error as well as identification problems. Studies finding a Kuznets-type relationship in an American context include Williamson (Reference Williamson1965), Lindert and Williamson (Reference Lindert and Williamson1985), Williamson and Lindert (Reference Williamson and Lindert1980), and Lindert (Reference Lindert, Brenner, Kaelble and Thomas1991).
For Canada, Alan Green (Reference Green1967, Reference Green1968/69, Reference Green1971) found evidence of a Kuznets curve with regional disparities converging after World War I. Green argues that regional inequality continued to increase because the wheat boom era stimulated an agricultural expansion that was a low-income sector in the west while the high-income manufacturing sector expanded in central Canada. By contrast, Inwood and Irwin (Reference Inwood and Chamard1998: 18), using pre–World War I regional income estimates for the period 1870 to 1890, observe a modest reduction in spatial inequality between 1870 and 1890.Footnote 12
Williamson (Reference Williamson1996, Reference Williamson1998) and Higgins and Williamson (Reference Higgins and Williamson2002) move beyond examining inequality as simply an unconditional Kuznets curve relationship and consider that inequality is rooted in changes in income or wealth, as well as public policy, skills, institutions, education, resource endowments, and age structure.Footnote 13 Indeed, Atack and Bateman (Reference Atack and Bateman1981) and Gallman (Reference Gallman1978) maintain that because wealth does rise with age, the larger the proportion of young people in a society, the more wealth inequality there would be. International studies have generally found that relative inequality falls sharply over the first 10 to 15 years of the working lifetime, levels off over the remainder of the working period, and then begins to increase during retirement.Footnote 14
As well, values and beliefs regarding equity can be factors affecting economic inequality making religion a factor in determining wealth and income distributions. For late-nineteenth-century Ontario, Di Matteo (Reference Di Matteo2016) finds differences across religious affiliations when it comes to the degree of partibility in estate division with more partibility associated with less wealth inequality. At the international level, Fernandez (Reference Fernandez2014) notes that between 1910 and 1930, countries such as Spain, New Zealand, Belgium, Australia, and Italy displayed higher inequality in land distribution while Finland, Denmark, Sweden, and Canada had less inequality. The latter countries had more prevalent Protestant populations.
Ontario's Poor Late-Nineteenth-Century Economic Performance
Understanding Ontario's late-nineteenth-century economic performance is a challenge given the dearth of detailed long-term evidence on Canadian regional economic performance combined with national economic evidence suggesting slower national growth after Confederation followed by the more rapid growth of the prairie settlement era. Taken together, the evidence suggests that Canada and Ontario experienced slower economic growth prior to 1900 with Ontario being particularly hard hit. Growth then becomes quite robust after 1900 in Canada including Ontario as a result of the wheat boom era and prairie settlement. The wealth accumulation and distribution evidence provided by the Ontario 1892 and 1902 probate records would invariably reflect much of this pre-1900 era of slower economic growth.
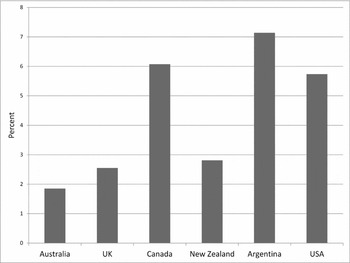
At the international level, Canada appears to do relatively well between 1870 and 1929. Figure 1 shows the average annual growth rate of nominal per capita gross domestic product (GDP) for several countries and shows Canada's growth compares favorably with both the United States and Argentina. However, Canadian economic growth was more pronounced after 1896 and especially after 1900 coinciding with the wheat boom era and sustained manufacturing productivity and development, though the 1890s do appear to have witnessed an export surge (see Ankli Reference Ankli1980; Green and Urquhart Reference Green, Urquhart and McCalla1987, Reference Green, Urquhart, McCalla and Huberman1994; Keay Reference Keay2000a, Reference Keay2000b). While some recent work suggests the Canadian economy actually grew at its most rapid pace for a decade prior to the settlement effects of the wheat boom,Footnote 15 Buckley and Altman have placed more emphasis on the period from 1872 to 1892 as one of “secular depression” (see Altman Reference Altman1987; Buckley Reference Buckley1955) with the year 1891 associated with a particularly severe downturn (Darroch Reference Darroch1983).
Average annual growth rate of per capita GDP, 1870–1929.

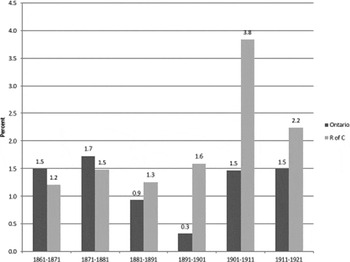
From 1871 to 1896, real per capita gross national product (GNP) in Canada grew at an implied annual rate of 1.0 percent whereas from 1896 to 1926 it grew at 2.4 percent.Footnote 16 While Ontario over the entire pre-1926 period still has the highest real per capita output of the Canadian provinces (see Inwood and Irwin Reference Inwood and Irwin2002), it does appear to have been afflicted with poorer performance. For example, Ontario population growth—which can be taken as one sign of response to economic opportunity—was only slightly better than the rest of Canada from 1861 to 1881. It then fell below the rest of Canada from 1881 through to 1921 as illustrated in figure 2. In addition, between 1890 and 1910, Ontario's share of national output declined from 49.2 to 41.4 percent, though after 1900 this would be the result of the opportunities of the wheat boom expanding the western frontier economy and population faster than Ontario rather than slower growth in Ontario per se (Green Reference Green1967: 238).
Implied population growth rates: Ontario versus rest of Canada, 1861–1921.

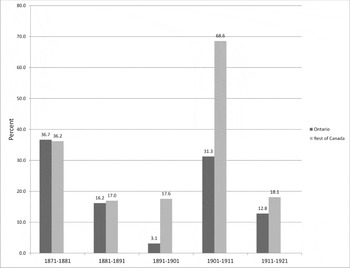
Employment growth as illustrated in figure 3 provides additional evidence of Ontario's economic performance relative to the rest of Canada throughout the period 1871 to 1921. Between 1871 and 1901, Canada and Ontario's employment growth rate fell, though Ontario's fell substantially more. Whereas Ontario's rate of employment growth exceeded Canada's slightly during the 1870s, it fell slightly behind in the 1880s and then plummeted during the 1890s. Ontario's employment growth remained below that of the rest of Canada after 1901, though that can be attributed to the rapidly expanding western Canadian economy as a result of the wheat boom. The pre-1900 performance cannot be explained by western settlement and is more likely the result of a relatively more poorly performing Ontario economy.
Employment growth by decade, all occupations, Canada and Ontario, 1871–1921.

Ontario even in the nineteenth century was regarded as Canada's industrial heartland but Ontario's performance in manufacturing also appears to have substantially worsened especially relative to the rest of the country. Percent growth in real output per worker in manufacturing in Ontario was 12.6 percent between 1870 and 1880 and rose to 15.5 percent from 1880 to 1890 before plummeting to -1.2 percent from 1890 to 1900 (see Drummond Reference Drummond1987: table 7.3).Footnote 17 Comparing the growth rate of manufacturing output between Ontario and the rest of Canada, they were similar between 1870 and 1890 but the period from 1890 to 1900 saw Ontario's manufacturing output drop 7.5 percent while the rest of Canada's grew by 61.3 percent.Footnote 18 In their study of Canadian regional industrial growth, Inwood and Chamard (Reference Inwood and Chamard1986) find that Ontario's manufacturing output growth exceeded that of Quebec and the Maritimes but was below the Prairies and British Columbia during the 1880s. During the 1890s, Ontario's growth in manufacturing output only exceeded that of the Maritimes falling even below that of Quebec.
More direct evidence of poorer economic opportunities in Ontario is also suggested by the tendency of English Canadians to migrate to the United States, which also had higher per capita income.Footnote 19 Indeed, according to the IPUMS 5 percent census sample for the year 1900, 1.64 percent of the US population was Canadian born and Canadians made up 12 percent of the foreign-born population (Ruggles et al. Reference Ruggles, Alexander, Genadek, Goeken, Schroeder and Sobek2010). This outflow of Canadians is significant when compared to the size of Canada's population at the time.Footnote 20
A study of the distribution of Canadian migrants to the United States over the period 1850 to 1950 found migrants were particularly sensitive to state income differentials and employment opportunities. There was a pronounced tendency to settle along the border particularly between 1880 and 1900 (Vedder and Gallaway Reference Vedder and Gallaway1970: 482–84).Footnote 21 Indeed, nominal per capita incomes in Canada were substantially lower than the United States between 1870 and 1907 with some convergence only occurring during the peak of the wheat boom era between 1907 and 1913.Footnote 22
Evidence of greater economic opportunity in the United States also comes from probate wealth evidence for American regions near Ontario. King (Reference King1915) in a survey of American wealth and income provides several tables on the distribution of wealth from estates of males probated in Massachusetts and Wisconsin.Footnote 23 These tables were used to compute the average wealth and wealth share of the top male 1 percent in Massachusetts and Wisconsin.
The top 1 percent of 35,148 male estates probated in Massachusetts over the period 1889 to 1891 had an average wealth of $271,494 and owned 47.1 percent of all probated wealth. The top 1 percent of 2,332 male estates probated in Wisconsin in the year 1900 had an average wealth of $219,081 and owned 46.0 percent of all probated wealth. By contrast, the top 1 percent of male Ontario probated decedents reported an average wealth over the 1892 to 1902 period of $201,610 and owned 24.9 percent of the wealth probated. Thus, average wealth in Ontario was also lower than these two nearby American jurisdictions.Footnote 24
Of course, ideal evidence would entail estimates of real per capita GDP growth for Ontario prior to 1900 compared to the rest of the country, but this is difficult given the absence of regional GDP estimates on an annual basis for Canada. As well, comparisons are inevitably complicated by the westward expansion of industrialization, increases in wheat exports, and increasing working hours over time.Footnote 25 Canada's economy between 1870 and 1920 underwent western settlement, industrialization, and rapid immigration especially after 1896, which together entailed a significant structural change in the economy and also needs to be acknowledged prior to any estimates of per capita out growth.Footnote 26 The temporary arrest of industrial relocation in central Canada noted by Inwood and Chamard (Reference Inwood and Chamard1986) could also be expected to be reflected in a slower Ontario growth rate.Footnote 27
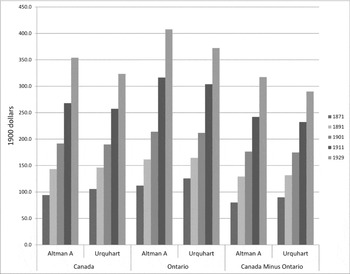
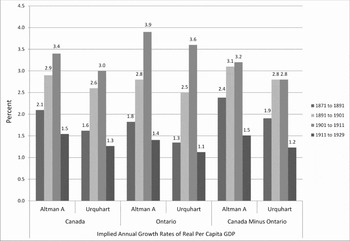
However, by way of another estimate, one can apply Ontario's share of national income in 1871, 1891, 1911, and 1929 as estimated by Inwood and Irwin (Reference Inwood and Irwin2002) and Green (Reference Green1967)Footnote 28 to annual Canadian GNP as constructed by Green and Urquhart (Reference Green, Urquhart, McCalla and Huberman1994) and Urquhart (Reference Urquhart1993) and then dividing by population to obtain an estimate of Ontario real per capita GNP ($1,900) for those years and then estimating the implied annual growth rates for Ontario and Canada net of Ontario. An estimate is also constructed for 1901 using the average of Ontario's output share for the years 1891 and 1911. These estimates of real per capita GNP and the accompanying growth rates are provided in figures 4 and 5. Estimates are provided both using the Urquhart GNP deflator as well as a revised deflator constructed by Altman (Reference Altman1992).Footnote 29
Real per capita GDP, Canada and Ontario, 1871–1929.

Implied annual growth rates of real per capita GDP, Canada and Ontario, 1871–1929.

The results show that while Ontario's level of real per capita GDP was higher than the Canadian average as well as Canada net of Ontario, there were some marked differences in the growth rates of real per capita GDP particularly in the period prior to the 1890s—the decade for which the probate wealth data was collected. Over the period 1871 to 1891, Ontario's real per capita GDP growth ranged from 1.3 to 1.8 percent annually while Canada net of Ontario ranged from 1.9 to 2.4 percent. For the period 1891 to 1901, Ontario's annual real per capita GDP growth ranges from 2.5 to 2.8 percent while Canada net of Ontario ranges from 2.8 to 3.1 percent. Ontario then rebounds significantly over the period 1901 to 1911 reflecting the effects of the wheat boom era that kicked in after 1896 and became especially robust after 1900 based on aggregate Canadian results. Real per capita income ($1,900) for Canada as a whole from 1890 to 1896 is essentially flat going from $138 to $134 but then recovers reaching $171 by 1900 and $246 by 1911 (Green and Urquhart Reference Green, Urquhart and McCalla1987: 183). In addition, Ontario's population during this period is growing slower than the rest of the country thereby making its per capita income growth performance appear better than if its population growth was matching the rest of Canada. One can therefore reasonably conclude that from the early 1870s to at least the mid-1890s, Ontario's economic performance was relatively poor and lagged that of the rest of Canada.
Data
The microdata consists of census-linked probated decedents from the 37 southern counties and six northern districts of Ontario, Canada for the years 1892 and 1902. It was constructed from the probate records of the county surrogate courtsFootnote 30 and the 1891 and 1901 Census of Canada.Footnote 31 Detailed wealth information across 16 probate inventory categories is available allowing for estimates of individual net wealth.Footnote 32 While income and output are often used as indicators of economic growth, wealth and its change over time will be used in this article as an indicator of economic growth and performance. Wealth is a stock while income is a flow, and both can be indicators of material welfare that economic growth generally improves over time.
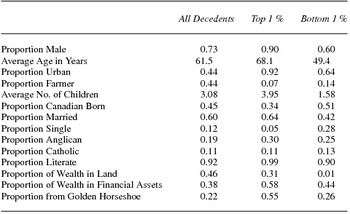
Table 1 presents summary statistics for all decedents as well as the top and bottom 1 percent and reveals the decedents were mainly male, largely Canadian born, married, and quite literate. The top 1 percent was overwhelmingly male. Indeed, 90 percent were men. As well, the top 1 percent were clustered in the Golden HorseshoeFootnote 33 region around the Western end of Lake Ontario with 55 percent of them from this region. Overall, only 21 percent of decedents were from the Golden Horseshoe and only 73 percent were male. In contrast, 59 percent of the bottom 1 percent was female and 26 percent are from the Golden Horseshoe. As well, the average age at death of the top 1 percent on wealth holders was 68 while for the bottom 1 percent it was 49 reinforcing the adage that the poor, like the good, die young.
Summary statistics for key characteristics, 1892 and 1902 combined

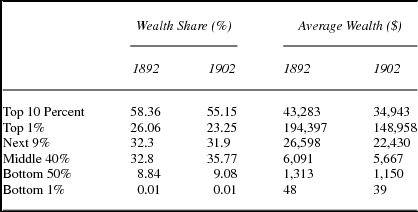
Table 2 provides a description of the distribution of wealth separately for 1892 and 1902 as well as average wealth using a division employed by Piketty (Reference Piketty2014: 237–70) into top, middle, and bottom portions. Average wealth declines for each component of the distribution across the two years. Meanwhile, the wealth share held by the bottom and middle of the distribution grows while that held by the top declines suggesting a relationship between poor growth and greater equality.
Wealth distribution and average wealth

Between 1892 and 1902, the average wealth of the top 1 percent of the distribution dropped from $194,397 to $148,958 and its share of total wealth fell from 26.1 to 23.3 percent. The share of the next 9 percent also dropped slightly between these two years while the share of the remaining 90 percent of the wealth distribution rose. Between 1892 and 1902, the wealth share of the middle 40 percent rose from 32.8 to 35.8 percent while that of the bottom half rose from 8.8 to 9.1 percent.
It should be noted that Ontario had a more equitable wealth distribution relative to other nineteenth-century jurisdictions.Footnote 34 While the link between slower economic performance and growth and greater equality is the focus of this article, it is worth noting other potential factors resulting in a more equitable wealth distribution. An additional reason may simply be the rural and agricultural nature of Ontario's economy. In 1851, 86 percent of Ontarians were rural residents and largely employed in the agricultural sector. While the rural share of the population declined during the nineteenth century, it was still significant with the crossover period occurring between 1901 and 1911. In 1901, 57 percent of Ontarians were rural whereas by the 1911 census, 48 percent of Ontarians were rural.Footnote 35
There is evidence supporting greater wealth equality in jurisdictions with economies rooted in farming and agriculture. For example, throughout the period 1870 to 1930, wealth inequality was less pronounced in the agricultural frontier of Manitoba relative to that of industrializing Ontario with higher rates of land ownership and greater farm employment as key factors in the difference (Di Matteo Reference Di Matteo2012). This suggests that in a manner akin to other rural farming jurisdictions, Ontario may have been a region in the nineteenth century that afforded a reasonable standard of living to people of relatively modest means even if it meant they were in the lower end of the wealth distribution.Footnote 36
Another possibility is that this probate wealth data set is simply marked by extremely bad luck in that extremely wealthy Ontarians did not have their estates probated in either 1892 or 1902. A limited search of the Canadian Dictionary of Biography (www.biographi.ca/en/index.php) was done to see if any additional evidence could be uncovered on Ontario's wealth elite with the purpose of seeing if very wealthy individuals had somehow escaped probate. A search was done using Volume XII, which covers the period 1891 to 1900 for males in central Ontario using the key words of business, energy, and resources. The results yielded 47 individuals, many with multiple business interests.
Of these, 28 percent report activity in transportation and utilities, 26 percent in resources, 6 percent in banking or finance, 28 percent in trade and commerce including retail, merchant activities, or real estate while 19 percent were manufacturers and 9 percent publishers. Nine of these individuals reported an estimate of business value while 10 had an estimate of the value of their estates at death.
The average reported value of business was $355,644 ranging from a low of $30,000 to a high of $835,800 dollars. The average estate value reported was $373,069 ranging from a low of $28,697 to a high of 2.2 million dollars. Based on these values, these individuals were indeed on average wealthier than the top 1 percent reported in the Ontario 1892 and 1902 probate records but still none of them could be classified as being in the same league as the wealthiest Americans during this time period. Even the wealthiest of them—Hart Massey, the farm implement manufacturer—who dies in 1896 with an estate valued at 2.2 million dollars, almost double the wealth of the wealthiest Ontarian in the probate data set—pales in comparison with the wealth of American robber barons.Footnote 37
Economic Performance and Inequality in Ontario: An Analysis
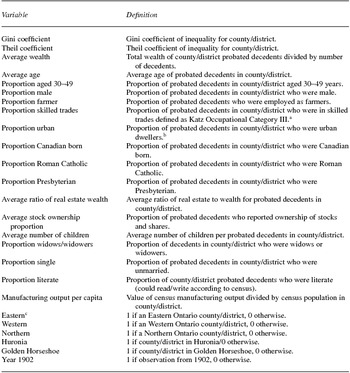
The 1892 and 1902 microdata are used to construct county-level inequality measures and variables as defined in table 3. In 1892, average county wealth ranged from a minimum of $2,415 to a maximum of $18,556 while in 1902 the range was from $2,508 to $17,241. The value of the Gini coefficientFootnote 38 ranged from 0.459 to 0.818 in 1892 and from 0.425 to 0.839 in 1902. Average wealth in this entire data set fell from $7,427 to $6,334 between 1892 and 1902 or 14.7 percent. This was accompanied by a fall in the Gini coefficient of inequality from 0.687 to 0.670.
Variables used in regression analysis

a “These are socioeconomic occupational status categories with OCC1 as the highest, OCC5 as the lowest, and OCC6 as an unclassifiable (see Katz 1975: 343–48). Category OCC1, for example, contains lawyers, merchants, doctors, etc. Categories OCC2F includes farmers, while OCC2NF contains minor government officials and small businessmen. Category OCC3 includes skilled tradesmen, such as blacksmiths, while OCC4 contains barbers and restaurant workers. Category OCC5 is mainly unskilled labor, while OCC6 is unclassifiable. OCC6 contains mainly women.”
b Urban is defined as a resident of a city, town, or village.
c “The counties in each of the regional dummies are as follows: NORTHERN: Renfrew, Districts of Muskoka and Parry Sound, Sudbury-Nipissing, Algoma, Manitoulin, Kenora and Rainy River, and Thunder Bay; GOLDEN HORSESHOE: Wentworth, Lincoln, Welland, Peel, Halton, and York; WESTERN: Haldimand, Norfolk, Elgin, Kent, Essex, Lambton, Middlesex, Oxford, and Brant; HURONIA: Waterloo, Perth, Huron, Wellington, Bruce, Grey, Simcoe, and Dufferin; EASTERN: Ontario, Victoria and Haliburton, Durham and Northumberland, Peterborough, Hastings, Prince Edward, Lennox and Addington, Frontenac, Leeds-Grenville, Dundas-Glengarry-Stormont, Oprescott and Russell, and Carleton and Lanark.”
There were also substantial regional fluctuations in average wealth and inequality in Ontario counties between 1892 and 1902. Average wealth was highest in York County (Toronto area) in 1892 at $18,556 but then declined by 50 percent to reach $9,225 in 1902. In 1902, average wealth was the highest in Carleton County (Ottawa area) and here wealth was up 65 percent from $10,483 in 1892. Inequality was also highest in York in 1892 but the value of its Gini fell 6.8 percent by 1902. In 1902, inequality was highest in Carleton County with the value of its Gini up 11.2 percent over 1892.
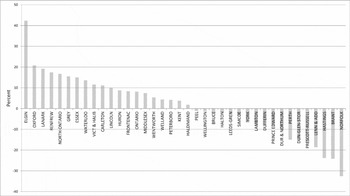
Between 1892 and 1902, wealth inequality fell in 18 counties and grew in the remainder as shown in figure 6. This raises the concern as to whether such large swings are reasonable.Footnote 39 It should be noted that along with being a period of economic change and industrialization, the 1890s also saw a major recession early on which inevitably could have differential effects across the province and be a factor in swings in both average wealth and inequality across counties. For example, Darroch (Reference Darroch1983: 44–45) notes a decline in assessed property values in Toronto between 1892 and 1902, which he attributes to an inflation in real estate values during the 1880s that was ended by the recession in 1891.
Percent change in Gini coefficients, Ontario counties, 1892–1902.

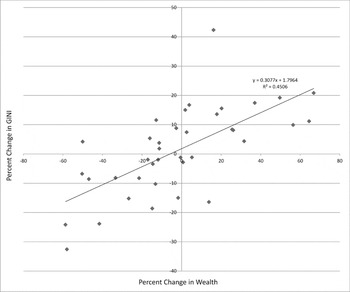
There appears to be a strong correlation between changes in average wealth and inequality in these counties between 1892 and 1902 as shown in figure 7, which plots the relationship between the percent change in the value of the Gini coefficient and the percent change in average wealth for these counties between 1892 and 1902. While this evidence suggests a relationship between growing wealth and rising inequality, it is also useful to see if the relationship is sufficiently robust when age or gender are accounted for.
Relationship between inequality and average county wealth changes.

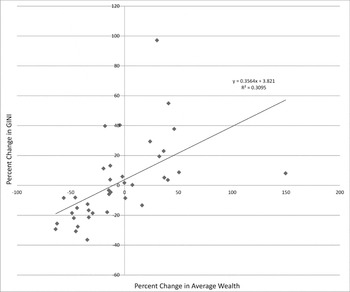
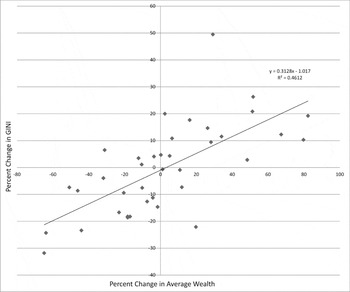
Figures 8 and 9 plot the relationship between changes in county wealth and inequality for individuals aged less than 60 and then for males. Given the high average age of probate data as well as the predominance of males in the data, adjusting for age or sex is useful to see if the relationship between wealth and inequality emerges for a younger subset of the data given that wealth generally rises with age or if only males are considered. Figures 8 and 9 also show a strong positive correlation between county changes in average wealth and inequality even when these subcategories of data are used.
Relationship between inequality changes and wealth changes: Population aged less than 60 years.

Relationship between inequality changes and wealth changes: Males only.

When examining the relationship between economic performance and inequality, it is also important to control for confounding factors in a more rigorous fashion. Regression analysis is used next to examine the determinants of changing wealth inequality in these county divisions of Ontario between 1892 and 1902. The difference in value between 1902 and 1892 (1902 value minus 1892 value) in Gini and Theil coefficientsFootnote 40 is regressed on the difference in average wealth as well as differences in other economic, demographic, and social characteristics to take the broader determinants of inequality into consideration. These additional variables include average age, proportion male, proportion urban dweller, the number of children, marital status (county proportion of spouse deceased or single), and religion (county proportion who are Roman Catholic or Presbyterian).
Roman Catholics and Presbyterians were included as opposed to Anglicans or Baptists or Methodists because of their inheritance practices. Di Matteo (Reference Di Matteo2016) shows that wealth inequality was positively related to the presence of impartible estate division and inversely related to more partible division. Di Matteo (Reference Di Matteo2016) also shows that in late-nineteenth-century Ontario, Roman Catholics were significantly more likely to engage in impartible estate division and Presbyterians in partible estate division.
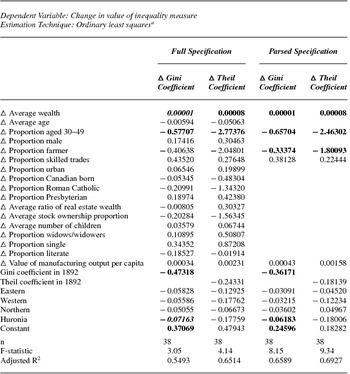
Additional variables include regional dummies (with the Golden Horseshoe as the omitted category), portfolio variables (the ratio of average real estate to average wealth and the proportion reporting ownership of stocks and shares), a literacy variable, an age-distribution variable defined as the proportion between ages 30 and 49,Footnote 41 farm occupation, and a skilled trades variable to capture the potential effects of skills deepening on inequality changes. As well, the value of inequality in 1892 is included as to provide an estimate of the change in inequality against the initial level of inequality.
Furthermore, an industrial output variable is included to capture any effects on inequality of industrialization. It is defined as the per capita county value of manufacturing production as provided in the 1891 and 1901 Census of Canada. While the value of manufacturing output (and wealth) is in nominal rather than real dollars, inflation adjusting is of little consequence between these two years.Footnote 42 Manufacturing and industrialization were important features of the economy in late-nineteenth-century Canada with manufacturing's share of GDP at more than 20 percent making manufacturing output a reasonable indicator for industrial output as well as a good correlate for total GDP (see Urquhart Reference Urquhart1993). It should also be noted that this manufacturing output variable provides a measure of current output and can therefore be considered as another economic growth variable.
These variables are defined in table 3 and the results presented in table 4. The regressions are estimated using ordinary least squares (OLS) and all significances are reported at the 5 percent level (from t-statistics) unless otherwise specified. The estimates are for both Gini and Theil coefficients and are done for all the variables as well as a parsed subset of the most significant variables from the first regression.Footnote 43 The presence of a high r-squared and numerous insignificant variables in the full specification suggested that multicollinearity was a problem and therefore a parsed specification was run that dropped the least significant variables.
Regression results for changes in wealth inequality from 1892 to 1902

a Bold denotes significant at 5 percent level. Bold italic denotes significant at 10 percent level.
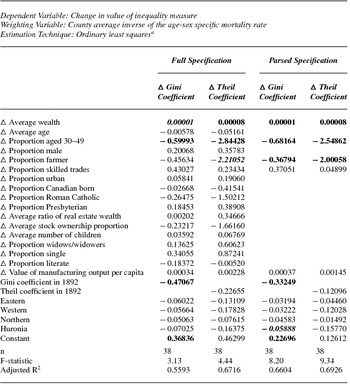
Furthermore, given that probated decedents were more likely to be older and male, an effort was made to adjust the data using age-sex specific mortality multipliers.Footnote 44 Regressions were done using weighted OLSFootnote 45 with the county average inverse of the age-sex specific mortality rateFootnote 46 used to weight the regression data. The mortality rates used are from historic life-tables constructed for Canada by Bourbeau and Légaré (Reference Bourbeau and Légaré1982). One can treat each probated decedent as a household head and then multiply each decedent by the inverse of his or her age-sex specific mortality rate.Footnote 47 The average value of this “multiplier” was calculated for each county and used as the weight and placed a higher weight on the younger individuals in the data set in an attempt to make it more reflective of the age distribution of the general population. These results are presented in table 5.
Weighted regression results for changes in wealth inequality from 1892 to 1902

a Bold denotes significant at 5 percent level. Bold italic denotes significant at 10 percent level.
The parsed results for both the unweighted and weighted regressions provide strong support for changes in wealth, the proportion employed as farmers and age structure as being the key factors driving the changes in wealth inequality across these counties between 1892 and 1902. The proportion employed in skilled trades and the value of manufacturing output per capita also seems to have had a positive effect on inequality but they are not very significant. All other things given, there was also a decline in inequality from 1892 and the Huronia region appears to have exhibited significantly less inequality relative to the Golden Horseshoe. However, the significance of the variables varies depending on whether Gini or Theil measures of inequality are used. The most consistently significant variables at the 5 percent level across all the specifications are the change in average wealth (Δ Average Wealth) and the change in the proportion of population aged 30 to 49 (Δ Proportion aged 30–49).Footnote 48 However, increases in the proportion employed in skilled trades and the per capita value of manufacturing output both had a positive effect on inequality while increases in the proportion employed as farmers had a negative effect on inequality.
Wealth inequality in late-nineteenth-century Ontario was indeed related to changes in economic performance especially as measured by changes in wealth. Between 1892 and 1902, increases in wealth were associated with increases in the value of inequality coefficients while decreases in wealth were associated with a fall in inequality. This result represents an exception to the pessimistic Piketty prognosis that slower economic growth, albeit combined with a rate of return to capital greater than the rate of economic growth, is associated with greater inequality.
Of course, an additional question is what the rate of return to capital was in nineteenth-century Ontario. Given that Canada was a small open economy, the return to wealth in Canada and Ontario could not have deviated from international norms given the flow of foreign investment into Canada for railway transportation and resource development projects.
On a global level, Piketty places the historical pure rate of return to capital (pretax) at rates between 4 and 5 percent (Piketty Reference Piketty2014: 354). Even estimates of the private rate of return to capital-intensive projects like the Great Western or Grand Trunk railroad in Ontario in the 1850s and 1860s range from 1.71 to 5.20 percent (Carlos and Lewis Reference Carlos, Lewis, Goldin and Rockoff1992: 413). The return on capital “r” would certainly have exceeded the growth rate of the economy “g” even in slow-growing Ontario and yet inequality diminished during the period of this study in contrast to the Piketty prognosis.
Conclusion
There is debate whether long-term economic growth, development, and industrialization reduced or increased inequality during the course of the nineteenth century with much of the evidence based on international data comparisons. However, comparisons of inequality using international data either in the present or the past are often fraught with measurement and coverage issues. The use of a region with common institutions and data-gathering processes, as is the case with these nineteenth-century Ontario probate records, represents a unique opportunity to control for many of the data issues that face current and past international inequality comparisons.
Ontario's late-nineteenth-century wealth, like other jurisdictions around the world, was marked by inequality in wealth holding. Over the period 1892 to 1902, the top 1 percent of the wealth distribution in Ontario owned 25 percent of the total wealth. Moreover, over the course of this period, the wealth share of both the top 1 percent and 10 percent of the wealth distribution declined. As well, this was accompanied by a fall in the Gini coefficient of inequality from 0.687 to 0.670.
Wealth inequality as measured by Gini and Theil coefficients diminished in Ontario between 1892 and 1902 but there was substantial regional fluctuation. Between 1892 and 1902, wealth inequality fell in 18 of the 38 counties/district divisions employed in this study and grew in the remainder. However, there was a strong correlation between changes in average wealth and inequality in these counties after confounding factors were controlled for. Over the period 1892 to 1902 at the county level, declining wealth inequality was generally accompanied by slower economic performance and growth as measured by changes in wealth levels over time after controlling for other factors.
Ontario's poor economic performance during the latter years of the nineteenth century may be an explanation as to why its wealth inequality was somewhat muted relative to other faster-growing jurisdictions. Nevertheless, this appears to place Ontario as an exception to the prognosis of lower economic growth being accompanied by rising economic inequality. In the case of Ontario, the price of greater equality was less robust economic growth, and Ontario's more egalitarian distribution was therefore a mixed blessing. Future regional-based studies using other countries would be useful contributions in further delineating the relationship between economic growth and inequality.