Implications
The use of hyperprolific sows in the pork industry increases the prevalence of prenatal growth-restricted piglets, characterised by reduced survival rates. Serotonin is prominently present in the gastrointestinal system and regulates feeding behaviour and BW. This study investigated the enteric distribution of serotonin cells and the concentration of this hormone along with its precursor tryptophan in the serum of perinatal SGA and normal littermates. These results – combined with the morphological analysis of the small intestine – will give insight into the endocrine programming and morphological adaptations of the small intestine of SGA piglets.
Introduction
Serotonin (5-hydroxytryptamine, 5-HT) is a neurotransmitter that regulates feeding behaviour and BW (Lam et al., Reference Lam, Garfield, Marston, Shaw and Heisler2010). Two independent 5-HT systems exist: one is present in the brain and one in the periphery. The central nervous system only synthesises 2% of the total amount of 5-HT, whereas 95% of 5-HT is derived from the gastrointestinal tract (Erspamer, Reference Erspamer1953; Twarog and Page, Reference Twarog and Page1953). In the latter, 5-HT is mainly present in the enterochromaffin cells, whereas only a small amount is located in the enteric nervous system (Erspamer, Reference Erspamer1954). In research, most of the attention has been focussed on the role of brain 5-HT, although enteric 5-HT also plays a key role as a growth factor, hormone and as a neurotransmitter (Gershon, Reference Gershon2013).
Litters from hyperprolific sows often display a natural form of intrauterine growth restriction (IUGR). Foetal growth restriction results in small-for-gestational age (SGA) pigs characterised by high perinatal mortality and morbidity (Quiniou et al., Reference Quiniou, Dagorn and Gaudre2002). Owing to intrauterine malnutrition, the SGA piglets develop altered the endocrine pathways, as known for the IGF system, in order to survive (Fowden et al., Reference Fowden, Giussani and Forhead2005; De Vos et al., Reference De Vos, Che, Huygelen, Willemen, Casteleyn, Van Cruchten and Van Ginneken2013). As serotonin enhances growth hormone secretion, which in turn stimulates IGF production (Musumeci et al., Reference Musumeci, Travato, Avola, Imbesi and Castrogiovanni2013), we hypothesise that this altered endocrine balance is reflected in an altered intestinal distribution of enterochromaffin cells. In the blood circulation, the free fraction of tryptophan (FFT) is an important marker for encephalic 5-HT synthesis, whereas most of 5-HT in blood is derived from the gastrointestinal tract (Erspamer and Testini, Reference Erspamer and Testini1959; Tagliamonte et al., Reference Tagliamonte, Biggio, Vargiu and Gessa1973; Manjarrez et al., Reference Manjarrez, Contreras, Chagoya and Hernandez1998). Intriguingly, infants and rats suffering from IUGR show elevated plasma FFT levels compared with normal weight (NW) infants and littermates (Hernandez et al., Reference Hernandez, Manjarrez and Chagoya1989). Moreover, IUGR impairs gastrointestinal morphology in neonatal pigs (Wang et al., Reference Wang, Huo, Shi, Xu and Hutz2005; D’Inca et al., Reference D’Inca, Che, Thymann, Sangild and Le Huerou-Luron2010a). As 5-HT promotes mucosal growth (Gershon, Reference Gershon2013), we hypothesise that the possible altered 5-HT levels in the SGA piglets affect the intestinal morphology in these piglets.
To conclude, the aims of this study were to investigate whether the perinatal intestinal distribution of 5-HT cells is altered in SGA pigs compared to their normal littermates. Moreover, 5-HT synthesis from both the periphery and the brain were compared in normal and SGA pigs during postnatal development by analysing serum 5-HT and FFT levels. Finally, we determined the impact of IUGR on the morphological growth pattern of the different intestinal layers.
Material and methods
Animals and experimental design
Piglets with BW ranging within 0.5 s.d. of the mean litter BW were considered as NW piglets, whereas piglets with BW lower than 1.5 s.d. of the mean litter BW were defined as SGA piglets as described previously (D’Inca et al., Reference D’Inca, Kloareg, Gras-Le Guen and Le Huerou-Luron2010b; Willemen et al., Reference Willemen, Che, De Vos, Huygelen, Tambuyzer, Casteleyn, Van Cruchten, Zhang and Van Ginneken2012). Mean BWs of the different age and BW groups are shown in Table 1. Across all age groups, the NW piglets had a significantly higher BW, but in some groups the differences were larger than others (Table 1). Pig foetuses (PF) (90 to 115 days of gestation) were obtained from a local slaughterhouse. Their ages were estimated by measuring the crown-rump lengths (Evans and Sack, Reference Evans and Sack1973). Postnatal pigs from different days of age (d0, d3, d10 and d28) were collected at a local farm from multiparous sows (Finnish Yorkshire×Belgian Landrace) and transferred within 30 min to the laboratory of Applied Veterinary Morphology. Euthanasia of these piglets was carried out by severing the carotid arteries under deep barbiturate anaesthesia (sodium pentobarbital, 200 mg/kg; Kela Laboratoria, Hoogstraten, Belgium) immediately upon arrival. Age- and gender-matched pairs consisting of a NW and SGA piglet were selected. This resulted in five pairs of piglets per age group. The sample collection was organised as such that the paired NW and SGA piglets were processed simultaneously.
Mean BW of perinatal NW and SGA piglets

NW=normal weight; SGA=small-for-gestational age; PF=pig foetuses.
1 A significant interaction between age and weight was found, which means that the BW differences between the SGA and NW animals are not the same across the different age categories.
2 P-values upon splitting the data set according to age and testing for a difference in mean BW between NW and SGA in each separate age group.
This study was approved by the Ethical Committee on Animal Experimentation from the University of Antwerp.
Sample collection
Blood was collected from postnatal pigs by severing the carotid arteries after lethal barbiturate anaesthesia. After an incubation period of 20 min at room temperature (RT), the blood samples were centrifuged at 4°C at 1500×g for 10 min. After euthanasia, the gastrointestinal tract was immediately removed and kept on ice. Samples from the proximal and distal parts of the small intestine (SI) were taken as described previously (Willemen et al., Reference Willemen, De Vos, Huygelen, Fransen, Tambuyzer, Casteleyn, Van Cruchten and Van Ginneken2013). After rinsing in phosphate-buffered saline (PBS) (0.01 M, pH 7.4), these samples were fixated for 2 h in 4% paraformaldehyde at RT. The fixative was washed out with PBS overnight. A full thickness biopsy was taken from each sample (8 mm; Miltex, Plainsboro, NJ, USA). These were subsequently routinely processed to paraffin blocks. From each sample, vertical sections with a thickness of 4 μm were taken at systematically random positions (i.e. every fifth section) and processed for immunohistochemical and stereological analysis.
Immunohistochemistry
After rehydrating the sections, they were rinsed three times with Tris-buffered saline (TBS) (0.05 M, pH 7.4). Subsequently, endogenous peroxidase activity was depleted by incubation with 3% H2O2 in TBS for 10 min at RT. Non-specific staining was blocked by incubating for 1 h at RT with 20% normal swine serum diluted in TBS enriched with 0.3% Triton X-100 and 1% bovine serum albumin. Paraffin tissue sections were then incubated overnight (4°C) with a polyclonal rabbit anti-5-HT antibody (1/1000; Chemicon; Millipore, Billerica, MA, USA). Sections were rinsed and subsequently incubated with a biotinylated swine anti-rabbit antibody, diluted with the same buffer as normal swine serum (1/600, 2 h RT; Dako, Glostrup, Denmark). After a next rinsing step with TBS, the sections were immediately incubated with streptavidin-conjugated horseradish peroxidase (1/600, 2 h RT). After 2 wash steps for 5 min with TBS and 1 wash step for 5 min with distilled water, immunoreactive (IR) cells were visualised by incubating the sections with the chromogen 3,3′-diaminobenzidine (Dako). The sections were counterstained with Carazzi’s haematoxylin (Klinipath, Olen, Belgium), dehydrated and mounted with glycerol.
Stereological analysis
An Olympus BX50 microscope connected to a computer running the software program Cast 2 (Olympus, Copenhagen, Denmark) was used for the stereological analysis. One single investigator, blinded to the origin of the samples, performed the analysis.
From both the proximal and distal parts of the SI, the volume density of the tunica mucosa, tela submucosa and tunica muscularis (V v intestinal layer, reference volume: entire SI wall) was estimated by using a point grid at magnification 200×. The following equation was used to calculate V v (intestinal layer, SI wall):
 $$\eqalign{V_{v} \left( {{\rm intestinal}\,{\rm layer},\,{\rm SI}\,{\rm wall}} \right)= \,[\Sigma \,P\left( {{\rm intestinal}\,{\rm layer}} \right)/ \cr \Sigma P\left( {{\rm SI}\,{\rm wall}} \right)]$$
where ΣP (intestinal layer) is the number of points coinciding with the specific layer and ΣP (SI wall) the number of points coinciding with the entire wall of the SI.
In both the proximal and distal parts of the SI, the volume density of the epithelial serotonin IR cells was estimated. The stereological equation used to calculate the volume density (V V 5-HT IR cells, epithelial layer) was defined as:
 $$V_{V} \left( {5{\hbox{-}}{\rm HT}\,{\rm IR}\,{\rm cells},\,{\rm epithelial}\,{\rm layer}} \right)\,=\,[\Sigma P\,\left( {5{\hbox{-}}{\rm HT}\,{\rm IR}\,{\rm cells}} \right)/\Sigma P\left( {{\rm epithelial}\,{\rm layer}} \right)]$$
ΣP (5-HT IR cells) is the number of points hitting the IR 5-HT epithelial cells and ΣP (epithelial layer) the number of points hitting the epithelial layer of the tunica mucosa.
The optimal density of the stereological grid (number of points), the number of sections and the number of fields were estimated as described previously and resulted in analysing ~30 fields of vision in at least 15 systematic random sections of each tissue block (Gundersen and Jensen, Reference Gundersen and Jensen1987).
Serological analysis
Serum 5-HT levels were measured by a multispecies ELISA according to the manufacturer’s protocol (Enzo Life Sciences, Lorrach, Germany) as described previously (Willemen et al., Reference Willemen, Che, De Vos, Huygelen, Tambuyzer, Casteleyn, Van Cruchten, Zhang and Van Ginneken2012).
For the analysis of total tryptophan, the proteins present in 30 μl serum were precipitated with 60 μl perchloric acid (0.4 M). Afterwards, the samples were centrifuged for 5 min at 12 100×g at RT and the supernatant was used for HPLC analysis. FFT was recovered by first ultrafiltrating the serum samples using an Amicon Ultra 0.5 ml 50 K centrifugal filter (Millipore, Overijse, Belgium) and was further prepared analogously to the total tryptophan procedure before analysis. The difference between total and FFT was considered to be the fraction bound to albumin as described previously (Manjarrez et al., Reference Manjarrez, Cisneros, Herrera, Vazquez, Robles and Hernandez2005).
Serum tryptophan concentrations were measured by isocratic reversed-phase liquid chromatography using a C18 4 μm Nova-Pak (Waters S.A.S., Saint Quentin, France) and detected with a 2487 dual absorbance UV detector (Waters S.A.S.) at 273 nm. The mobile phase consisted of 90% MilliQ, 10% acetonitrile and phosphoric acid (pH 2.7) at a flow rate of 1 ml/min. This protocol is based on a recently published study (Sultana et al., Reference Sultana, Arayne, Khan, Saleem and Mirza2012). Following tryptophan dilutions were used to create a standard curve: 7, 5, 3, 1, 0.5 and 0.25 μg/ml. The concentrations are determined by the molar extinction coefficient of 5600 per M.cm of 1 M tryptophan at 280 nm.
Statistical analysis
The effects of weight, age and intestinal region on the different outcome parameters were studied by fitting linear mixed models. To account for the relatedness between observations within the same litter and within the same individual, random intercept terms for litter and individual, nested within litter, were added to the model. Adding random slope terms for weight and region did not lead to a significant improvement in the model fit for any of the variables tested. To fit the optimal regression model for the fixed effects, a stepwise backward model-building strategy was applied, starting from a model that included main effect terms for weight, region and age (as a categorical variable), as well as their two-way interactions.
Significance of the fixed effect terms in the equation was tested using the F-test with a Kenward–Roger correction for the numbers of degrees of freedom. In case one of the factors (age category or region) was significant, a post hoc test was conducted with a Tukey correction for multiple testing. A P-value below 0.05 was considered significant.
All statistical calculations were performed in the software package R version 2.13.1. Mixed models were fit using the lme4 package. The F-test with Kenward–Roger correction was performed using the package pbkrtest, and the post hoc test with Tukey correction was carried out as implemented in the multcomp package. Graphs were generated using the lattice package.
Results
Serotonin enterochromaffin cells in the SI: stereological analysis
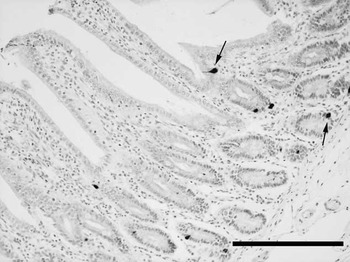
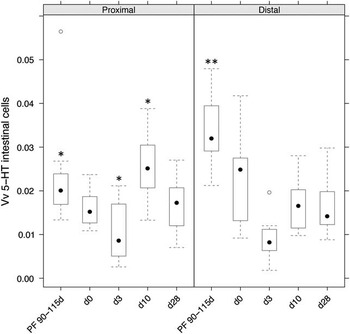
In general, 5-HT cells were distributed along the entire SI both prenatally and postnatally in NW and SGA piglets. The endocrine cells were located in the intestinal epithelium, covering crypts and villi (Figure 1). The volume density of the intestinal enterochromaffin cells showed a significant interaction between age and intestinal region (P=0.0001) (Figure 2). At the age of 3 days, the 5-HT cell volume density in the SI was consistently the lowest, but more pronounced differences between the age groups were observed in the distal SI. In the proximal region, the overall effect of age on enterochromaffin cell density was significant (P=0.008). Post hoc testing using a Tukey correction for multiple testing showed a significantly lower 5-HT cell volume density at day 3 compared to PF 90 to 115 days (P=0.001, mean difference=0.013) and a significantly higher enterochromaffin cell volume density at day 10 compared to day 3 (P<0.001, mean difference=0.015). None of the other pairwise comparisons was significant at the 0.05 level. In the distal region, the overall effect of age on 5-HT cell volume density was significant (P=0.0002). Post hoc testing using a Tukey correction showed that the enterochromaffin cell volume density value at PF 90 to 115 days was significantly higher compared with all postnatal values (Figure 2). Mean differences and P-values for each pair of comparison, which were significant at the 0.05 level, are given in Supplementary Table S1. The postnatal measurements showed no differences (Figure 2).
Serotonin immunoreactive cells (arrows) scattered in the epithelia of crypts and villi in the distal part of the SI of a NW day 28 piglet, scale bar=200 μm. NW=normal weight; SI=small intestine.

Volume density (V v ) of intestinal serotonin (5-HT) epithelial cells in relation to age. The V v is a dimensionless unit as it relates two volumes with the same unit (μm3/μm3). The data are grouped into two panels according to the small intestinal region where the endocrine cells are located. The sample size consists of five age- and gender-matched pairs of a NW and SGA piglet per age group. The 5-HT cell volume density was the lowest at day 3 in both the proximal as distal part of the SI. In the proximal part of the SI, the V v was significantly lower compared with the foetal and day 10 age groups (*, P⩽0.001). In the distal part of the SI, the foetal age group had the highest V v compared with all other age groups (**, P=0.0002). 5-HT=5-hydroxytryptamine; NW=normal weight; PF=pig foetuses; SGA=small-for-gestational age; SI=small intestine.

Serotonin and its precursor tryptophan: serological analysis
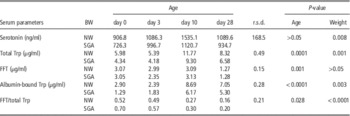
On average, NW piglets had more serum serotonin compared to the SGA littermates (P=0.008; Table 2). Similarly, total tryptophan serum concentrations of NW piglets were higher compared with SGA piglets (P=0.001; Table 2). The total tryptophan concentration also showed an age-dependent effect (P=0.0001; Table 2). More specifically, post hoc testing failed to show a difference between day 0 and day 3, but significant differences between all other age groups were observed. A marginal difference between day 0 and day 28 (P=0.05) was observed.
Effect of age on serum serotonin concentrations, its precursor free tryptophan (FFT), albumin-bound tryptophan, and total tryptophan in NW and SGA piglets

NW=normal weight; SGA=small-for-gestational age; Trp=tryptophan; FFT=free fraction of tryptophan.
When looking at FFT, post hoc analysis showed that piglets at day 28 had significantly lower FFT levels compared with piglets from all three other age groups (Table 2). For the albumin-bound fraction of tryptophan, statistical analysis was performed on log-transformed values as the outcome was strongly non-normal. NW piglets had on average a greater albumin-bound tryptophan fraction compared with SGA piglets (Table 2). The effect related to age for this fraction of tryptophan showed a difference between early (day 0 v. day 3) and late (day 10 v. day 28) age, with the later stages having a significantly higher concentration compared with the early stages (Table 2).
The outcome of the FFT/total tryptophan ratio was also strongly non-normal. Hence, statistical analyses were performed on log-transformed values. Significant main effects of age and weight were observed. The ratio FFT to total tryptophan was lower in NW piglets compared with SGA piglets (Table 2). As for the effect of age, a slightly linear decrease in outcome was observed with increasing age. Newborns (day 0) did not have significantly different FFT/total tryptophan ratios compared with day 3 piglets, but all other pairwise comparisons showed significant differences (Table 2).
Intestinal morphology
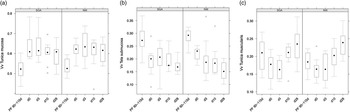
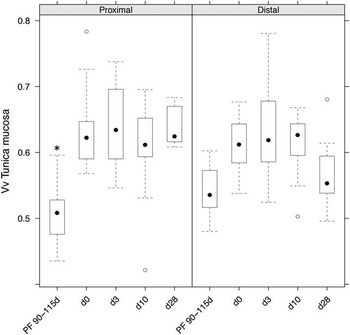
The volume densities of the different intestinal layers (tunica mucosa, tela submucosa and tunica muscularis) showed a similar morphological growth pattern in normal and SGA piglets (P>0.05) (Figure 3a, b and c). The volume density of the tunica mucosa showed a significant interaction between age and region (P=0.012) (Figure 4). A separate analysis in proximal and distal samples showed that during prenatal development (PF 90 to 115 days) the proximal samples had a significantly reduced volume density of the mucosal layer compared with the postnatal samples (P=0.0004) (Figure 4). In the distal samples there were no significant differences between prenatal and postnatal samples (P=0.10) (Figure 4).
Volume density (V v ) of the intestinal tunica mucosa (a), tela submucosa (b) and tunica muscularis (c) in relation to age. The V v is a dimensionless unit as it relates two volumes with the same unit (μm3/μm3). The data are grouped into two panels according to BW. The sample size consists of five age- and gender-matched pairs of a NW and SGA piglet per age group. There were no significant differences in V v of the three intestinal layers in NW and SGA piglets. NW=normal weight; PF=pig foetuses; SGA=small-for-gestational age.

Volume density (V v ) of the intestinal tunica mucosa in relation to age. The V v is a dimensionless unit as it relates two volumes with the same unit (μm3/μm3). The data are grouped into two panels according to the small intestinal region. The sample size consists of five age- and gender-matched pairs of a NW and SGA piglet per age group. The prenatal samples of the proximal SI had a significantly reduced V v of the mucosal layer compared with the postnatal samples (*, P=0.0004). NW=normal weight; PF=pig foetuses; SGA=small-for-gestational age; SI=small intestine.

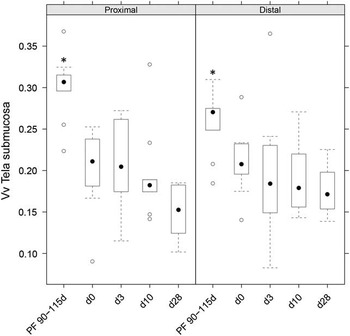
The volume density of the tela submucosa showed a main effect of age (P=0.002) (Figure 5). Post hoc testing showed that in contrast to the tunica mucosa, the tela submucosa volume densities of the foetal piglets were higher compared to those in postnatal piglets (Figure 5). Mean differences and P-values for each pair of comparison, which were significant at the 0.05 level, are given in Supplementary Table S2.
Volume density (V v ) of the intestinal tela submucosa in relation to age. The V v is a dimensionless unit as it relates two volumes with the same unit (μm3/μm3). The data are grouped into two panels according to the small intestinal region. The sample size consists of five age- and gender-matched pairs of a NW and SGA piglet per age group. The V v of the intestinal tela submucosa V v of the foetal piglets was higher compared with the tela submucosa V v in postnatal piglets. This finding is reflected in both the proximal and distal part of the SI (*, P=0.002). NW=normal weight; PF=pig foetuses; SGA=small-for-gestational age.

Significant effects of region (P=0.01) and age (P=0.001) were observed for the V v tunica muscularis. On average, the V v tunica muscularis is 0.017 higher in the distal region compared with the proximal region (P=0.01). Post hoc testing for age showed significant differences between PF 90 to 115 days and day 28 (P=0.04), day 0 and day 28 (P<0.001), day 3 and day 10 (P=0.03), and between day 3 and day 28 (P<0.001).
Discussion
The morphological results from this study demonstrated both region- and age-related differences in the SI. More specifically, the mucosa showed a postnatal increase in volume density, which was most pronounced in the proximal region. This is in accordance with previous data (Van Ginneken et al., Reference Van Ginneken, Van Meir and Weyns2002; Van Ginneken and Weyns, Reference Van Ginneken and Weyns2004). Similarly, a postnatal decrease of the V v tela submucosa (Van Ginneken and Weyns, Reference Van Ginneken and Weyns2004) and a drop of the V v tunica muscularis after birth have been described (Van Ginneken et al., Reference Van Ginneken, Van Meir and Weyns2002). Moreover, these authors also described a thicker tunica muscularis in the distal part of the SI (Van Ginneken et al., Reference Van Ginneken, Van Meir and Weyns2002). The thicker muscle layer in this intestinal region serves to pump the small intestinal chyme into the colon. Hence, our findings of the developing intestine in normal piglets correspond to previously published data. However, the developmental growth pattern, that is, the age-related changes of the various elements of the intestinal wall did not alter in SGA piglets. As such, this similarity between NW and SGA piglets corresponds to earlier observations on the growth pattern of the pars fundica of the stomach (Willemen et al., Reference Willemen, De Vos, Huygelen, Fransen, Tambuyzer, Casteleyn, Van Cruchten and Van Ginneken2013).
The present study showed that there were no significant differences in intestinal enterochromaffin cell densities between NW and SGA piglets. In contrast to earlier reports regarding the prevalence of 5-HT in the stomach of the postnatal piglet (Van Ginneken et al., Reference Van Ginneken, Weyns and van Meir2001), the volume density of the 5-HT cells in both the proximal and distal part of the SI tended to decrease with age, with the lowest values detected at 3 days postpartum. Similar results have also been demonstrated in an immunohistochemical study of the intestinal tract of the water buffalo (Lucini et al., Reference Lucini, De Girolamo, Coppola, Paino and Castaldo1999). As previously suggested, the decreasing volume density of the enterochromaffin cells might be caused by an increase in mucosal tissue volume per surface area after birth (Van Ginneken et al., Reference Van Ginneken, Van Meir and Weyns2002). However, this does not exclude the possibility that the higher density of 5-HT cells in the foetal small intestinal mucosa contributes to a higher bioavailability of 5-HT. In this way, it could play a role in the development of the foetal gastrointestinal system as a growth factor and neurotransmitter (Fiorica-Howells et al., Reference Fiorica-Howells, Maroteaux and Gershon2000; Gershon and Tack, Reference Gershon and Tack2007; Gershon, Reference Gershon2013). Ristine and Spear (Reference Ristine and Spear1984) have suggested an important role for 5-HT in the suckling ritual, based on their experiments in newborn rats, which might explain the high neonatal (day 0) density of 5-HT enterochromaffin cells seen in our study. Another possible explanation for the higher intestinal 5-HT cell density in foetal piglets is that this important peripheral 5-HT source can compensate for deficiencies in encephalic 5-HT production, since the prenatal blood brain barrier is immature (Trowbridge et al., Reference Trowbridge, Narboux-Neme and Gaspar2011).
NW piglets have higher serotonin serum concentrations compared with their SGA littermates. This is in accordance with previous data (Berman et al., Reference Berman, Justice and Hsia1965). These lower concentrations of 5-HT in SGA piglets might be attributed to a fall in the number of platelets, as already described in low birth weight infants (Christensen et al., Reference Christensen, Henry, Wiedmeier, Stoddard, Sola-Visner, Lambert, Kiehn and Ainsworth2006). Another study in foetal piglets also described lower foetal tryptophan concentrations in IUGR (Lin et al., Reference Lin, Liu, Feng, Fan, Dai, Lai, Li, Wu and Wang2012) and suggested this might be because of impaired amino acid transport through the placenta (Avagliano et al., Reference Avagliano, Garo and Marconi2012). Although the previous proposition correlates with our data describing lower total tryptophan levels in SGA piglets, we cannot rule out that this latter finding is owing to a lower feed intake in these piglets (Devillers et al., Reference Devillers, Farmer, Le Dividich and Prunier2007).
Other studies described an elevation of FFT and its ratio to total tryptophan (FFT/total tryptophan) in IUGR children (Manjarrez et al., Reference Manjarrez, Contreras, Chagoya and Hernandez1998; Hernandez-Rodriguez et al., Reference Hernandez-Rodriguez, Meneses, Herrera and Manjarrez2009). Interestingly, our results also described a higher FFT/total tryptophan ratio in SGA piglets. This altered ratio can be explained by the significantly higher total tryptophan concentrations caused by an elevated albumin-bound fraction detected in NW piglets. The binding capacity of l-tryptophan to plasma albumin has shown to be lower in infants with IUGR compared to normal controls (Hernandez-Rodriguez et al., Reference Hernandez-Rodriguez, Meneses, Herrera and Manjarrez2009). This might account for the lower albumin-bound fraction detected in our SGA samples.
Conclusions
The results from this study clearly demonstrate that 5-HT concentrations together with its precursor tryptophan are altered in the circulation of SGA piglets. This finding, however, is not reflected in a different distribution of enteroendocrine 5-HT cells in the SI of these SGA piglets. Hence, further research is necessary to find the source of the altered circulating 5-HT concentration in SGA piglets. Moreover, the adaptation of circulating tryptophan in SGA piglets suggests that, like in IUGR humans and rats, the central serotonergic system may also be disturbed in the SGA piglet. Since the level of tryptophan clearly has an impact on neuronal serotonin synthesis (Henry et al., Reference Henry, Seve, Colleaux, Ganier, Saligaut and Jego1992; Shen et al., Reference Shen, Voilque, Kim, Odle and Kim2012), the knowledge of lower tryptophan levels in SGA piglets might encourage further research concerning dietary tryptophan supplementation in these prenatal growth-restricted piglets.
Acknowledgements
The authors would like to thank Katty Huybrechts and Gunther Vrolix for their technical assistance. This work was supported by a special research fund of the University of Antwerp (grant number 3978).