Introduction
It is recognized that samples formed in reservoirs that are not directly supported by atmospheric CO2 can produce anomalies of several hundred years in their radiocarbon age. Our oceans are large reservoirs of radiocarbon on the Earth. Dissolved inorganic carbon (DIC) of the surface ocean exchanges radiocarbon (14C) with both the atmosphere and the deeper ocean. 14C is produced in the atmosphere, and through the air-sea exchange process it is transferred to DIC of the surface ocean. When these surface ocean waters sink to deeper depths, they do not further exchange 14C from the atmosphere for hundreds of years leading to radioactive decay of radiocarbon in these deep ocean waters (Broecker Reference Broecker1979; Matsumoto Reference Matsumoto2007). When these 14C-depleted deep ocean waters upwell to shallow depths, it decreases the 14C concentration of surface ocean water to an intermediate level between that of the atmosphere and deep ocean water. These processes ultimately deplete 14C in the marine reservoir relative to the atmosphere resulting in a reservoir effect (Alves et al. Reference Alves, Macario, Ascough and Bronk Ramsey2018). This is reflected as the marine 14C age offset relative to the 14C age of contemporary atmospheric CO2, that is the marine reservoir age. This marine reservoir age makes the radiocarbon age of marine samples appear older than the contemporary terrestrial samples.
The 14C depletion of surface ocean DIC relative to the atmosphere varies both spatially and temporally due to ocean dynamics, factors influencing the air-sea exchange process, and broader variations in the carbon cycle (Heaton et al. Reference Heaton, Köhler, Butzin, Bard, Reimer, Austin, Bronk Ramsey, Grootes, Hughen, Kromer, Reimer, Adkins, Burke, Cook, Olsen and Skinner2020). These varying 14C depletions in marine reservoirs must be known and accounted for to accurately calibrate the radiocarbon age of any marine samples. Marine reservoir corrections can be estimated by radiocarbon dating pre-bomb known-age marine samples. For this purpose, known-age pre-bomb marine mollusk shells have been commonly investigated in different parts of the world ocean (Alves et al. Reference Alves, Macario, Souza, Pimenta, Douka, Oliveira, Chanca and Angulo2015; Berkman and Forman, Reference Berkman and Forman1996; DiNapoli et al. Reference DiNapoli, Fitzpatrick, Napolitano, Rick, Stone and Jew2021; Dutta et al. Reference Dutta, Bhushan and Somayajulu2001; Mangerud and Gulliksen, Reference Mangerud and Gulliksen1975; Petchey et al. Reference Petchey, Phelan and Peter White2004; Siani et al. Reference Siani, Paterne, Arnold, Bard, Métivier, Tisnerat and Bassinot2000; Ulm et al. Reference Ulm, O’Grady, Petchey, Hua, Jacobsen, Linnenlucke, David, Rosendahl, Bunbury, Bird and Reimer2023; Yoneda et al. Reference Yoneda, Uno, Shibata, Suzuki, Kumamoto, Yoshida, Sasaki, Suzuki and Kawahata2007). Other pre-bomb marine samples like corals (Bolton et al. Reference Bolton, Goodkin, Druffel, Griffin and Murty2016; Hideshima et al. Reference Hideshima, Matsumoto, Abe and Kitagawa2001; Hirabayashi et al. Reference Hirabayashi, Yokoyama, Suzuki, Miyairi and Aze2017; Hua et al. Reference Hua, Woodroffe, Barbetti, Smithers, Zoppi and Fink2004; Raj et al. Reference Raj, Bhushan, Muruganantham, Nambiar and Dabhi2020), fish bones (Divola et al. Reference Divola, Simms, Sremba, Baker, Friedlaender and Southon2024; Mangerud et al. Reference Mangerud, Bondevik, Gulliksen, Karin Hufthammer and Høisæter2006; Petchey and Clark Reference Petchey and Clark2010), fish otoliths (Higham and Hogg Reference Higham and Hogg1995), marine mammal bones (Dyke et al. Reference Dyke, Savelle, Szpak, Southon, Howse, Desrosiers and Kotar2019; Olsson Reference Olsson1980) have also been analyzed to estimate marine reservoir correction values.
In the northern Indian Ocean region, pre-bomb marine 14C data has been reported earlier from different regions to constrain the marine reservoir correction values (Dutta et al. Reference Dutta, Bhushan and Somayajulu2001; Lindauer et al. Reference Lindauer, Marali, Schöne, Uerpmann, Kromer and Hinderer2017a, Reference Lindauer, Santos, Steinhof, Yousif, Phillips, Jasim, Uerpmann and Hinderer2017b, Reference Lindauer, Händel and Magee2025; Raj et al. Reference Raj, Bhushan, Muruganantham, Nambiar and Dabhi2020; Southon et al. Reference Southon, Kashgarian, Fontugne, Metivier and Yim2002; Staubwasser et al. Reference Staubwasser, Sirocko, Grootes and Erlenkeuser2002; Von Rad et al. Reference Von Rad, Schaaf, Michels, Schulz, Berger and Sirocko1999; Zazzo et al. Reference Zazzo, Munoz, Saliège and Moreau2012, Reference Zazzo, Munoz, Badel, Béguier, Genchi and Marcucci2016). These estimates show that the marine reservoir ages in the region vary temporally and spatially (Dutta et al. Reference Dutta, Bhushan and Somayajulu2001; Lindauer et al. Reference Lindauer, Santos, Steinhof, Yousif, Phillips, Jasim, Uerpmann and Hinderer2017b; Raj et al. Reference Raj, Bhushan, Muruganantham, Nambiar and Dabhi2020; Southon et al. Reference Southon, Kashgarian, Fontugne, Metivier and Yim2002; Staubwasser et al. Reference Staubwasser, Sirocko, Grootes and Erlenkeuser2002). Available temporal records indicated high and variable marine reservoir ages in the northern and northwestern Arabian Sea since the Younger Dryas (Lindauer et al. Reference Lindauer, Santos, Steinhof, Yousif, Phillips, Jasim, Uerpmann and Hinderer2017b, Reference Lindauer, Händel and Magee2025; Staubwasser et al. Reference Staubwasser, Sirocko, Grootes and Erlenkeuser2002). However, these temporal records are restricted only to the northern and northwestern Arabian Sea in the northern Indian Ocean region, and no other such long temporal records are available from other parts of the northern Indian Ocean region. Better spatial coverage of the marine reservoir age estimates in the northern Indian Ocean is available for only about last 200 years (Dutta et al. Reference Dutta, Bhushan and Somayajulu2001; Raj et al. Reference Raj, Bhushan, Muruganantham, Nambiar and Dabhi2020; Southon et al. Reference Southon, Kashgarian, Fontugne, Metivier and Yim2002; Von Rad et al. Reference Von Rad, Schaaf, Michels, Schulz, Berger and Sirocko1999).
Broadly, the spatial distribution of these marine reservoir age data shows that the northwestern Indian Ocean surface water has low pre-bomb 14C levels and thus high marine reservoir age compared to the northeastern Indian Ocean (Dutta et al. Reference Dutta, Bhushan and Somayajulu2001; Southon et al. Reference Southon, Kashgarian, Fontugne, Metivier and Yim2002). The ocean circulation in the northern Indian Ocean is complex and changes with the seasons. In the summer monsoon season, the southwest monsoon current flows eastward, transporting saltier Arabian Sea water into the Bay of Bengal. In contrast, during the winter monsoon season, the northeast monsoon current flows westward, carrying fresher Bay of Bengal water into the Arabian Sea (Schott et al. Reference Schott, Xie and McCreary2009; Shankar et al. Reference Shankar, Vinayachandran and Unnikrishnan2002). During the summer monsoon season, upwelling occurs in the Arabian Sea region (Schott et al. Reference Schott, Xie and McCreary2009) whereas the Bay of Bengal region receives large freshwater fluxes (Sengupta et al. Reference Sengupta, Raj and Shenoi2006; Varkey et al. Reference Varkey, Murty and Suryanarayana1996). These ocean dynamics can result in marine reservoir correction variations even at a smaller spatial scale. But, the spatial coverage of the marine reservoir correction estimates from the northern Indian Ocean region is still limited to clearly understand such marine reservoir age variations in the region (Dutta et al. Reference Dutta, Bhushan and Somayajulu2001; Raj et al. Reference Raj, Bhushan, Muruganantham, Nambiar and Dabhi2020; Southon et al. Reference Southon, Kashgarian, Fontugne, Metivier and Yim2002). This study provides the first estimate of marine reservoir corrections for the Lakshadweep Archipelago, located in the southeastern Arabian Sea of the northern Indian Ocean, using pre-bomb 14C data derived from a coral that grew in the region. Other estimates of marine reservoir corrections from the northern Indian Ocean are also discussed.
Methodology
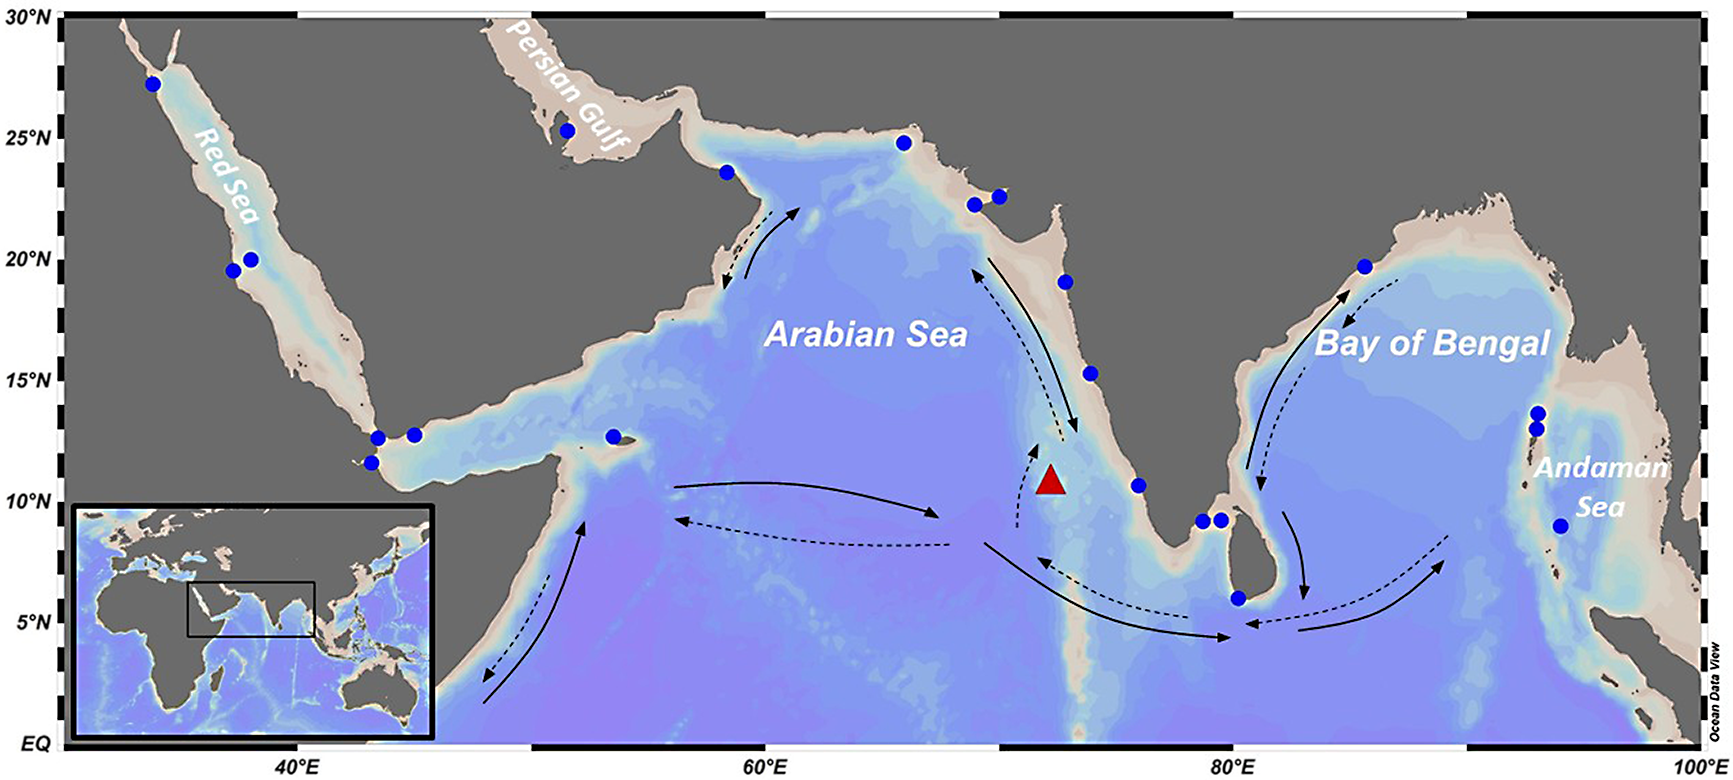
A coral core was collected from a live coral (Porites sp.) from Agatti Island (10° 50.063’N, 72° 10.833’E) in the Lakshadweep archipelago (Figure 1) in February 2015 using an underwater drill. The sampled coral was present at the water depth of 4 m. The collected coral skeleton core was sliced into a slab approximately 8 mm thick, which was then further sub-sampled using a hand-held drill. A total of 24 sub-samples were drilled, with each sample corresponding to about 3–4 mm in down-core length. Sub-sampling down-core intervals were set at 4 cm from the top 18 samples, and for the last 6 samples, the down-core interval was reduced to 2 cm. Approximately 10 mg of drilled coral skeleton powder was collected from each sub-sample for radiocarbon analysis. Coral skeleton powder was converted to graphite using Automated Graphitization Equipment (AGE3) (Wacker et al. Reference Wacker, Němec and Bourquin2010, Reference Wacker, Fülöp, Hajdas, Molnár and Rethemeyer2013). Primary standard Oxalic Acid (NBS OX II), along with secondary check standard (VIRI-R) (Scott et al. Reference Scott, Cook and Naysmith2010) and in-house coral standard (PRL-C) was also graphitized using AGE3. All graphitized samples and standards were pressed into targets and analyzed to measure their radiocarbon content using PRL Accelerator Mass Spectrometer (PRL-AURiS; Bhushan et al. Reference Bhushan, Yadava, Shah and Raj2019). The measured average value of the VIRI-R standard was 73.715 ± 0.208 pMC. It is in agreement with its consensus value of 73.338 ± 0.037 pMC (Scott et al. Reference Scott, Cook and Naysmith2010) within the 2σ range affirming good accuracy of the measurement.
Map showing the location of the coral sample site of Agatti Island (red triangle) in the Arabian Sea along with the location of other reported pre-bomb radiocarbon records in the northern Indian Ocean (blue circles). Ocean currents during the summer monsoon (solid arrow lines) and the winter monsoon season (dashed arrow lines) (Inset: location of study area in the Indian Ocean). Map was created using ODV (Schlitzer Reference Schlitzer2023).

Figure 1 Long description
The map displays the location of the coral sample site at Agatti Island, marked by a red triangle, in the Arabian Sea. It also shows the locations of other reported pre-bomb radiocarbon records in the northern Indian Ocean, indicated by blue circles. The map includes arrows representing ocean currents during the summer monsoon season with solid lines and during the winter monsoon season with dashed lines. An inset in the lower left corner shows the location of the study area within the Indian Ocean. The map was created using ODV software.
Results
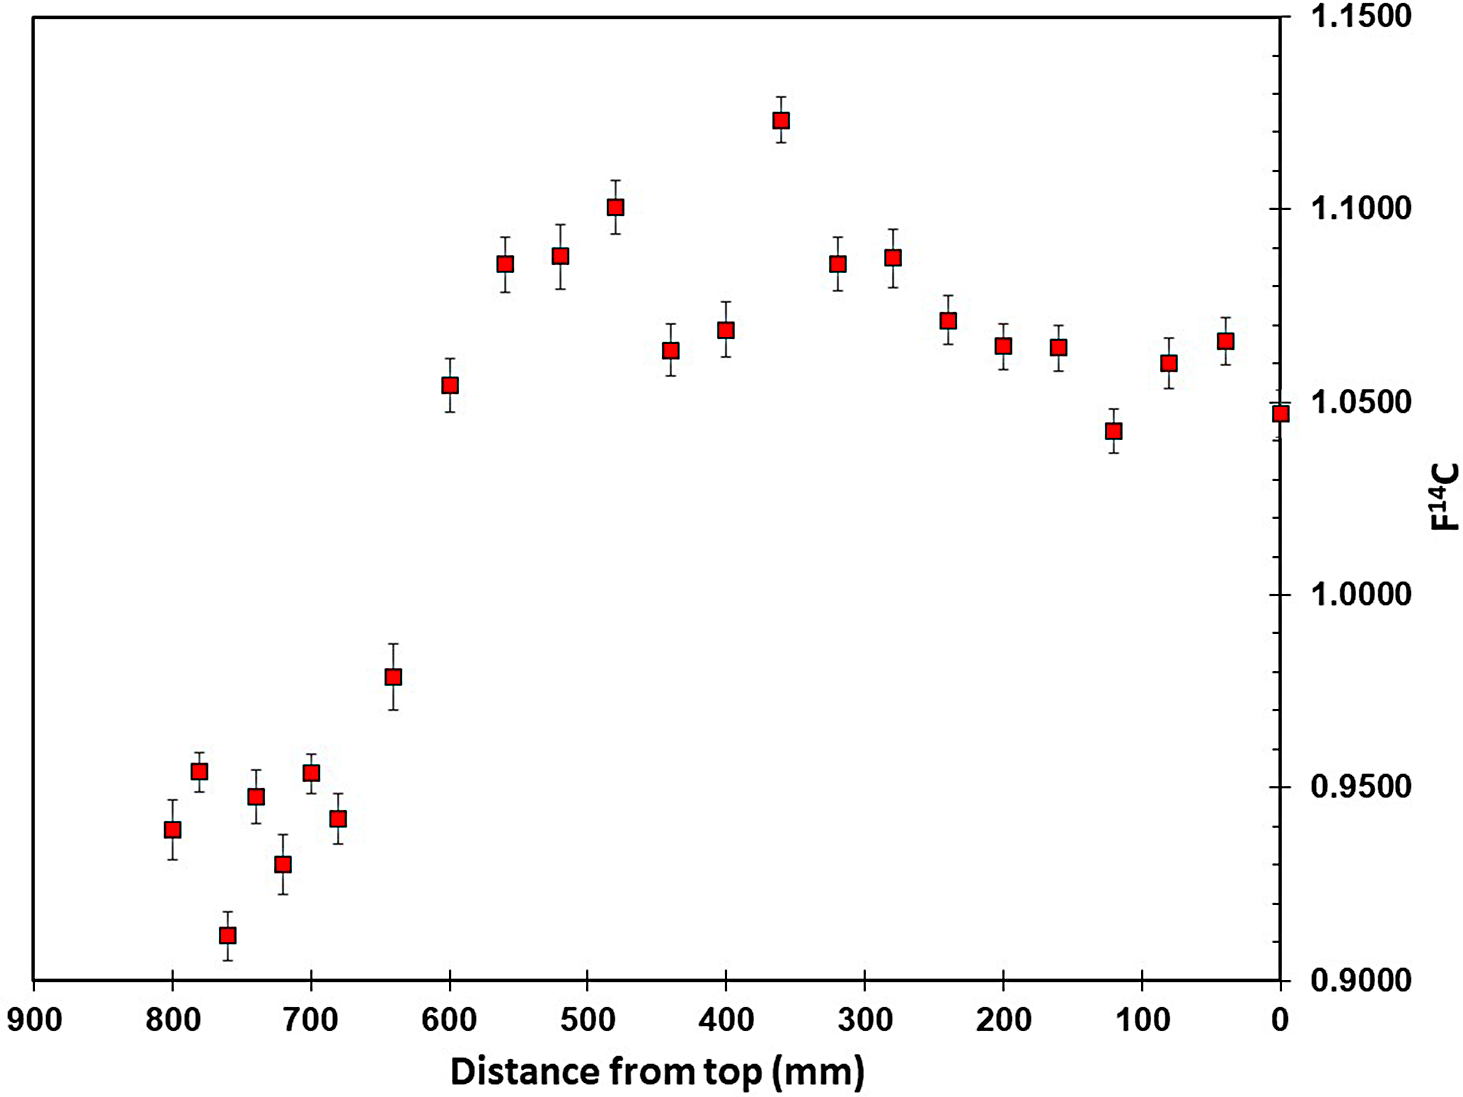
Figure 2 shows the radiocarbon concentration in Agatti coral samples in units of F14C (fraction modern). The F14C value of the topmost sample of the coral is 1.0468 ± 0.0061 (Supplementary Table T1). As we go down the depth of the coral core (towards older samples), sample’s radiocarbon values initially showed an increasing trend followed by a sharp decline (Figure 2). This sharp change in radiocarbon values of coral samples demarcates the separation between the pre-bomb and bomb radiocarbon levels of the Lakshadweep region. Pre-bomb F14C values obtained from Agatti coral ranged between 0.9116 ± 0.0065 and 0.9541 ± 0.0051. These values are useful in calculating the first marine reservoir correction estimate from the Lakshadweep region. The marine reservoir correction is the difference between the regional and the modeled global marine reservoir ages. It can be estimated using the following equation:
 $$\Delta R = P - Q$$
Radiocarbon concentration (F14C) in coral from Agatti Island in Lakshadweep archipelago

Figure 2 Long description
A scatter plot with error bars showing radiocarbon concentration (F14C) in coral from Agatti Island in Lakshadweep archipelago. The x-axis represents the distance from the top in millimeters, ranging from 0 to 900 millimeters. The y-axis represents the F14C values, ranging from 0.9000 to 1.1500. The plot includes several data points with error bars, indicating the variability in measurements. The data points show a general trend with some clusters and variations across the distance range. All values are approximated.
where P is the radiocarbon age of a known-age marine sample and Q is the modeled age of the same marine sample based on the marine calibration curve (Alves et al. Reference Alves, Macario, Ascough and Bronk Ramsey2018; Stuiver et al. Reference Stuiver, Pearson and Braziunas1986). According to equation (1) the modeled age of the known-age marine sample is required to calculate the marine reservoir correction value. To determine this modeled age from a marine calibration curve, the calendar age of the sample must first be known. One way to estimate the calendar age in a coral sample is by counting the annual skeletal density band in the coral core from the core top, which represents the year of collection for a live coral sample. But the coral skeletal density band counting could not be used to ascertain the calendar age of the samples because it was visually difficult to differentiate between inter-annual bands from intra-annual bands (Supplementary Figure S1). Additionally, the absence of any stable oxygen isotope or trace element record of the Agatti coral makes it difficult to determine the exact calendar age of the respective coral sample.
In this particular case, bomb-radiocarbon record in itself can be useful in constraining the calendar age of the coral radiocarbon values. It is a unique tracer that was mainly produced in the Earth’s atmosphere in the late 1950s and the early 1960s (Hua et al. Reference Hua, Turnbull, Santos, Rakowski, Ancapichún, De Pol-Holz, Hammer, Lehman, Levin, Miller, Palmer and Turney2022) and transferred to the surface ocean through the air-sea CO2 exchange process. In the Indian Ocean, all coral radiocarbon records also show a sharp increase in radiocarbon concentrations during the late 1950s and the early 1960s (Raj et al. 2022). This information can be utilized to constrain the calendar age of the analyzed coral sample from the Indian Ocean.
We know the depth (mm) of each coral sample used for radiocarbon analysis and by assuming a mean growth rate value (mm/yr) the chronology of the coral radiocarbon record can be modeled. Previously reported average growth rate of Porites corals from the Lakshadweep archipelago ranged from about 10 mm/yr to 25 mm/yr (Ahmad et al. Reference Ahmad, Padmakumari, Raza, Venkatesham, Suseela, Sagar, Chamoli and Rajan2011, Reference Ahmad, Farnaaz, Sagar, Raza and Venkatesham2014; Beja et al. Reference Beja, Raza, Masood Ahmad, Ahmed and Banerjee2024; Chakraborty and Ramesh Reference Chakraborty and Ramesh1993, Reference Chakraborty and Ramesh1997; Raj et al. Reference Raj, Bhushan, Kumar, Banerji, Shah and Verma2022b; Sagar et al. Reference Sagar, Hetzinger, Pfeiffer, Ahmad, Dullo and Garbe-Schönberg2016) and Agatti coral growth rate is expected to be within this range. In the applied age model, the topmost sample is assigned the year 2015, which is the year of coral sampling. For simplicity, we have assumed that the growth rate of the coral remained constantFootnote 1 . Using different possible mean growth rate values and the sample depth value, the calendar year of each sample is calculated. These reconstructed chronologies of the Agatti coral radiocarbon record are then compared with other radiocarbon records of corals of the region to constrain the possible mean growth rate of the coral and the calendar age of the coral samples.
When we considered the mean growth rate value of 10.5 mm/yr or lower, the modeled chronology indicated that the surface seawater radiocarbon values started to increase before 1954. But the atmospheric bomb radiocarbon concentration increase began in the year 1955 (Hua et al. Reference Hua, Turnbull, Santos, Rakowski, Ancapichún, De Pol-Holz, Hammer, Lehman, Levin, Miller, Palmer and Turney2022). As the source of bomb radiocarbon to the ocean is the atmosphere, bomb radiocarbon values in the surface seawater cannot increase before its increase in the atmosphere. This observation indicated that the analyzed Agatti coral sample’s mean growth rate must be greater than 10.5 mm/yr. Recently, Raj and Bhushan (Reference Raj and Bhushan2021) had reported a coral radiocarbon record from Kadmat Island in Lakshadweep archipelago, spanning from 1977 to 2014, showing post-bomb radiocarbon peak decline. This record indicated that the sharp bomb-radiocarbon rise in the surface seawater of the Lakshadweep region happened before 1977. Modeled chronology showed that an average growth rate of 16 mm/yr or more for Agatti coral placed the sharp bomb-radiocarbon rise after 1977. Therefore, the average growth rate of Agatti coral must be less than 16 mm/yr. Therefore, the possible mean growth rate of Agatti coral for the analyzed time period should have been between 10.5 mm/yr and 16 mm/yr.
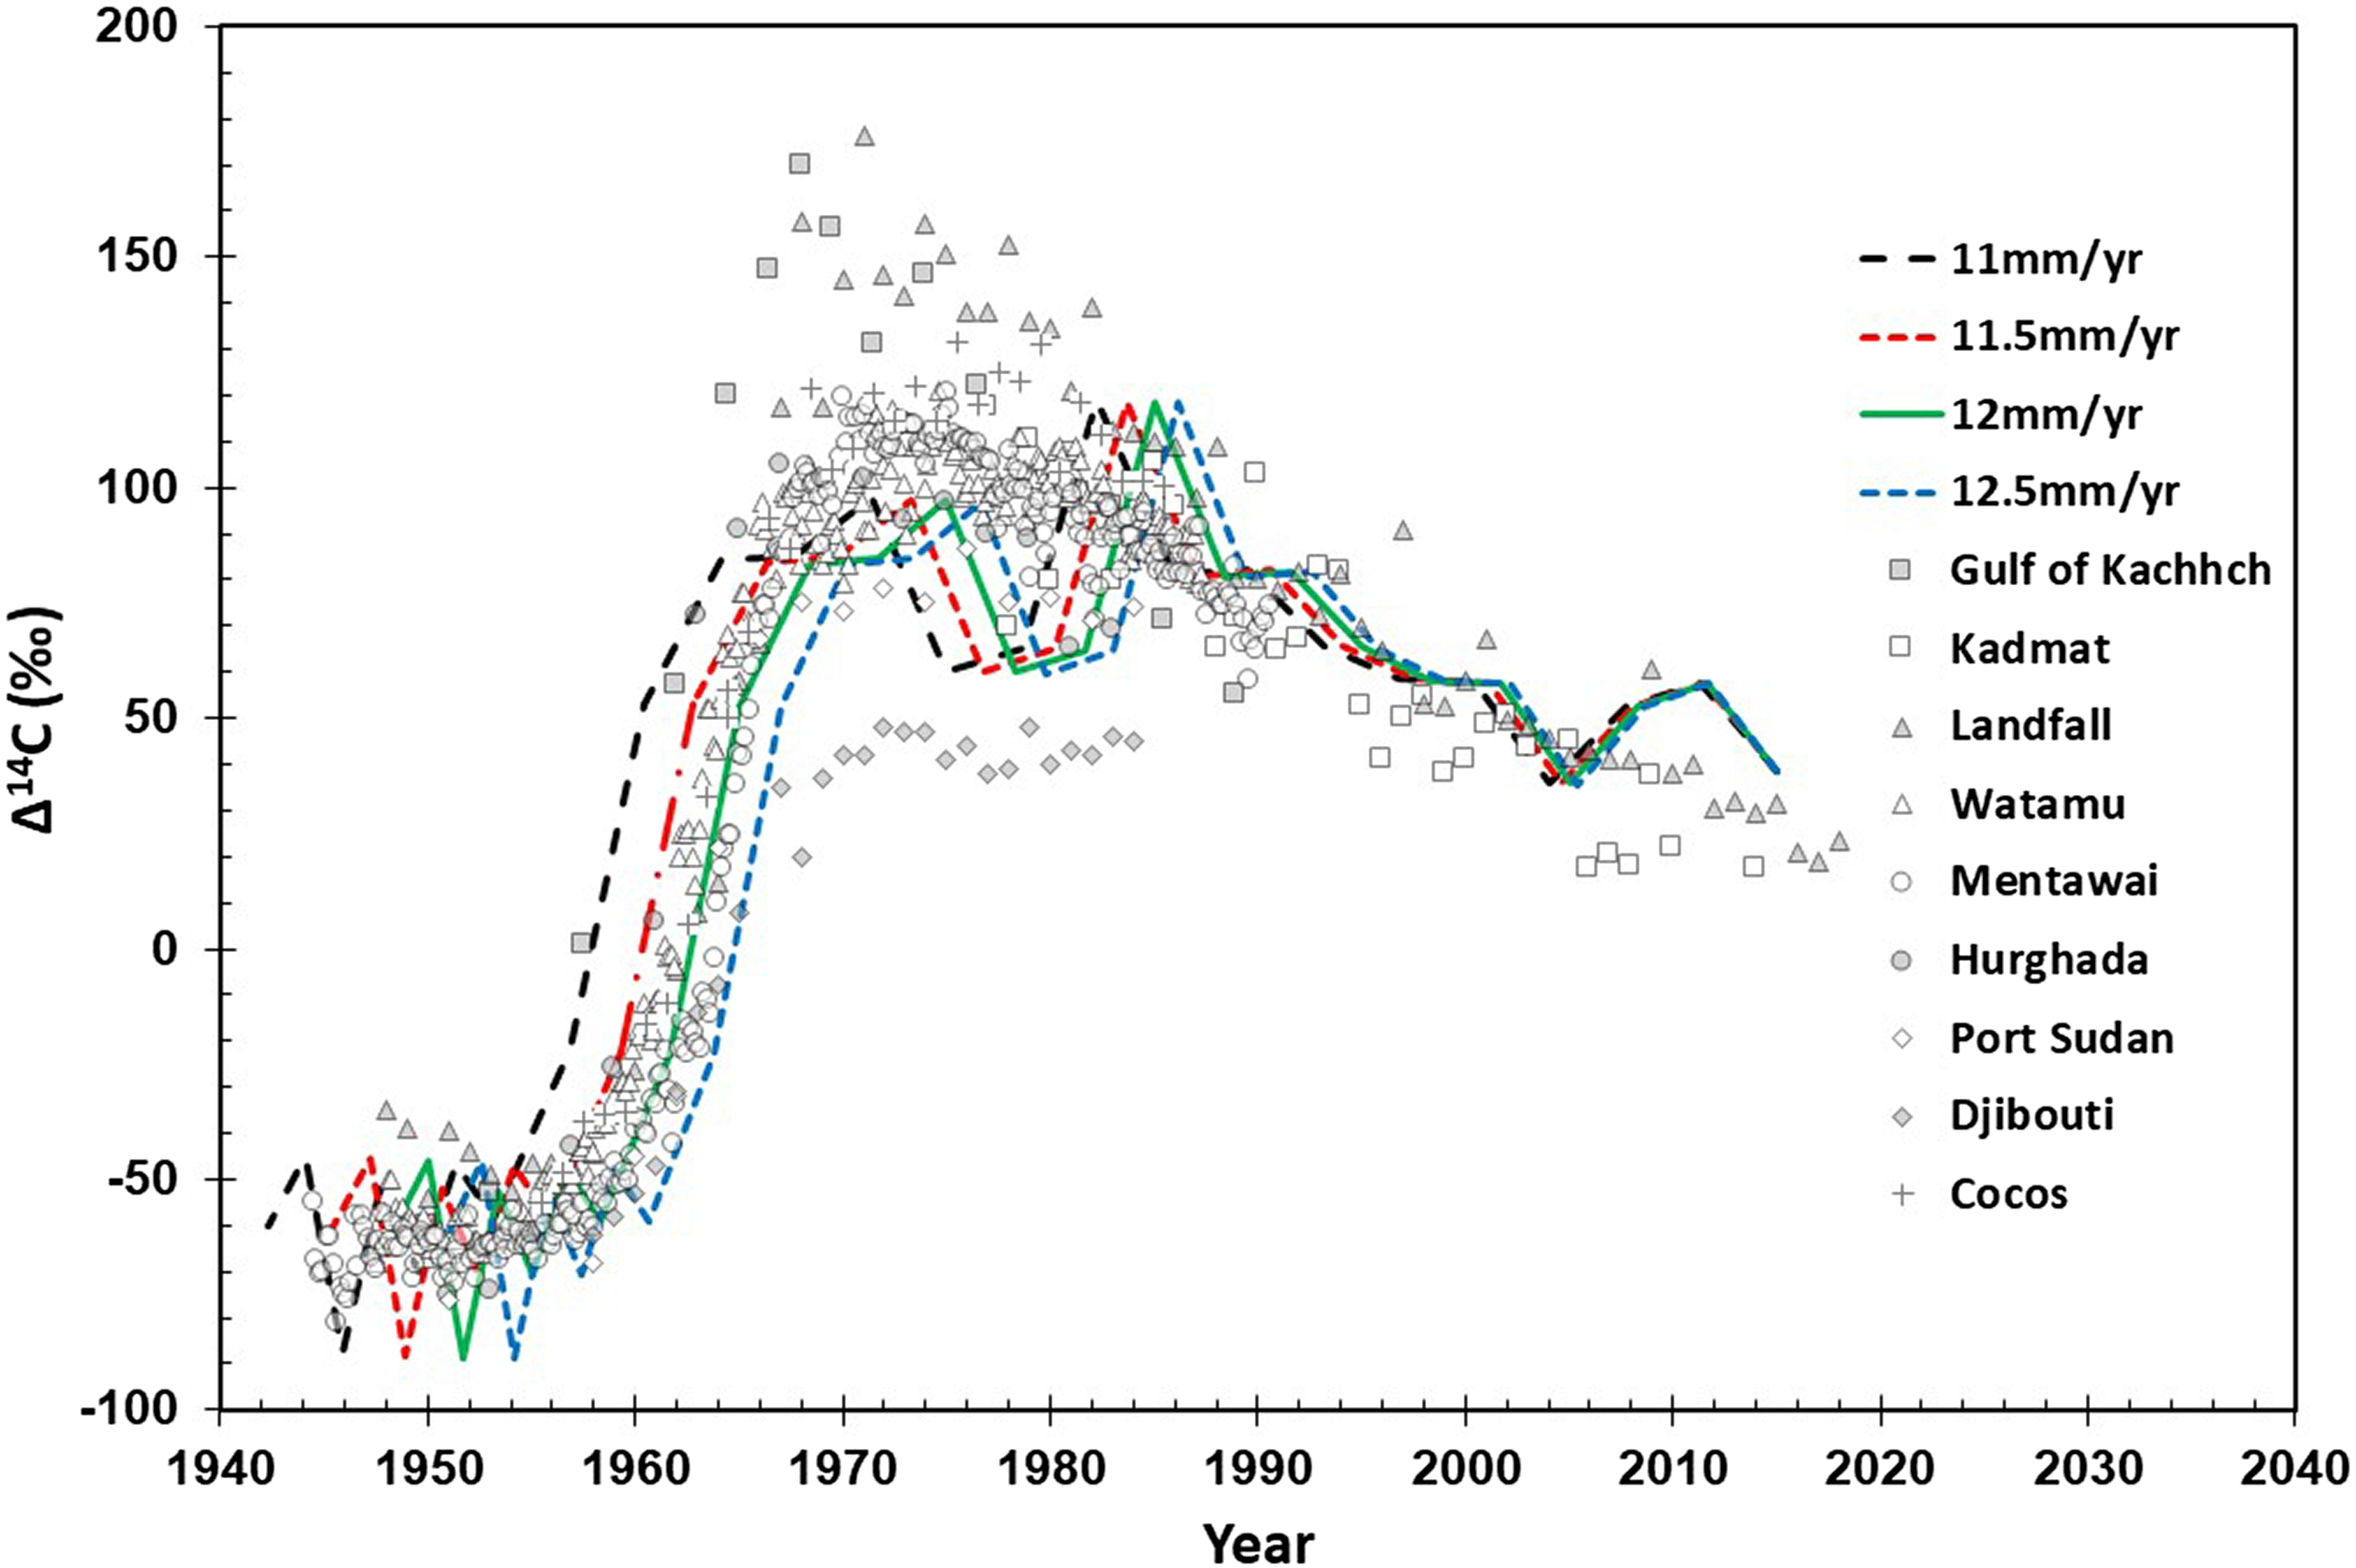
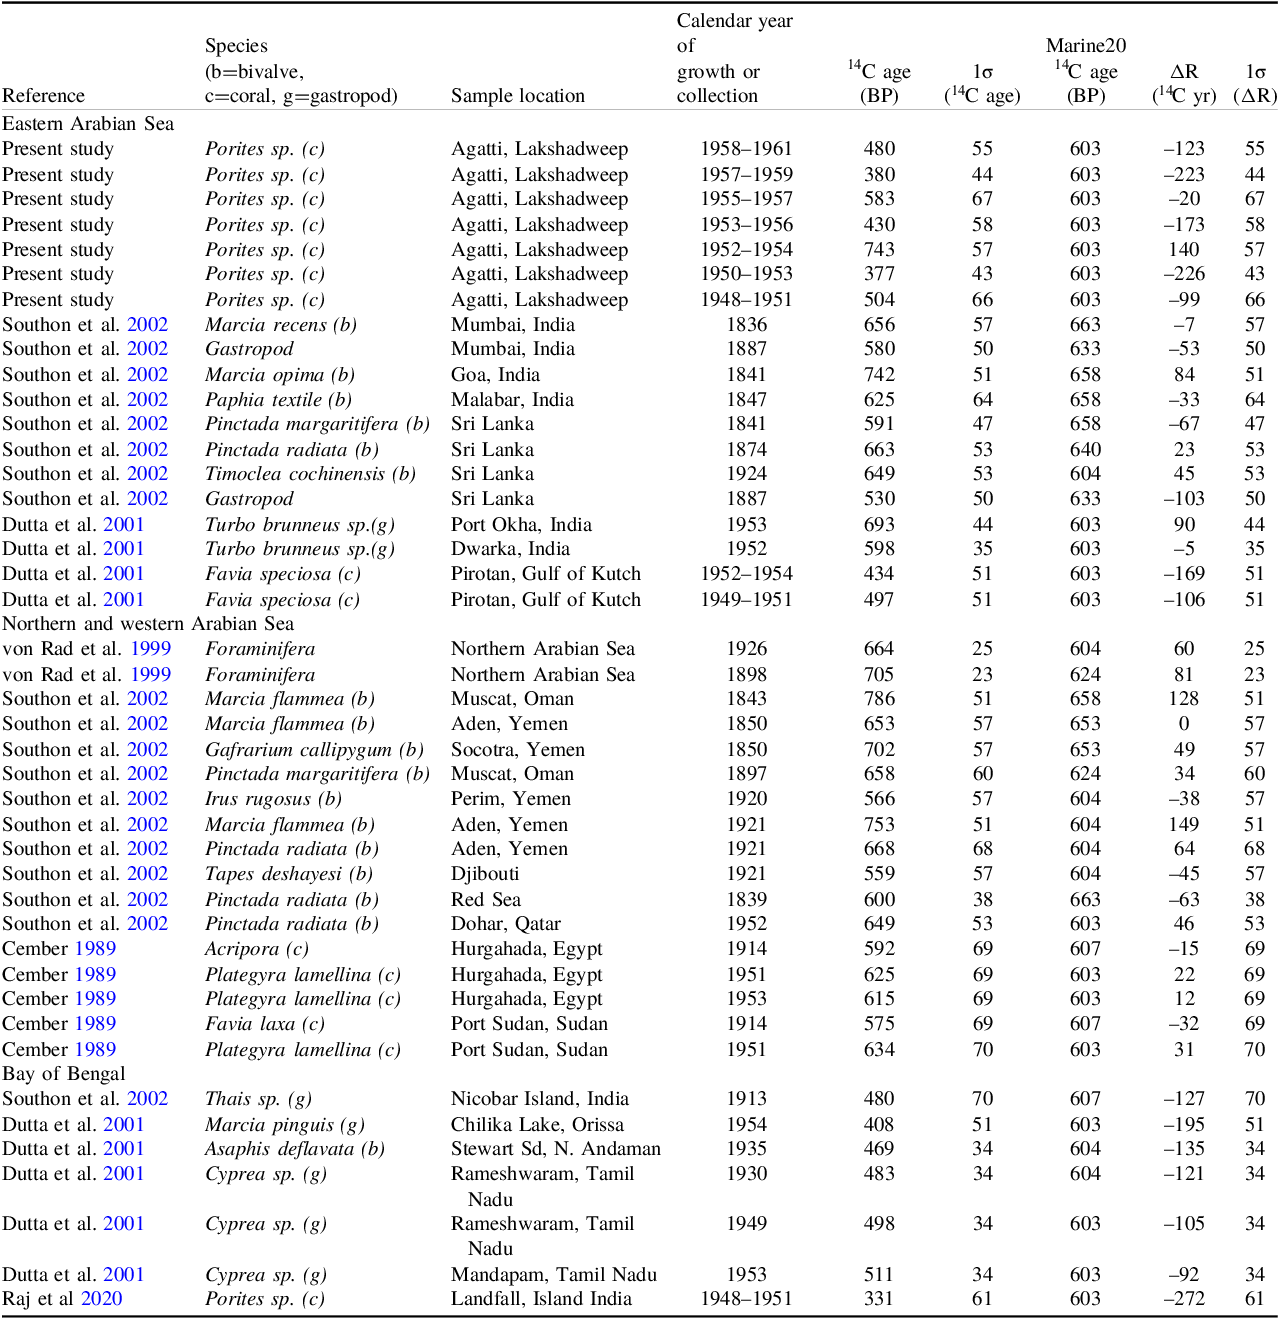
Different mean growth rate values within this range were used to reconstruct different possible chronologies of the Agatti coral radiocarbon record. These possible chronologies of the Agatti coral record were compared with other available coral radiocarbon records from the Indian Ocean (Cember Reference Cember1989; Chakraborty et al. Reference Chakraborty, Ramesh and Krishnaswami1994; Grumet et al. Reference Grumet, Guilderson and Dunbar2002, Reference Grumet, Abram, Beck, Dunbar, Gagan, Guilderson, Hantoro and Suwargadi2004; Hua et al. Reference Hua, Woodroffe, Smithers, Barbetti and Fink2005; Raj and Bhushan Reference Raj and Bhushan2021). All Indian Ocean coral records showed a sharp bomb-radiocarbon increase around the early 1960s except the Gulf of Kachchh coral which showed a sharp bomb-radiocarbon rise in the late 1950s. Modeled chronology indicated that the sharp increase in Agatti coral radiocarbon record would fall in the time range of the late 1950s to early 1960s if Agatti coral’s mean growth rate value were between 11 mm/yr and 12.5 mm/yr (Figure 3). To further constrain the mean growth rate value, the Kadmat coral radiocarbon record, which is from the same region, can be compared with the Agatti coral radiocarbon record. Different chronologies of the Agatti coral radiocarbon record based mean growth rate values between 11 mm/yr and 12.5 mm/yr were compared with the Kadmat coral radiocarbon record for the period between 1977 and 2014. The comparison shows that the best fit (lowest χ2 value) between the two Lakshadweep radiocarbon records is achieved when a mean growth rate of 12 mm/yr or 12.5 mm/yr is considered for calculating the Agatti coral chronology. This observation indicates that the analyzed Agatti coral’s mean growth rate should have been between 12 mm/yr and 12.5 mm/yr. Therefore, the possible calendar age range of Agatti coral’s pre-bomb radiocarbon values was estimated using the mean growth rate of 12 mm/yr and 12.5 mm/yr. Table 1 shows the calendar age of the pre-bomb radiocarbon record of Agatti coral and other reported pre-bomb records from the Arabian Sea region, along with calculated ΔR values. To estimate ΔR values from the Agatti coral, the Marine20 calibration curve (Heaton et al. Reference Heaton, Köhler, Butzin, Bard, Reimer, Austin, Bronk Ramsey, Grootes, Hughen, Kromer, Reimer, Adkins, Burke, Cook, Olsen and Skinner2020) was used. For comparison, reported ΔR values from other sites in the northern Indian Ocean over the last 200 years were also recalculated using the Marine20 calibration curve (Table 1).
Coral Δ14C (‰) values from the Indian Ocean region (Gulf of Kachchh (Chakraborty et al. Reference Chakraborty, Ramesh and Krishnaswami1994), Kadmat (Raj and Bhushan Reference Raj and Bhushan2021), Landfall (Raj and Bhushan Reference Raj and Bhushan2021), Watamu (Grumet et al. Reference Grumet, Guilderson and Dunbar2002), Hurghada (Cember Reference Cember1989), Port Sudan (Cember Reference Cember1989), Djibouti (Cember Reference Cember1989), Cocos (Hua et al. Reference Hua, Woodroffe, Smithers, Barbetti and Fink2005). The dashed lines are the modeled radiocarbon record of Agatti coral based on different growth rates

Figure 3 Long description
The line graph illustrates the Delta 14C percentage over time from 1940 to 2040. The x-axis represents the year, ranging from 1940 to 2040, and the y-axis represents the Delta 14C percentage, ranging from -100 to 200. The graph includes multiple data points and lines representing different locations: Gulf of Kachchh, Kadmat, Landfall, Watamu, Mentawai, Hurghada, Port Sudan, Djibouti, and Cocos. Additionally, there are four modeled radiocarbon records of Agatti coral based on different growth rates: 11 millimeters per year (black dashed line), 11.5 millimeters per year (red dashed line), 12 millimeters per year (green solid line), and 12.5 millimeters per year (blue dashed line). The data points for each location are represented by different symbols: squares for Gulf of Kachchh, circles for Kadmat, triangles for Landfall, diamonds for Watamu, pentagons for Mentawai, hexagons for Hurghada, plus signs for Port Sudan, crosses for Djibouti, and stars for Cocos. The graph shows a general increase in Delta 14C percentage from 1940 to around 1970, followed by a decrease and stabilization in subsequent years. All values are approximated.
Pre-bomb 14C data from the northern Indian Ocean, and estimation of ΔR value

Table 1 Long description
The table presents pre-bomb radiocarbon data from the northern Indian Ocean, detailing species, sample locations, and calendar years. It includes 30 rows and 10 columns, with headers such as Reference, Species, Sample location, Calendar year of growth or collection, 14C age (BP), 1σ (14C age), 14C age (BP), ΔR, and 1σ (ΔR). The data spans various species like Porites, Marcia, and Gastropod, collected from locations such as Agatti, Lakshadweep, Mumbai, Goa, and Sri Lanka. Notable trends include variations in 14C age and ΔR values across different samples and locations, providing insights into regional radiocarbon levels.
Calculated ΔR values of Agatti coral varied from −226 ± 43 yr to 140 ± 57 yr. As shown above, the mean annual growth rate of the Agatti coral cannot be lower than 11 mm/yr. The mean annual growth rate of 11 mm/yr or higher for Agatti coral yields the calendar age of the pre-bomb section of the Agatti core of 1942 or later. The Marine20 calibration curve (Heaton et al. Reference Heaton, Köhler, Butzin, Bard, Reimer, Austin, Bronk Ramsey, Grootes, Hughen, Kromer, Reimer, Adkins, Burke, Cook, Olsen and Skinner2020) assigns the same modeled 14C age (603 years) to any calendar age of 1942 CE or later. Therefore, further refinement in the Agatti coral chronology would not affect the ΔR estimates.
Using all the calculated ΔR values from the Agatti coral, we derived a mean ΔR value for the Lakshadweep region during the recent pre-bomb period. Following the approach of Alves et al. (Reference Alves, Macario, Ascough and Bronk Ramsey2018), we calculated the error-weighted mean (ΔRµ; Eq. 2). The associated uncertainties were also determined: the standard deviation of the mean (σμ; Eq. 3), the total uncertainty including external variability (stotal; Eq. 4), and the square root of the weighted average variance (σR; Eq. 5). To understand the internal variability of ΔR values Lakshadweep region, the χ2 value was calculated using equation (6). If the normalized χ2 value (χ2/(n–1)) is less than 1, then it indicates that ΔR variability is explained by measurement uncertainty. But normalized χ2 value greater than 1 indicates additional variability is present in the ΔR data and not explained by measurement uncertainty (Coulthard et al. Reference Coulthard, Furze, Pieńkowski, Chantel Nixon and England2010; DiNapoli et al. Reference DiNapoli, Fitzpatrick, Napolitano, Rick, Stone and Jew2021; Mangerud et al. Reference Mangerud, Bondevik, Gulliksen, Karin Hufthammer and Høisæter2006; Petchey et al. Reference Petchey, Anderson, Zondervan, Ulm and Hogg2008; Pieńkowski et al. Reference Pieńkowski, Coulthard and Furze2023).
 $$\Delta {R_\mu } = {{\mathop \sum \nolimits_{i = 1}^n {{\Delta {R_i}} \over {\sigma _i^2}}} \over {\mathop \sum \nolimits_{i = 1}^n {1 \over {\sigma _i^2}}}}$$
 $${\sigma _\mu } = \sqrt {{1 \over {\sum\nolimits_{i = 1}^n {{1 \over {\sigma _i^2}}} }}} $$
 $${s_{total}} = \sqrt {\sigma _\mu ^2 + \sqrt {\sigma _{\Delta R}^2 - {{\left( {{\sigma _\mu } \times \sqrt n } \right)}^2}} } $$
 $${\sigma _R} = \sqrt {{n \over {\left( {n - 1} \right)}} \times {{\mathop \sum \nolimits_{i = 1}^n {{{{(\Delta {R_i} - \Delta {R_\mu })}^2}} \over {\sigma _i^2}}} \over {\mathop \sum \nolimits_{i = 1}^n {1 \over {\sigma _i^2}}}}} $$
 $${{\rm{\chi }}^2} = \mathop \sum \limits_{i = 1}^n {{{{(\Delta {R_i} - \Delta {R_\mu })}^2}} \over {\sigma _i^2}}$$
In the above equations, n is the number of data or samples, ΔRi are individual ΔR values, σi are uncertainty associated with each ΔR value and σΔR 2 is the total population variance. For Agatti coral ΔR data calculated normalized χ2 value is 5.9 (>1), thus suggesting additional variability is present in the Agatti coral record. One data point in the Agatti coral record shows a very high ΔR value of 140 yr. This could be due to the influence of upwelled 14C-depleted water in the region. Even if we consider this datum as an outlier, the normalized χ2 value for the remaining data is calculated to be about 2.6 (>1), still indicating some additional variability in the Agatti coral ΔR data. Each analyzed sample corresponds to 3–4 mm down-core length and for mean growth rate of 12 mm/yr or 12.5 mm/yr each sample corresponds to about 3–4 months in a year. Since these samples could represent different seasons, intra-annual seawater 14C variability could also be a reason for the observed variability. Therefore, we used all ΔR values of Agatti coral for calculating the additional variability, stotal, σR, and ΔRµ values. The σR value is found to be larger than the stotal value. Therefore, we report the σR as the standard deviation associated with the calculated ΔRµ value. The calculated error-weighted mean of ΔR values of Agatti coral was –128 ± 130 yr.
Discussion
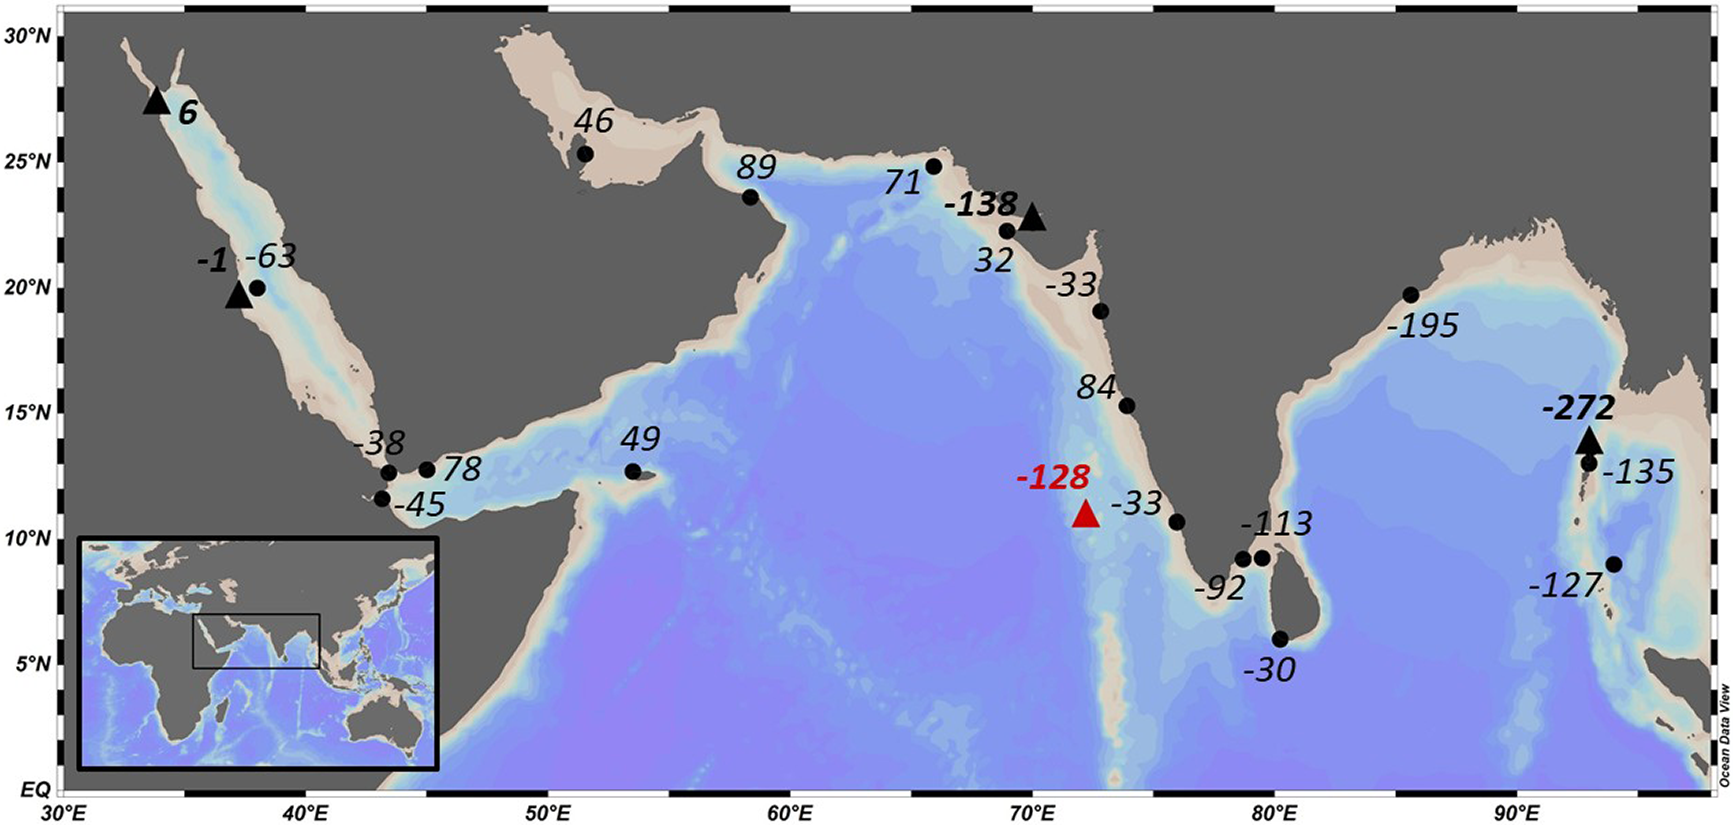
Figure 4 shows the spatial distribution of the ΔR values in the Northern Indian Ocean. It is observed that the northeastern Indian Ocean region (Bay of Bengal, and Andaman Sea) shows lower ΔR values compared to the northwestern Indian Ocean region (Arabian Sea, Persian Gulf, and Red Sea). Deep and bottom waters of the Indian Ocean are highly depleted in 14C (Key Reference Key2001; Stuiver and Östlund Reference Stuiver and Östlund1983). Upwelling of these 14C depleted waters occurs along the coast of Somalia, Oman, Pakistan, and India mainly during the summer monsoon season. This upwelling of 14C depleted water is the reason for high ΔR values in the Arabian Sea (Dutta et al. Reference Dutta, Bhushan and Somayajulu2001; Southon et al. Reference Southon, Kashgarian, Fontugne, Metivier and Yim2002). Whereas, the Bay of Bengal and the Andaman Sea receive large fluxes of freshwater during the summer monsoon season (Sengupta et al. Reference Sengupta, Raj and Shenoi2006; Varkey et al. Reference Varkey, Murty and Suryanarayana1996), reducing vertical mixing and subsequently resulting in low ΔR values (Dutta et al. Reference Dutta, Bhushan and Somayajulu2001; Raj et al. Reference Raj, Bhushan, Muruganantham, Nambiar and Dabhi2020; Southon et al. Reference Southon, Kashgarian, Fontugne, Metivier and Yim2002).
Map displaying the ΔR value for Agatti Island (in red), along with other coral-based ΔR values (triangles) and mollusk-based ΔR values (circles) from the past 200 years in the northern Indian Ocean region (Inset: location of study area in the Indian Ocean). Map was created using ODV (Schlitzer Reference Schlitzer2023).

Figure 4 Long description
The map displays radiocarbon reservoir ages in the northern Indian Ocean over the past 200 years. Agatti Island is highlighted in red, with triangles representing coral-based R values and circles representing mollusk-based R values. The inset shows the location of the study area within the Indian Ocean. The map was created using ODV software.
The ΔR value from the Lakshadweep region in the southeastern Arabian Sea, estimated in the present study, is among the lowest compared to reported ΔR values from other corals and mollusks from the northwestern Indian Ocean. It is second only to ΔR value of the Gulf of Kachchh region which is also obtained from coral. The lowest ΔR value from the Gulf of Kachchh region is due to the faster equilibration of shallow gulf water with the atmospheric CO2 (Dutta et al. Reference Dutta, Bhushan and Somayajulu2001). But fast equilibration might not be the reason for the low ΔR value of the Lakshadweep region because the Lakshadweep archipelago is situated in the open Arabian Sea. The radiocarbon values (Δ14C) of Agatti coral show a range of ca. 60–118 ‰ just after the sharp bomb-radiocarbon rise, and then show the post-bomb decline. These bomb radiocarbon values are much lower than the peak bomb-radiocarbon value of 172 ‰ in the Gulf of Kachchh coral (Chakraborty et al. Reference Chakraborty, Ramesh and Krishnaswami1994). This also indicates that the reason for the low ΔR value from the Lakshadweep region is not the fast equilibration of Lakshadweep waters with atmospheric CO2, as it would have resulted in high bomb-radiocarbon peak values.
The reason for low ΔR value in the Lakshadweep region can be the Bay of Bengal waters intrusion into the Arabian Sea. During the winter season, the southward-flowing East India coastal current feeds less saline waters from the Bay of Bengal to the northward-flowing West India coastal current in the Arabian Sea, and this Bay of Bengal water intrusion is mainly confined to the top 30–40 m (Prasanna Kumar et al. Reference Prasanna Kumar, Narvekar, Kumar, Shaji, Anand, Sabu, Rijomon, Josia, Jayaraj, Radhika and Nair2004). Pre-bomb 14C records show that pre-bomb 14C concentration in the Bay of Bengal surface waters was higher than the Arabian Sea surface waters (Dutta et al. Reference Dutta, Bhushan and Somayajulu2001; Raj et al. Reference Raj, Bhushan, Muruganantham, Nambiar and Dabhi2020; Southon et al. Reference Southon, Kashgarian, Fontugne, Metivier and Yim2002). Therefore, relatively 14C enriched waters from the Bay of Bengal entering the southeastern Arabian Sea should reduce the ΔR value of the region.
The ΔR values from the northern Indian Ocean indicate that those in the eastern Arabian Sea are lower compared to the northern and western Arabian Sea. To quantify this, all available ΔR data from the past 200 years for both the eastern Arabian Sea and the northern and western Arabian Sea (Table 1) were compiled to calculate the error-weighted mean ΔR for each region. The resulting error-weighted mean ΔR for the northern and western Arabian Sea is 43 ± 103 years (n = 17, normalized χ2 > 1). In contrast, the eastern Arabian Sea has an error-weighted mean ΔR of –57 ± 108 years (n = 19, normalized χ2 > 1). Student’s t-test comparing the ΔR values between the two regions shows a statistically significant difference (p < 0.05), confirming that the ΔR values in the eastern Arabian Sea are significantly lower than those in the northern and western Arabian Sea.
These error-weighted ΔR mean values and the student t-test are based on all the coral and mollusk ΔR values available in the region for the last 200 years. The normalized χ2 values for all the ΔR values of both the eastern Arabian Sea and the north and western Arabian Sea suggest large variability in the ΔR values of these regions. One of the reasons for such variability could be that many of the marine reservoir correction estimates are obtained from different species of mollusk shells. Species-specific differences in diet and or habitat of mollusk shells can lead to different 14C concentration in the mollusk shell and subsequently different marine reservoir correction estimates (Forman and Polyak Reference Forman and Polyak1997; Lindauer et al. Reference Lindauer, Marali, Schöne, Uerpmann, Kromer and Hinderer2017b, Reference Lindauer, Hadden, MacArio and Guilderson2022; Petchey et al. Reference Petchey, Ulm, David, McNiven, Asmussen, Tomkins, Richards, Rowe, Leavesley, Mandui and Stanisic2012). However, reef-building hermatypic corals are a reliable indicator of surface water 14C concentration, as they do not exhibit such species-specific differences (Delong et al. Reference Delong, Kilbourne, Guilderson, Wagner, Slowey, Palmer and Hajdas2025). Comparing only coral-based ΔR values from the northern Indian Ocean also show a similar pattern as shown by all the ΔR values from the region for the last 200 years. The northeastern Indian Ocean region shows lower ΔR values compared to the northwestern Indian Ocean region. Within the northwestern Indian Ocean region, the western Arabian Sea (Red Sea) ΔR values are higher compared to that of the eastern Arabian Sea.
During the summer monsoon period, strong upwelling occurs in the western and northern Arabian Sea (Schott et al. Reference Schott, Xie and McCreary2009; Shankar et al. Reference Shankar, Vinayachandran and Unnikrishnan2002), which leads to reduction in the 14C concentration of surface waters in the region. Toggweiler et al. (Reference Toggweiler, Druffel, Key and Galbraith2019) reported pre-bomb 14C concentration in the Indian Ocean in terms of deficit, showing a large deficit in the northern and western Arabian Sea region related to upwelling. The same is observed in terms of higher ΔR values of the region. Upwelling also takes place in the eastern Arabian Sea during the summer monsoon (Shankar et al. Reference Shankar, Vinayachandran and Unnikrishnan2002). Such upwelling could explain the very high ΔR value of 140 yr observed in the Agatti coral. The large variability of the Lakshadweep region’s ΔR value from –226 ± 43 yr to 140 ± 57 yr, thus, indicates the influence of both relatively 14C enriched Bay of Bengal waters and relatively 14C depleted upwelled waters. However, the overall low mean ΔR value here suggest that the influence of relatively 14C-enriched waters from the Bay of Bengal is more prominent in this area in comparison to the upwelling. More seasonal pre-bomb radiocarbon measurements from the region are required to ascertain this observation.
It is noticeable from the available pre-bomb radiocarbon records that ΔR values are not uniform along the west coast of India. But the available pre-bomb records are limited which makes it difficult to ascertain if the variations are due to ocean dynamics or species dependent 14C variability. Long temporal records of ΔR changes are also not available from the region. Therefore, more pre-bomb radiocarbon measurements are needed to better constrain the spatial and temporal variations in the ΔR values in the region.
Summary
In the present study, we report the first pre-bomb 14C record from Lakshadweep archipelago in the southeastern Arabian Sea using a coral. The possible mean growth rate of the coral was constrained using the bomb 14C records available from the region. Using the possible mean growth rate the calendar age range of the coral pre-bomb 14C record was estimated. Based on the estimated calendar age and radiocarbon age of coral samples, the ΔR value of the Lakshadweep region was calculated to be –128 ± 130 yr. Furthermore, the comparison of marine reservoir corrections from the Arabian Sea region shows that the mean ΔR value of the eastern Arabian Sea is significantly lower than that of the northern and western Arabian Sea, indicating the influence of Bay of Bengal waters in the region.
Supplementary material
To view supplementary material for this article, please visit https://doi.org/10.1017/RDC.2025.10173
Acknowledgments
We are thankful to the Ministry of Earth Sciences (MoES) for funding the GEOTRACES project (vide sanction number MoES/36/OOIS/Siber/07 dated 30/06/2010). We thank the Director, CSIR-NIO, and, PRL for their support and encouragement in carrying out this study. We thank the Ministry of Environment and Forest (MoEF) for granting permission for the sampling of corals (F.No. 1–4/2007 WL-1 (pt) dated September 28, 2011). We are grateful to the MoEF officials of Lakshadweep Islands for their support in local logistics. We are thankful Chandana KR, Chinmay Shah, Nitesh Khonde, and Rajesh Kaila, for their help and support in sampling. USB is thankful to Dr. Maya K and the Director, NCESS, for their support and encouragement. We all thank the Associate editor and anonymous reviewers for their valuable comments and suggestions, which helped improve the quality of the paper. This is NIO Contribution number: 7513.
Author credit statement
Harsh Raj: Conceptualization, methodology, investigation, formal analysis, writing—original draft
Ankur J Dabhi: Methodology, investigation
Upasana S Banerji: Methodology
Ravi Bhushan: Methodology, resources, funding acquisition, writing—review and editing
Declaration of competing interests
The authors declare that they have no known competing financial interests or personal relationships that could have appeared to influence the work reported in this paper.