1. Introduction
Water and granular solids are the most common forms of matter on Earth and yet we have hardly begun to understand how they mix and behave together (Fraysse, Thomé & Petit Reference Fraysse, Thomé and Petit1999; Iverson et al. Reference Iverson, Reid, Iverson, LaHusen, Logan, Mann and Brien2000; Mitarai & Nori Reference Mitarai and Nori2006; Pailha, Nicolas & Pouliquen Reference Pailha, Nicolas and Pouliquen2008; Lu, Godt & Wu Reference Lu, Godt and Wu2010; Topin et al. Reference Topin, Monerie, Perales and Radjai2012). In particular, partially wetted granular materials have remained largely unexplored due to the intricate texturing of water in the pore space (Scheel et al. Reference Scheel, Seemann, Brinkmann, Di Michiel, Sheppard, Breidenbach and Herminghaus2008) in spite of its crucial cohesive effect in many natural and industrial processes such as slope stability by vegetation due to the hydro-mechanical properties of the root–soil matrix (Ghestem, Sidle & Stokes Reference Ghestem, Sidle and Stokes2011), pollution transport above the phreatic zone where water is retained by capillary forces, wet mixing and agglomeration of ores and powders (Bocquet et al. Reference Bocquet, Charlaix, Ciliberto and Crassous1998; Forrest et al. Reference Forrest, Bridgwater, Mort, Litster and Parker2002; Litster & Ennis Reference Litster and Ennis2004; Ruiz et al. Reference Ruiz, Rondet, Delalonde and Desfours2011).
Wet granular materials are classically characterized by the relation between the amount of water
 $S$
, defined as the ratio of liquid volume to the pore space volume, and the difference
 ${\it\delta}p=p_{a}-p_{\ell }$
between air pressure
 $p_{a}$
and the negative Laplace pressure
 $p_{\ell }$
of the liquid, which controls the cohesive strength of the material (Mitchell & Soga Reference Mitchell and Soga2005; Pakpour et al.
Reference Pakpour, Habibi, Møller and Bonn2012). However, nearly all work accomplished in this field is based on measurements and phenomenological models involving the choice of an ‘effective stress’ accounting for capillary stresses. A particle-based approach was recently pioneered in tomographic studies of the morphology of liquid clusters in the pore space for granular samples mixed with a certain amount of liquid (Scheel et al.
Reference Scheel, Seemann, Brinkmann, Di Michiel, Sheppard, Breidenbach and Herminghaus2008). The authors evidenced the ramified structure of the liquid and the coalescence of liquid clusters as
 $S$
was increased from the pendular regime, where the liquid is in the form of capillary bridges joining pairs of grains, into the funicular regime, where liquid clusters joining several grains and/or filling the pores prevail.
In this paper, we are interested in the distribution of liquid in a granular material and its relationship with capillary stresses as the liquid fills the pore space gradually and homogeneously. Due to thermodynamic quasi-equilibrium, capillary condensation with periodic boundary conditions provides ideally homogeneous conditions for the distribution of liquid at the sample scale, yielding thus meaningful statistics on the connectivity of liquid clusters and local grain environments for an arbitrary amount of liquid. We used a multiphase lattice Boltzmann model (LBM) to simulate the condensation of liquid inside a packing of disks from a vapour phase and thus gradual filling of the pore space from a dry state (
 $S=0$
) towards a fully saturated state (
 $S=1$
) (Shan & Chen Reference Shan and Chen1993; Nicos & Hudong Reference Nicos and Hudong1996; He & Doolen Reference He and Doolen2002; Sukop & Or Reference Sukop and Or2004). After a brief description of the simulated system, we analyse below the connectivity of the liquid phase, Laplace pressure and grain stresses as a function of the amount of condensed liquid.
2. System description
The granular samples are prepared by isotropic compaction of 1000 disks with a friction coefficient of
 ${\it\mu}=0.1$
simulated by the molecular dynamics method inside a biperiodic cell (Radjai & Dubois Reference Radjai and Dubois2011). The particles have a uniform size distribution by volume fraction with a ratio of 3 between the largest and smallest diameters. This distribution is broad enough to prevent local crystallization (Voivret et al.
Reference Voivret, Radjaï, Delenne and El Youssoufi2007). The resulting static configurations have a packing fraction of 0.82.
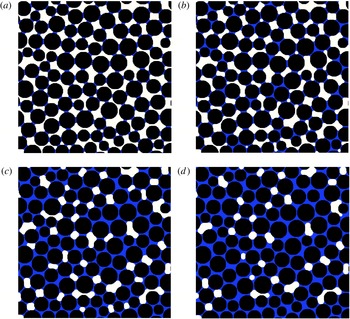
Four snapshots of liquid clusters with increasing amounts of liquid.

The capillary condensation is initiated by setting the temperature to
 $T=0.7T_{c}$
, where
 $T_{c}$
is the triple point temperature, and a uniform fluid density (see Appendix). After a transient in the range
 $S<0.02$
, a quasi-equilibrium state is reached with a uniform injection of fluid at a constant rate in the pore space, leading to continuous condensation of liquid between the particles. The relative vapour pressure
 $p_{v}/p_{sat}$
, where
 $p_{sat}$
is the saturation pressure, is
 $\simeq 0.45$
during this process. The injection rate in our simulations was
 ${\it\delta}S\simeq 2\times 10^{-6}$
per time step. This rate is low enough for chemical equilibrium to be satisfied with a good precision everywhere inside the pore space. In all simulations reported in this paper, the surface tension (line tension in 2D with the unit of a force) of the solid–vapour interface is equal to that of the liquid–vapour interface,
 ${\it\gamma}$
, and the solid–liquid surface tension is zero, so that the contact angle between the liquid and the grains is zero. It should be noted that the calculations were conducted by assuming that the grains are immobile. In practice, this implies that the confining pressure is high compared with the capillary stress so that the condition of force balance on each grain remains satisfied as normal and tangential forces evolve. The condensation dynamics is a complex process. The vapour does not condense directly into the contact zones. Instead, liquid clusters appear first on the grains or in the pores between grains, and then are drained into the contact zones. Video samples of the simulations analysed below can be found at www.cgp-gateway.org/ref023.
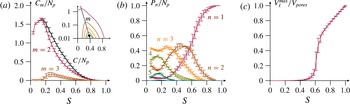
(a) The number
 $C_{m}$
of liquid clusters of order
 $m$
and the total number
 $C$
of clusters normalized by the number
 $N_{p}$
of particles. The inset shows the same data in linear-log representation with the same axis labels. (b) The number
 $P_{n}$
of grains connected to
 $n$
liquid clusters normalized by
 $N_{p}$
. (c) The volume
 $V_{\ell }^{max}$
of the largest liquid cluster normalized by the total volume
 $V_{pores}$
of the pore space, as a function of the amount of liquid
 $S$
. The error bars represent the standard deviation over 10 independent simulation runs.

Figure 1 displays four snapshots of liquid clusters with increasing
 $S$
. At low
 $S$
, the liquid is distributed in the form of bridges holding the particles together at their contact points. In this ‘pendular’ state, each bridge connects only two particles and hence its effect is fully captured by an attraction force depending on the distance between two particles (Israelachvili Reference Israelachvili1993; Willett et al.
Reference Willett, Adans, Johnson and Seville2000; Fournier et al.
Reference Fournier, Gerimichalos, Herminghaus, Kohonen, Mugele, Scheel, Schulz, Schulz, Schier, Seemann and Shudelny2005; Richefeu, El Youssoufi & Radjai Reference Richefeu, El Youssoufi and Radjai2006; Gilabert, Roux & Castellanos Reference Gilabert, Roux and Castellanos2008; Radjaï & Richefeu Reference Radjaï and Richefeu2009; Richefeu et al.
Reference Richefeu, El Youssoufi, Azéma and Radjai2009). As
 $S$
increases, the liquid bridges grow and evolve into clusters connected to several particles. This process may be statistically characterized by the number
 $C_{m}$
of liquid clusters connected to
 $m$
particles. In the same way, the grain environments can be described by the number
 $P_{n}$
of grains connected to
 $n$
distinct liquid clusters. We refer below to
 $m$
as the order of a cluster and to
 $n$
as the wet connectivity of a grain.
3. Cluster statistics
Figure 2(a) shows
 $C_{m}$
normalized by the total number
 $N_{p}$
of particles for different values of
 $m$
. Initially, in the pendular state, the wet coordination number is given by
 $z=2C_{2}/N_{p}$
. As capillary condensation proceeds,
 $C_{2}$
increases slightly due to the creation of new liquid bridges, whereas the existing bridges grow. A transition occurs to the funicular state at
 $S\simeq 0.15$
, where clusters of order 3 are born from the coalescence of adjacent binary bridges. As a result,
 $C_{2}$
begins to decline only when
 $C_{3}$
sets out to increase. The inset of figure 2(a) in linear-log scale reveals a cascading birth process of clusters of higher order from the lower-order clusters.
It is remarkable that the volume
 $V_{\ell }^{max}$
of the largest cluster during this primary coalescence process remains quite small, as we can see in figure 2(c). This indicates that the interconnection of binary bridges occurs in different parts of the sample, where the local porosity is lower, and nearly all clusters have hollow cores filled by the vapour, as observed in figure 1(b). It should be noted that for all values of
 $S$
, as shown in figure 1, the radii of curvature are nearly the same in different parts of the system, indicating that the system is very close to equilibrium. Nevertheless, as we shall see below, small variations of curvature exist and they are reflected in the distribution of liquid pressures.
The volume of the largest cluster sets out to increase considerably only at
 $S\simeq 0.4$
, when a secondary coalescence process begins in which the existing clusters merge with each other by a fast reduction of hollow cores. This process leads to the percolation of the liquid phase at
 $S\simeq 0.6$
, with a sharp increase of
 $V_{\ell }^{max}$
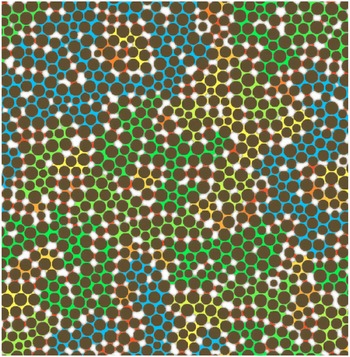
. This transition shows the highly nonlinear character of the pore-wetting process due to generic granular disorder despite homogeneous condensation. At this point, large clusters embed many particles and they are mainly separated by strings of vapour bubbles, as shown in figure 3. After the transition, the liquid phase belongs mostly to the largest liquid cluster and we have
 $V_{\ell }^{max}/V_{pores}\simeq S$
.
A snapshot of liquid clusters, identified by their different colours, and bubbles (in white) at
 $S=0.6$
.

The evolution of wet connectivities
 $P_{n}$
with
 $S$
, shown in figure 2(b), is dual to that of
 $C_{m}$
. In the pendular state, as
 $C_{2}$
increases due to new capillary bridges,
 $P_{2}$
and
 $P_{3}$
decline in favour of
 $P_{4}$
and
 $P_{5}$
. In contrast, during the primary coalescence process,
 $P_{2}$
and
 $P_{3}$
increase again as a result of the coalescence of adjacent liquid bridges connected to the same grain, leading to a decrease of
 $P_{4}$
and
 $P_{5}$
. During the secondary coalescence process, all particles of connectivity
 $n>2$
decrease in number as a result of a progressive immersion of grains, reflected in the increase of
 $P_{1}$
, which corresponds to the number of particles immersed or connected to a single cluster; see figure 1(c). The number
 $P_{2}$
of particles connected to two liquid clusters remains nearly constant at this stage, but beyond the percolation transition at
 $S=0.6$
, the prevailing process is the decrease of
 $P_{2}$
and increase of
 $P_{1}$
. At the latest stages before full saturation, all bubbles belong practically to the same percolating cluster, as observed in figure 1(d).
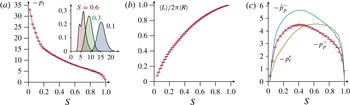
(a) Mean liquid pressure
 $-p_{\ell }$
as a function of the amount of liquid
 $S$
. The inset displays the distribution function of cluster liquid pressures for three values of
 $S$
. (b) Normalized grain–liquid interface as a function of
 $S$
. (c) Evolution of the rescaled Laplace pressure
 $p_{\ell }^{r}$
, the average grain pressure
 $-p_{p}^{-}$
calculated from the simulation data and the grain pressure
 $-\hat{p}_{p}^{-}$
given by (4.2) as a function of the amount of liquid
 $S$
.

4. Capillary stresses
A fundamental issue is how the key statistical features of liquid clustering and topological transitions briefly discussed above carry over into the mechanical behaviour of the system. The negative Laplace pressures exerted by liquid clusters on the particle network endow the granular material with a cohesive strength, which has to be overcome in order to deform the grain–fluid mixture or the granular packing in extension or in shear. At the scale of the mixture, three different stresses should be distinguished: (i) the average Laplace pressure, (ii) the average grain pressure and (iii) the average contact pressure.
The average Laplace pressure is the liquid pressure averaged on the pore space. In thermodynamic equilibrium, the liquid pressure is the same in all liquid clusters. Capillary condensation is, however, an out-of-equilibrium process, although a quasi-equilibrium state can be approached by decreasing the rate of vapour injection. The inset to figure 4(a) shows the distributions of liquid cluster pressures
 $p_{\ell _{i}}$
for three different values of
 $S$
. We see that the distributions are well peaked. The peak moves towards lower pressures as the liquid volume increases, but the dispersion around the peak remains nearly the same, reflecting the dynamics of capillary condensation. The average pressure
 $p_{\ell }$
of the liquid phase is given by its volume average over all clusters. The evolution of
 $-p_{\ell }$
is shown in figure 4(a). It should be noted that the natural physical units of the system are the grain diameter
 $d$
, liquid density
 ${\it\rho}_{\ell }$
and surface tension
 ${\it\gamma}$
. Hence, we normalize the lengths by
 $d$
, the forces by
 ${\it\gamma}$
and the pressures by
 ${\it\gamma}/d$
.
The simulated trend of
 $-p_{\ell }$
is nonlinear and very similar to the ‘retention curve’ of soil mechanics for
 $S$
versus
 $p_{v}-p_{\ell }$
(Lu et al.
Reference Lu, Godt and Wu2010). In our simulations,
 $p_{v}$
is nearly constant and negligibly small compared with
 $p_{\ell }$
. We distinguish three states. The pendular state corresponds to the range
 $S<0.15$
, where
 $-p_{\ell }$
declines down to
 $15{\it\gamma}/d$
, reflecting the fast decrease of the curvature of binary liquid bridges despite the increase of
 $C_{2}$
. In the range
 $0.15<S<0.9$
, which has the characteristics of the funicular regime with a decreasing number of binary bridges
 $C_{2}$
,
 $-p_{\ell }$
keeps decreasing down to
 $5{\it\gamma}/d$
as a function of
 $S$
, but at a lower rate compared with the pendular state. Finally, in the range
 $S>0.9$
,
 $-p_{\ell }$
drops to zero as the bubbles disappear. The average Laplace pressure
 $p_{\ell }$
is the ‘proper’ pressure of the liquid, but it should be rescaled to the pore space volume in order to obtain the capillary pressure carried by the condensed liquid at the scale of the packing. Hence, the rescaled Laplace pressure is given by
 $$\begin{eqnarray}p_{\ell }^{r}=Sp_{\ell }.\end{eqnarray}$$
The average grain pressure is the contribution of capillary pressure to the average pressure within the solid grains. The liquid pressure on each grain can be calculated from the numerical data and averaged over the whole packing to yield the average grain pressure
 $p_{p}^{-}$
due to the action of capillary forces. The average pressure on a grain is the sum of normal forces divided by the grain surface. Let
 $\langle L\rangle$
be the mean grain–liquid interface per grain. Then, the average normal force of the liquid on a grain of mean radius
 $\langle R\rangle$
is
 $p_{\ell }\langle L\rangle$
and the average pressure is given by
 $p_{\ell }\langle L\rangle /(2{\rm\pi}\langle R\rangle )$
. This is a mean over the total volume of the grains and thus should be multiplied by the packing fraction
 ${\it\phi}_{p}$
to obtain the average grain pressure at the scale of the packing:
 $$\begin{eqnarray}\hat{p}_{p}^{-}=\frac{\langle L\rangle }{2{\rm\pi}\langle R\rangle }{\it\phi}_{p}\,p_{\ell }.\end{eqnarray}$$
The average contact pressure is a fraction of the average grain stress supported by the contact network. For example, if all grains are fully immersed in the liquid phase, we have
 $\langle L\rangle =2{\rm\pi}\langle R\rangle$
and according to (4.2) the grain stress is simply equal to
 $p_{\ell }{\it\phi}_{p}$
. This is the stress transmitted through the grains although, since all grains are fully immersed, the contact forces and hence the stress transmitted through the contact network are not affected. The grain pressure is therefore an upper bound on the average contact pressure induced by capillary forces and which defines the capillary cohesion of the packing. In our simulations, the grains are assumed to be immobile and hence we do not have direct access to the tensile strength.
Figure 4(c) displays the rescaled Laplace pressure
 $p_{\ell }^{r}$
, the average grain pressure
 $-p_{p}^{-}$
calculated from the simulation data at the grain–liquid interface and the expression
 $-\hat{p}_{p}^{-}$
given by (4.2) as a function of
 $S$
. It is remarkable that, up to a factor
 $0.8$
which may be attributed to size polydispersity, the evolution of
 $-p_{p}^{-}$
is similar to that of
 $-\hat{p}_{p}^{-}$
. Four different states can clearly be distinguished. The pendular state is marked here by an increase of
 $-p_{p}^{-}$
from zero to
 $\simeq 3{\it\gamma}/d$
in the range
 $S=0.02$
to
 $S\simeq 0.15$
. In the second state, the pressure keeps increasing at a lower rate in the range
 $S\simeq 0.15$
to
 $S\simeq 0.4$
where the peak value
 $\simeq 4{\it\gamma}/d$
of
 $-p^{-}$
is reached. This range coincides with the primary coalescence process. Beyond the stress peak from
 $S\simeq 0.4$
to
 $S\simeq 0.9$
, the stress declines down to a value slightly below that of the end of the pendular state. Finally, in the bubble state, the grain pressure vanishes due to the fast decrease of the liquid pressure.
The success of the expression (4.2) in predicting correctly (up to a factor close to one) the evolution of tensile strength indicates that the above states reflect the competing effects of the falloff of Laplace pressure
 $-p_{\ell }$
shown in figure 4(a) and the increase of the grain–liquid interface
 $\langle L\rangle$
shown in figure 4(b). For example, in the pendular state the strength increases due to the fast increase of
 $\langle L\rangle$
despite decreasing Laplace pressure
 $-p_{\ell }$
. The modest increase of strength in the primary coalescence process, which may also be described as the ‘early’ funicular state, may be understood as a consequence of a lower rate of decrease of the Laplace pressure in this range. Beyond the peak, i.e. in the ‘late’ funicular state, the falloff of
 $-p_{\ell }$
prevails compared with the increase of
 $\langle L\rangle$
, and hence the tensile strength declines.
It is also remarkable that the rescaled liquid pressure
 $-p_{\ell }^{r}$
reflects the four regimes of capillary strength, with the same peak value reached at
 $S=0.4$
both in the liquid phase and in the grains. However, in contrast to
 $-p_{p}^{-}$
, which declines after the peak,
 $-p_{\ell }^{r}$
remains at the same value until
 $S=0.9$
, where it drops to zero. Hence, below
 $S\simeq 0.4$
, the capillary stress is mainly transmitted by the grain phase. At
 $S\simeq 0.4$
, part of the capillary pressure is transferred from the grains to the liquid, which carries thereafter a larger stress.
In practice, the cohesive strength of unsaturated granular media is difficult to measure since it requires the stress to be applied only on the granular phase. There are, however, few studies of capillary strength in granular materials. Our results are quite close to the soil mechanics picture of the evolution of capillary strength under wetting or drying conditions (Lu et al. Reference Lu, Godt and Wu2010), but they contrast with those of Scheel et al. (Reference Scheel, Seemann, Brinkmann, Di Michiel, Sheppard, Breidenbach and Herminghaus2008), who found a constant value of the strength beyond the pendular state, explained by a constant value of the Laplace pressure and wetted surface as the amount of liquid increased beyond the pendular state. This discrepancy may be a consequence of the distribution of water, which was obtained by mixing the particles with water in the experiments and by capillary condensation in our simulations.
5. Conclusion
Perhaps the most important finding of this work is that a peak grain pressure induced by capillary forces in a granular packing occurs inside the funicular state and it represents the transition from a primary coalescence process, where the volume of the largest cluster remains small, to a secondary coalescence process governed by the increase of liquid cluster volumes carrying a larger capillary stress. The evolution of this stress with the amount of liquid suggests that, besides the Laplace pressure, at least one internal variable pertaining to the connectivity of the liquid phase or its interface with the particle phase is required to describe the mechanical state of a wet granular material.
Let us point out here that the simulations and data processing were made possible due to the 2D geometry of the system and periodic boundary conditions. Despite demanding computational resources, similar simulations are necessary in 3D in order to investigate the effect of the geometry of the pore space. However, we do not expect a qualitative change of the physical picture. In this respect, the expression (4.2) is straightforward to extend to three dimensions by replacing the solid–liquid interface length
 $\langle L\rangle$
by the solid–liquid average area and the grain perimeter
 $2{\rm\pi}\langle R\rangle$
by the grain surface. Another important step for simulations is the evaluation of capillary cohesion from the contact forces, which requires the grains to be free to move.
We would also like to emphasize again that capillary condensation was used in this work as a means to obtain homogeneous mixing of a liquid with grains for meaningful statistics of liquid distribution and to reach arbitrary states of saturation. Under normal conditions, our results may be applied to a packing of nanoparticles, in which capillary condensation can lead to gradual filling of the whole pore space by liquid. However, the findings of this paper apply more generally to arbitrary grain–liquid mixtures, with the advantage of highlighting a homogeneous distribution, which can be considered as a reference system for comparison with less homogeneous mixtures obtained by direct mixing of a liquid with grains.
Appendix
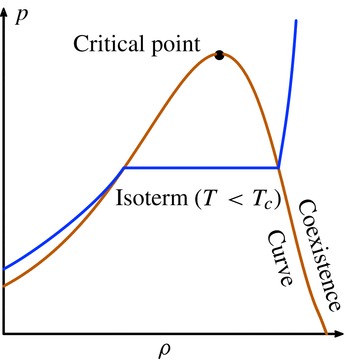
Partially saturated states in a granular material involve three phases: solid particles, liquid and gas. Hence, a numerical or theoretical model requires three ingredients: (i) granular dynamics, (ii) Navier–Stokes equations for the liquid and (iii) thermodynamics of gas–liquid phase transition (including surface tension). The fluid is simulated by means of the LBM, which consists in discretizing the Boltzmann equation (Succi Reference Succi2001) in the phase space and time using a finite difference scheme. The collision operator in our simulations is based on a single relaxation time, which can be shown to be equivalent to the Navier–Stokes equations in the limit of small Mach numbers. The thermodynamics of phase change (Swift et al. Reference Swift, Orlandini, Osborn and Yeomans1996; He & Doolen Reference He and Doolen2002; Yuan & Schaefer Reference Yuan and Schaefer2006) is based on the Carnahan–Starling equation of state (Kupershtokh, Medvedev & Karpov Reference Kupershtokh, Medvedev and Karpov2009) shown in figure 5. The interactions between liquid, gas and solid (grains) are derived using non-local potentials. These potentials are calculated on a regular mesh between the fluid particles and neighbouring lattice nodes that control the surface tension and contact angle between fluid and solid (He & Doolen Reference He and Doolen2002).
Isotherms according to the Carnahan–Starling equation of state. The pressures and densities are normalized by those of the triple point.

The LBM domain is meshed by a rectilinear grid of 2250 000 nodes, corresponding to at least 30 nodes within a small particle diameter. Furthermore, since in 2D the pore space does not percolate throughout the sample, we added a single fluid node at the contact point between the particles to allow for liquid transport. The capillary condensation is initiated by setting the temperature to
 $T=0.7T_{c}$
, where
 $T_{c}$
is the triple point temperature, and a uniform fluid density equal to the minimum spinodal density. A uniform injection of fluid particles at a constant rate in the pore space leads to the condensation of liquid between particles. With our system parameters, the Kelvin radius is nearly three pixels, which is greater than the distance between touching grains.
The evolution of liquid clusters and internal stresses is monitored as a function of the amount of liquid
 $S$
using a floodfill algorithm. This digital image processing algorithm allows one to determine the area connected to each seed node. The criterion used in the floodfill algorithm considers that two fluid pixels are connected if they are in contact. This means that two liquid bridges belong to a single cluster if they are connected by at least a single liquid pixel. By using the contact points between particles as the initial seeds we determine all independent clusters in the system for all values of
 $S$
.