


1. Introduction
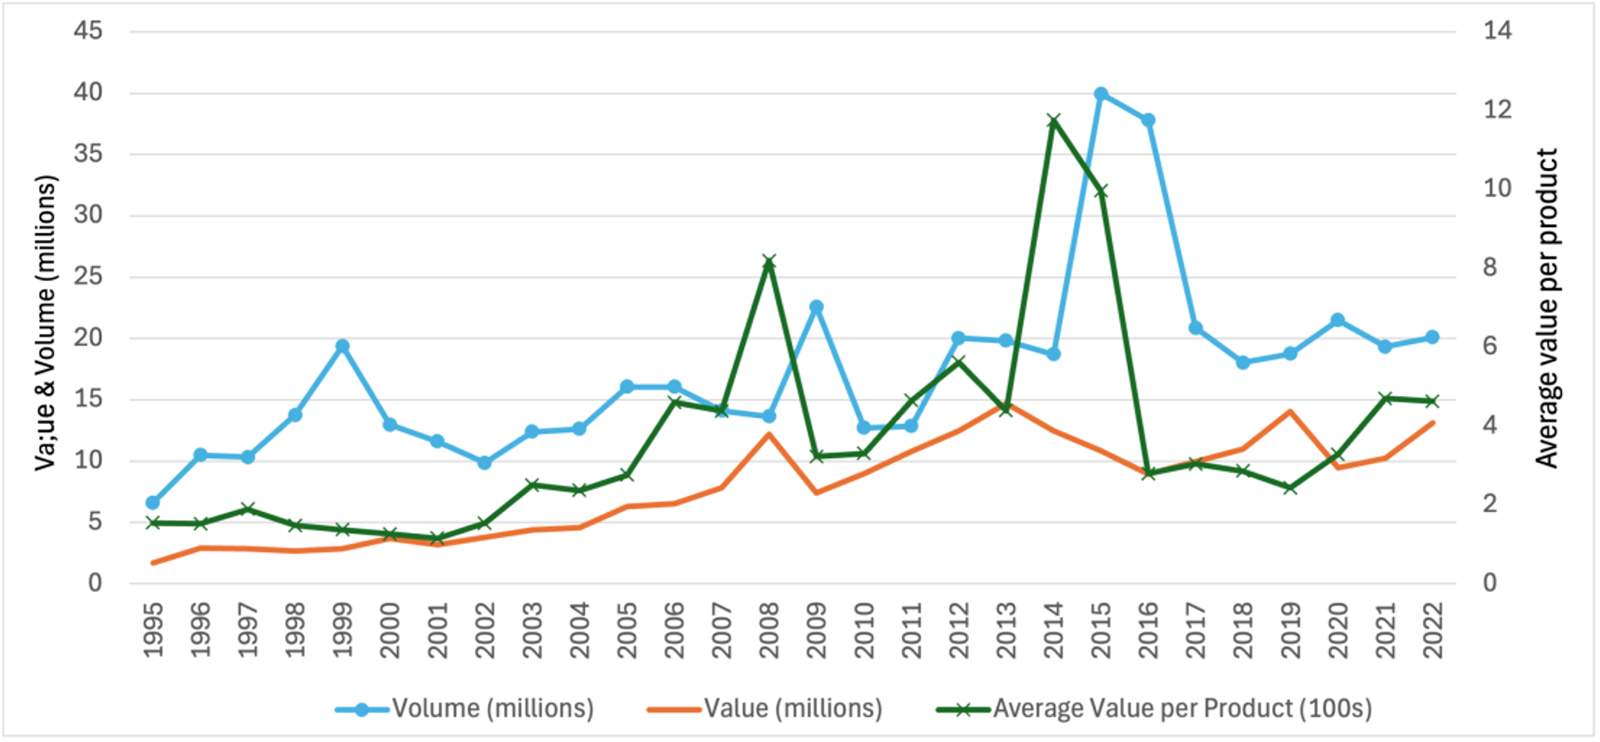
The emergence of regional trade agreements (RTAs) has been driven by the ambition to deepen economic integration, foster intra-regional trade, and promote economic growth. However, many RTAs often fall short of these lofty objectives, and the Economic Community of West African States (ECOWAS) serves as a case in point. Celebrating its 50th anniversary in 2025, ECOWAS continues to lag behind many other sub-regional trade blocs in terms of intra-regional trade performance (UNCTAD, 2019), and growth has seen a decline over the past decade (see Figure 1). Recent disruptions, including the pseudo-exit of the central Sahel countries have further strained the fabric of ECOWAS. Regional integration is expected to boost trade flows (Baldwin and Venables, Reference Baldwin, Venables, Grossman and Rogoff1995; De Melo and Tsikata, Reference De Melo and Tsikata2014), especially in the context of Africa’s ongoing integration efforts (Edwards and Rankin, Reference Edwards and Rankin2016). There have been tangible improvements in trade flows in terms of volumes (see Figure 1), and some of this improvement can be tied to regional integration. However, there remains a gap in understanding how extensive and intensive trade margins contribute to this process (Besedeš and Prusa, Reference Besedeš and Prusa2011). Institutional homogeneity among member states may be a key factor in realizing the potential of such integration (Feng and Genna, Reference Feng and Genna2003). For example, political and institutional factors, such as the presence of embassies, have been shown to significantly influence a country’s extensive trade margins (Matthee and Gallego, Reference Matthee and Gallego2017).
Trends in intensive margins of trade within ECOWAS.

Figure 1 Long description
Legend labels: Volume (millions), Value (millions), Average Value per Product (100s). Horizontal axis label: Year. Horizontal axis range: 1998 to 2021. Left vertical axis label: Value and Volume (millions). Left vertical axis range: 0 to 45. Right vertical axis label: Average value per product. Right vertical axis range: 0 to 14. Line identification by appearance: Volume (millions) is shown with circular markers. Value (millions) is shown as a plain line without markers. Average Value per Product (100s) is shown with x-shaped markers. Data values as coordinate pairs. Volume (millions): (1998, 8), (1999, 12), (2000, 12), (2001, 15), (2002, 20), (2003, 14), (2004, 12), (2005, 13), (2006, 14), (2007, 17), (2008, 17), (2009, 16), (2010, 23), (2011, 12), (2012, 18), (2013, 20), (2014, 18), (2015, 41), (2016, 39), (2017, 20), (2018, 18), (2019, 21), (2020, 20), (2021, 22). Value (millions): (1998, 2), (1999, 3), (2000, 3), (2001, 4), (2002, 5), (2003, 4), (2004, 4), (2005, 5), (2006, 6), (2007, 7), (2008, 8), (2009, 9), (2010, 10), (2011, 8), (2012, 12), (2013, 14), (2014, 16), (2015, 10), (2016, 11), (2017, 12), (2018, 15), (2019, 12), (2020, 14), (2021, 16). Average Value per Product (100s): (1998, 2), (1999, 2), (2000, 2), (2001, 2), (2002, 2), (2003, 2), (2004, 2), (2005, 2), (2006, 3), (2007, 5), (2008, 5), (2009, 8), (2010, 4), (2011, 4), (2012, 6), (2013, 6), (2014, 12), (2015, 10), (2016, 3), (2017, 3), (2018, 3), (2019, 3), (2020, 4), (2021, 5). Key points and comparisons using the plotted values. Volume (millions) minimum: (1998, 8). Volume (millions) maximum: (2015, 41). Volume (millions) shows a rise from 1998 to 2002, a lower period around 2003 to 2006, a rise to 2010, a drop at 2011, then a sharp increase at 2015 and 2016, followed by lower values from 2017 to 2021. Value (millions) minimum: (1998, 2). Value (millions) maximum: (2014, 16) and (2021, 16). Value (millions) increases from 1998 to 2010, drops at 2011, rises to 2014, drops at 2015, then varies between 10 and 16 from 2015 to 2021. Average Value per Product (100s) minimum: 2 from 1998 to 2005. Average Value per Product (100s) maximum: (2014, 12). Average Value per Product (100s) rises from 2006 to 2009, drops to 4 at 2010 and 2011, rises to 12 at 2014, drops to 3 at 2016 and stays at 3 through 2019, then rises to 5 at 2021. Notable divergence years from the plotted values. At 2015, Volume (millions) is 41 while Value (millions) is 10 and Average Value per Product (100s) is 10. At 2016, Volume (millions) is 39 while Average Value per Product (100s) is 3.
In this study, the focus is on two interrelated aspects of intra-sub-regional trade. First, it unpacks the product level characteristics of bilateral trade within ECOWAS, moving beyond aggregate trade volumes and values. This approach involves analysing four dimensions of the extensive trade margins (see Figure 1). These metrics capture the diversity and breadth of trade relationships within the region. Second, the study examines the determinants of these product-level trade characteristics, with a primary focus on the role of governance (as a proxy for the quality of institutions). For the intensive trade margins, the analysis focuses on overall trade volume and value, supplemented by a deeper examination of value per product. This allows for an assessment of how governance influences not only the scale of trade but also its depth and concentration.
The role of governance is explored through two lenses. The first examines the direct impact of governance quality on trade margins. The second investigates the interactive effects of governance, analysing how the combined governance environments of trading partners influence trade dynamics. Rather than focusing solely on institutional distance, a common approach in the literature (Feng and Genna, Reference Feng and Genna2003; Alvarez et al., Reference Alvarez, Barbero, Rodríguez-Pose and Zofio2018; Liu et al.,´ Reference Liu, Lu and Wang2020), this study emphasizes institutional interaction. In practice, trade agreements and partnerships are shaped by negotiations and interactions between countries, and these engagements often hinge on the quality of governance in both parties.
The analysis employs a structural gravity model framework (Anderson and Van Wincoop, Reference Anderson and Van Wincoop2003; Anderson, Reference Anderson2011) to assess how the interaction between exporter and importer affects both extensive and intensive trade margins within ECOWAS. The idea of institutional interaction is not a new one; in fact, it has always existed. The fusion of cultures and the fact that many developments in so-called improvements in institutional quality may not work because they do not interact positively with informal institutions is particularly relevant in the African context (Lanz et al., Reference Lanz, Lee and Stolzenburg2019; Park, Reference Park2023). Young et al. (Reference Young, Agrawal, King, Sand, Underdal and Wasson1999) was among the first to formalize this idea, suggesting that the effectiveness of specific institutions often depends not only on their design but also on how they interact with other institutional structures.
By including an interaction term (exporter governance × importer governance), the study captures the interactive and spillover effects of governance quality in bilateral trade relationships. This approach allows for a deeper understanding of how institutional dynamics influence trade flows, moving beyond institutional distance. The results are expected to provide insights into how governance quality and its interactions shape both the breadth and depth of trade within ECOWAS. By highlighting the importance of governance in fostering diverse and robust trade networks, the findings will contribute to policy discussions on enhancing regional integration and economic diversification within ECOWAS.
The rest of the paper is arranged as follows: Section 2 presents a literature brief covering an overview of ECOWAS, the extensive and intensive margins of trade, and the governance–trade relationship. Sections 3 and 4 give an overview of the data and stylized facts from it, while Sections 5 and 6 present the methodology employed, the analysis, results, and discussion. The paper is concluded in the final section.
2. Trade Margins, Governance, and Institutions
2.1 Intensive Margins
The intensive margins of trade reflect the value or volume of goods exchanged between bilateral trade partners. Most empirical work on bilateral trade has traditionally concentrated on this dimension, given that it captures firm-level or country-level deepening of existing trade relationships. Firm-level evidence across 50 countries shows that a significant share of export variation – sometimes as much as 50% – is driven by intensive margin changes, suggesting that export growth often results from scaling up existing trade ties rather than diversification into new ones (Fernandes et al., Reference Fernandes, Klenow, Meleshchuk, Pierola and Rodríguez-Clare2023). In line with this, studies in both developed and emerging markets have shown that economic integration tends to boost intensive margins more rapidly than extensive margins, especially where trade facilitation and demand stability are already in place (Márquez-Ramos et al., Reference Márquez-Ramos, Florensa and Recalde2015).
Nonetheless, a narrow focus on total trade value or volume risks obscuring the heterogeneity within bilateral trade flows. In many regional contexts, including ECOWAS, volume or value based trade growth may mask stagnation in trade diversity or breadth. Cadot et al. (Reference Cadot, Carrère, Strauss-Kahn, Jansen, Peters and Salazar-Xirinachs2011) argue that although intensive margins account for the bulk of short-run trade growth, sustainable export expansion often requires complementary gains along the extensive margin. Aggregate values can be distorted by a few high-value transactions or by a country’s reliance on a limited set of commodities or partners. To address this, this study uses a product-adjusted measure: average value per product per partner. This measure captures the average intensity of trade relationships, controlling for compositional effects.
2.2 Product-Level Trade and Extensive Margins
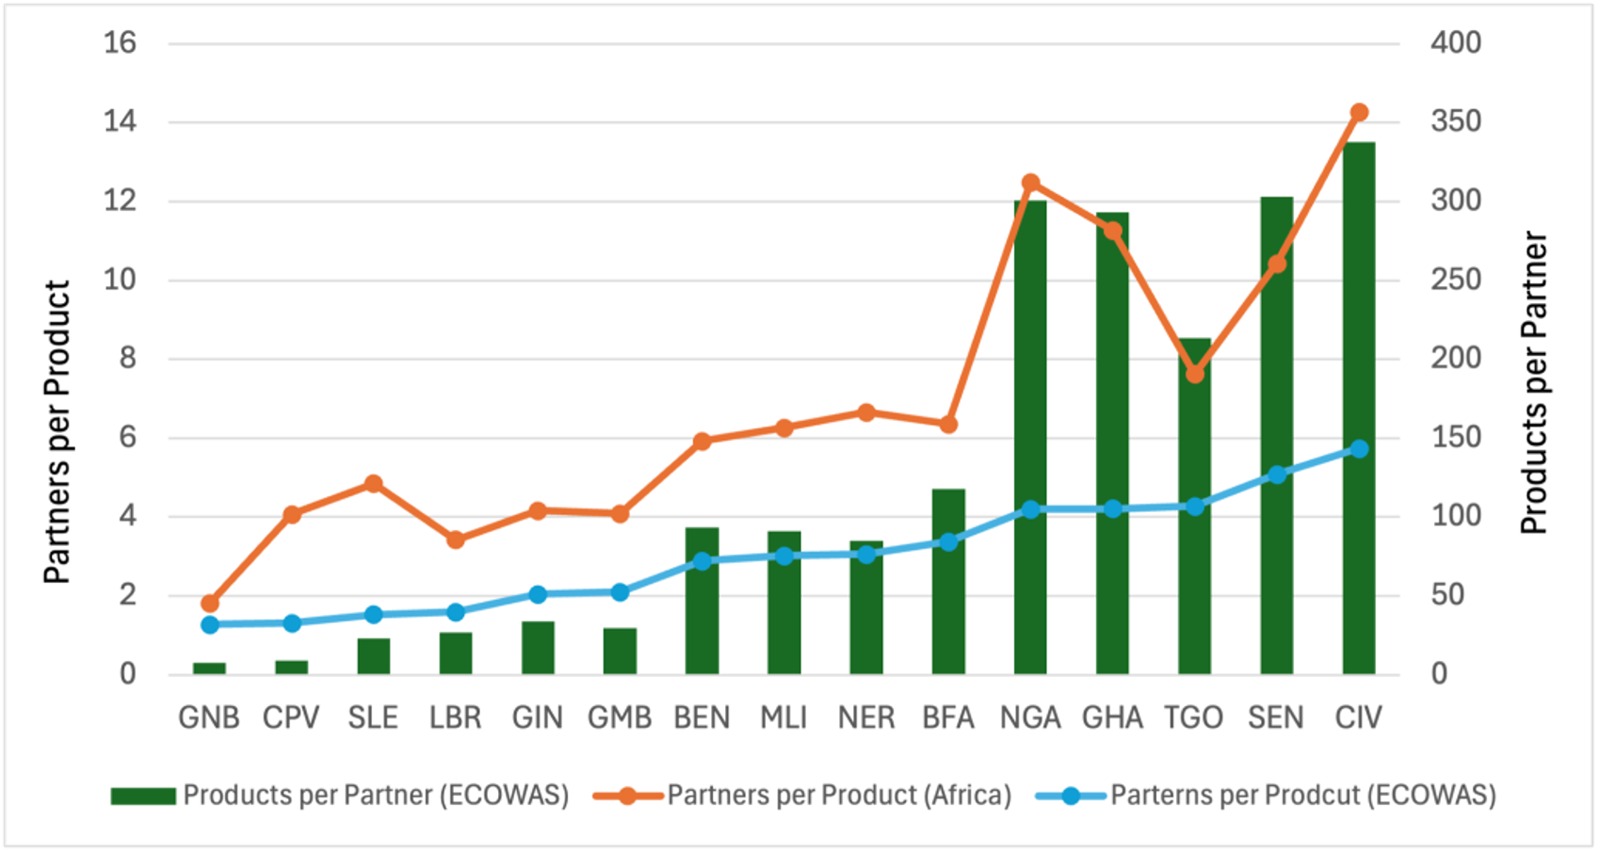
Traditional assessments of trade performance in ECOWAS often rely on aggregate trade volumes or regional trade shares, overlooking the micro-level trade relationships that determine whether integration is deepening or stagnating. By analysing both extensive and intensive trade margins, this study provides a granular assessment of trade patterns, helping to uncover whether ECOWAS members are achieving greater diversification, stronger regional networks, and higher-value trade interactions. This study considers ten key trade margin measures across extensive (breadth of trade) and intensive (depth of trade) margins. These include products per partner, partners per product, products per country, and partners per country (extensive margin) (see Figure 2) as well as total trade value, total trade volume, and value per product per partner (intensive margin). By linking these measures to governance quality, the study provides a structured framework for understanding how institutional environments shape ECOWAS trade relationships (Chaney, Reference Chaney2008; Helpman et al., Reference Helpman, Melitz and Rubinstein2008).
Extensive margins of trade within ECOWAS.

Figure 2 Long description
Grouped bar and line graph with three series and a legend. Legend entries: Products per Part ner (ECOWAS); Part ners per Product (Africa); Part ners per Product (ECOWAS). Horizontal axis categories, in order: GNB, CPV, SLE, LBR, GIN, GMB, BEN, MLI, NER, BFA, NGA, GHA, TGO, SEN, CIV. Left vertical axis label: Part ners per Product. Range shown: 0 to 16. Right vertical axis label: Products per Part ner. Range shown: 0 to 400. Products per Part ner (ECOWAS) shown as vertical bars aligned to the right vertical axis. Bar heights by category: GNB about 0; CPV about 0; SLE about 0; LBR about 0; GIN about 0; GMB about 0; BEN about 50; MLI about 75; NER about 75; BFA about 100; NGA about 300; GHA about 275; TGO about 200; SEN about 300; CIV about 350. Part ners per Product (Africa) shown as a line aligned to the left vertical axis. Line values by category: GNB about 3; CPV about 4.5; SLE about 5; LBR about 4; GIN about 4.5; GMB about 4.5; BEN about 6; MLI about 6.3; NER about 6.6; BFA about 6.5; NGA about 12.5; GHA about 11.5; TGO about 8.5; SEN about 11; CIV about 14. Part ners per Product (ECOWAS) shown as a second line aligned to the left vertical axis. Line values by category: GNB about 2; CPV about 2.2; SLE about 2.3; LBR about 2.5; GIN about 2.7; GMB about 3; BEN about 4; MLI about 4; NER about 4.2; BFA about 4.8; NGA about 5; GHA about 5; TGO about 5; SEN about 5.2; CIV about 6.
One of the key measures is the level of networks between ECOWAS countries, captured by partners per country. This reflects the number of unique trade partners per ECOWAS country. A country with a large number of trading partners suggests a well-integrated trade network, whereas a low number signals trade dependency on a few markets. Given ECOWAS’s goal of increasing intra-regional trade, this measure helps assess whether governance improvements are leading to wider trade connectivity within the bloc (Oshota and Wahab, Reference Oshota and Wahab2022; Bankole and Oladapo, Reference Bankole, Oladapo, Oloruntoba and Falola2019). In this same sphere, an important measure is one that captures the number of unique partners per product within ECOWAS countries, which reflects the geographic reach of a country’s exports. A high value indicates regional competitiveness and demand, while a low value suggests that certain products remain confined to a few trade partners.
Furthermore, and tied to product networks, is the number of products per partner country. This measure captures how diversified each bilateral trade relationship is in terms of the number of products exchanged. A high number of products per partner suggests trade expansion beyond traditional exports, while a low number indicates market concentration risks. In the context of ECOWAS, where primary commodities dominate exports, tracking this metric provides insights into whether economic diversification efforts are succeeding. Another key measure is the number of unique products per country. This measure captures the total number of distinct products exported by each ECOWAS member. A high number suggests diversified trade portfolios, whereas a low number indicates export concentration in a few goods. Countries with strong institutions, trade policies, and investment climates are more likely to see increases in product diversification, as governance quality helps firms expand into new markets.
2.3 Governance and Its Complementarities or Reciprocities (Quid-Pro-Quo) Implications for Trade within Regions
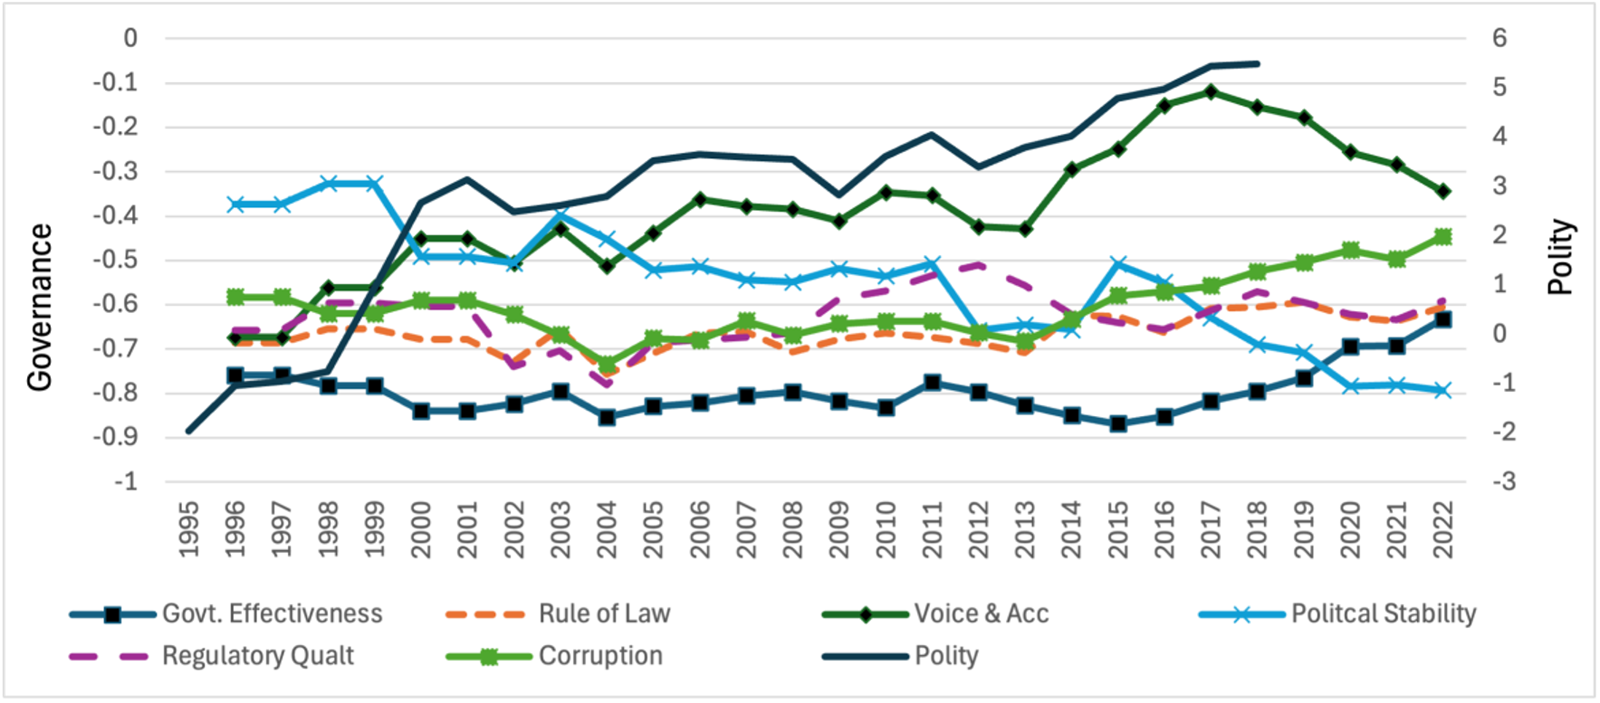
Governance plays a crucial role in shaping trade outcomes across these variables. Countries with stronger institutions, lower trade frictions, and better regulatory frameworks are likely to experience broader trade diversification, more extensive trade networks, and deeper trade intensity. In regions where institutions are weak or enforcement is uncertain, transaction costs rise and informal trade often becomes the norm. This is particularly relevant for ECOWAS, which has seen little improvement in governance structures in recent times as a whole, but with significant disparities remaining wide across member states (see Figure 3). For example, disaggregated governance indicators, including regulatory quality, control of corruption, and government effectiveness, have been shown to positively affect trade flows across ECOWAS member countries (Oshota and Wahab, Reference Oshota and Wahab2022). These effects hold even when accounting for sub-bloc dynamics, such as WAEMU and WAMZ, and appear strongest when both importing and exporting countries experience governance improvements. Further evidence suggests that intra-ECOWAS trade tends to flourish when institutional environments are mutually strong and predictable, creating the conditions for formal and sustained trade relationships (Bankole and Oladapo, Reference Bankole, Oladapo, Oloruntoba and Falola2019).
Evolution of governance in ECOWAS (1995–2022).

Figure 3 Long description
The horizontal axis represents the years and the vertical axis on the left shows governance scores from negative 1 to 1, while the right axis shows polity scores from 0 to 6. The graph includes lines for Government Effectiveness, Rule of Law, Regulatory Quality, Corruption, Voice and Accountability, Political Stability and Polity. Government Effectiveness is shown with a solid line, Rule of Law with a dashed line, Regulatory Quality with a dotted line, Corruption with a dash-dot line, Voice and Accountability with a long-dash line, Political Stability with a short-dash line and Polity with a thick solid line. Government Effectiveness and Rule of Law remain relatively stable with minor fluctuations. Regulatory Quality and Corruption show slight variations. Voice and Accountability and Political Stability exhibit more variability. Polity shows a general upward trend, peaking around 2016. The graph highlights how these indicators relate, with Polity generally higher than others. The purpose is to illustrate changes in governance over time, showing trends and variations among different indicators.
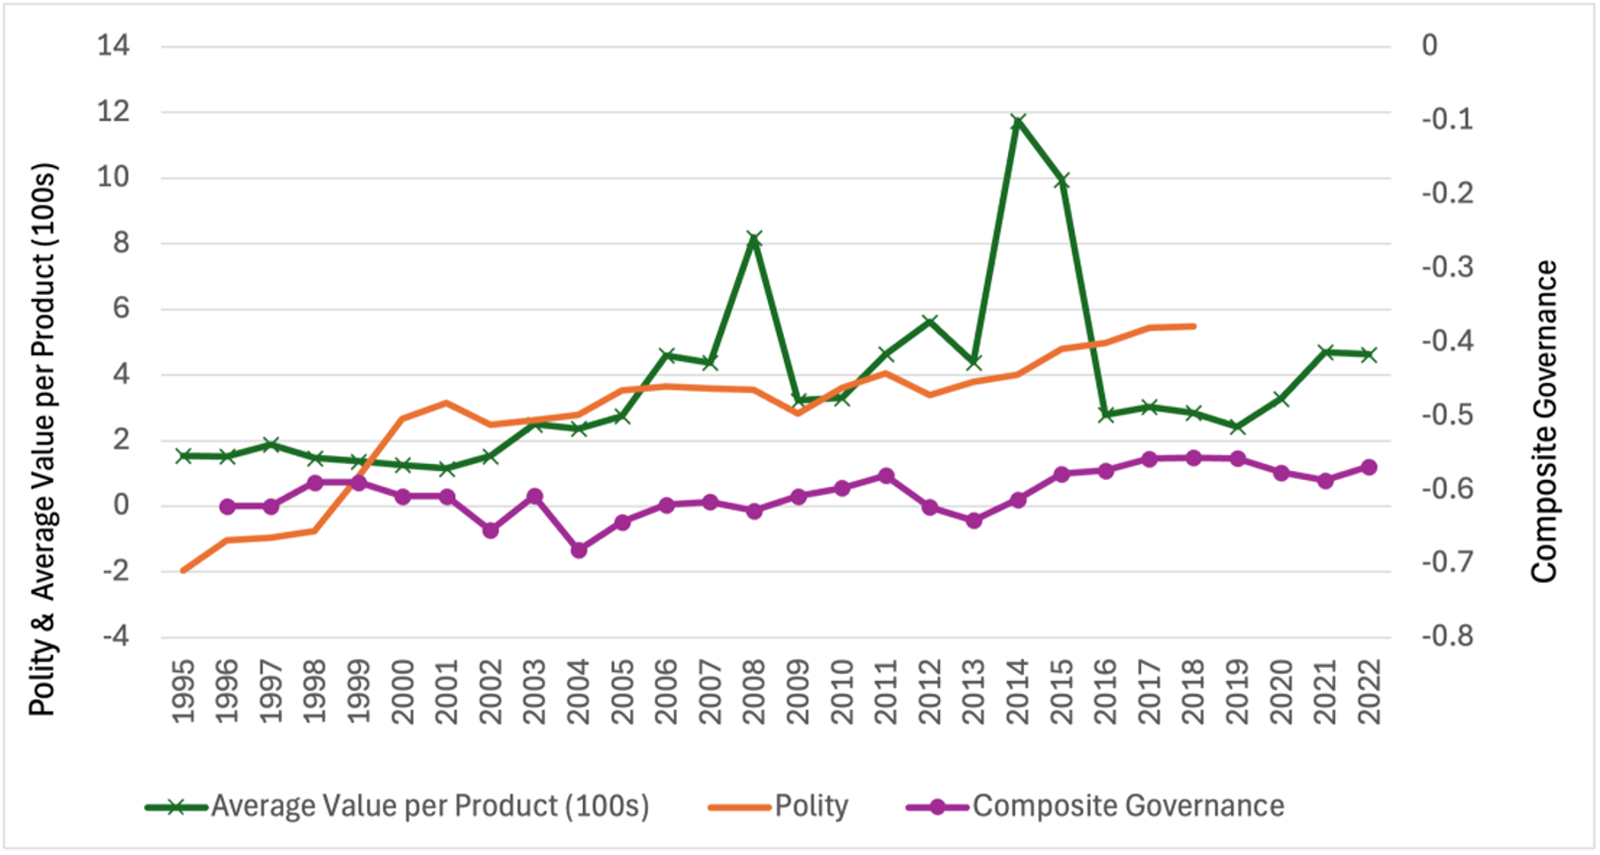
Yet, institutions matter for trade, not only in an absolute sense by lowering transaction costs within countries, but also in a bilateral sense where the complementarity between countries’ governance structures may shape bilateral trade flows. Given Intra-ECOWAS trade’s historical tendency towards concentration rather than breadth and diversification, the extensive margin measures considered provide deeper understanding of integration in ECOWAS. More importantly though, these measures are critical for assessing whether governance structures are complementary or reciprocal in enabling integration and broader market access (Helpman et al., Reference Helpman, Melitz and Rubinstein2008). For example, stronger governance or institutional spillovers may increase confidence in cross-border transactions, allowing firms to expand their export destinations (Baier et al., Reference Baier, Bergstrand and Feng2014; Yaya, Reference Yaya2014; Fernandes et al., Reference Fernandes, Klenow, Meleshchuk, Pierola and Rodríguez-Clare2023), facilitate greater trust, contract enforcement, and trade facilitation (De Groot et al., Reference De Groot, Linders, Rietveld and Subramanian2004), or facilitate wider product diversification, especially when institutions improve trade logistics, reduce non-tariff barriers, and support firms in exporting beyond commodities (Cadot et al., Reference Cadot, Carrère, Strauss-Kahn, Jansen, Peters and Salazar-Xirinachs2011; Nawaz, Reference Nawaz2020) (see Figure 4).
Relationship between governance quality and trade margins.

Governance-induced trade complementarities can be captured by institutional interaction effects (exporter governance × importer governance), and may determine whether governance facilitates or hinders trade relationships. To what extent does institutional alignment, or misalignment, between partners affect the ease, stability, and scale of bilateral trade. De Groot et al. (Reference De Groot, Linders, Rietveld and Subramanian2004) show that both the absolute quality of domestic institutions and the similarity in governance structures between trade partners shape trade outcomes. When countries share similar institutional quality, firms are more likely to encounter familiar norms, lower regulatory uncertainty, and enforcement mechanisms that are more predictable. This reduces the cost of exporting to new markets and helps build trust among trading firms. Their analysis, based on a the gravity framework, confirms that institutional distance, measured as the difference in governance quality between trading partners, is negatively associated with bilateral trade flows.
Recent theoretical extensions by Nawaz (Reference Nawaz2020), uses an augmented gravity model, and argues that the impact of institutions on trade becomes especially salient when regional integration is taken into account. Specifically, the marginal impact of regional trade agreements on trade is larger in countries with stronger governance. This is consistent with the idea that integration requires not just shared rules but institutional readiness to implement them effectively. Convergence in institutional quality, particularly around trade facilitation, regulatory quality, anti-corruption, etc., is necessary to unlock the full benefits of ECOWAS integration. This is because institutional relationships are not always neutral. Governments may respond to each other’s institutional changes in strategic ways. Evidence from Dür et al. (Reference Dür, Hamilton and De Bièvre2024) shows that reciprocal behavior is common in trade diplomacy, where past interactions shape present trade preferences, and trade policies may be crafted in response to perceived fairness (Bhagwati et al., Reference Bhagwati, Dinopoulos and Wong1992). Thus, countries may be more likely to engage in deeper trade relations with nations they perceive as better aligned, but otherwise introduce sludge for countries they perceive as unfair.Footnote 1 This strategic dynamic may be important for how ECOWAS performs.
It could inform broader regional efforts. ECOWAS has long committed itself to promoting democratic governance, with mechanisms such as its peace, security, and democracy protocols designed to uphold the rule-of-law standards across the bloc (Yaya, Reference Yaya2014). However, enforcement has often lagged behind set rules. Despite the establishment of institutions, such as the ECOWAS Court of Justice, the region still struggles with uneven implementation and weak institutional cohesion. Strengthening these mechanisms, as envisioned in the ECOWAS Vision 2020, may be essential to translate governance reform into real trade integration. When member states share governance norms and institutional capacity, trade becomes less risky, more predictable, and better aligned with long-term regional goals. We harmonize identifiers to ISO3 (15 ECOWAS members) and Harmonized System 6-digit (HS-6) from Base pour l’Analyse du Commerce International (BACI), merging all country-level series (World bank Development Indicators (WDI), World Governance Indicators (WGI), Polity series (version V) at the country–year level for 1995–2022. Units and timing are kept as they appear in the sources. All 15 ECOWAS members are present in each dataset, so no country series was spliced and no calendar re-indexing was required. Governance scores from WGI and Polity are already standardized and are used as provided, including in the interaction terms. For missing data, we adopt a simple rule in which single isolated gaps are linearly interpolated, and when necessary extrapolated by one year, otherwise the observation is dropped. Very few cases arise. To avoid the ‘log of zero’ and related bias, in the gravity estimations we do not log trade flows (Anderson and Van Wincoop, Reference Anderson and Van Wincoop2003). Other WDI covariates are logged where applicable.
3. Data
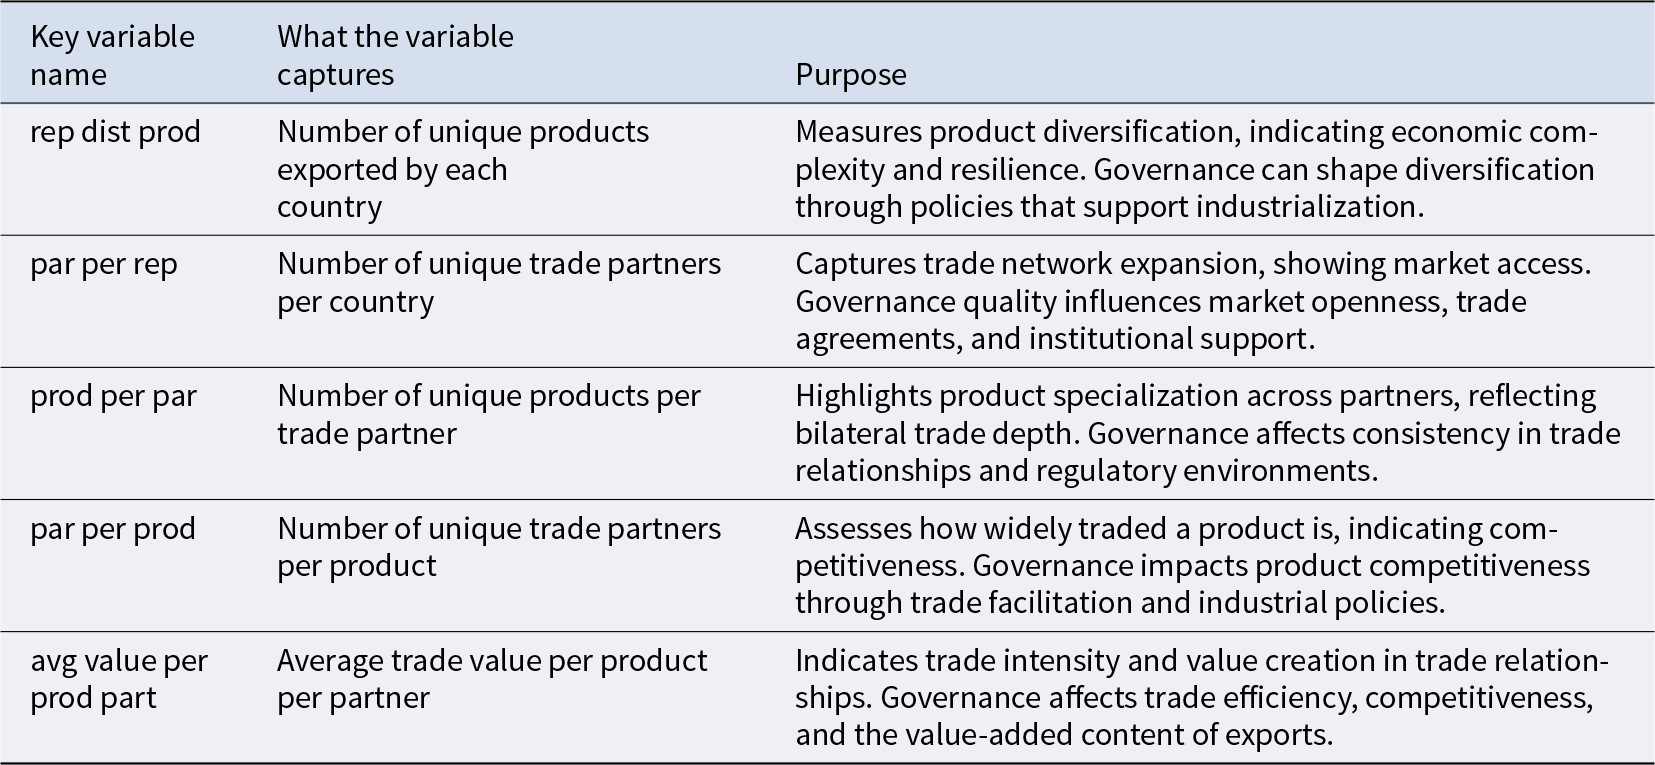
The dataset draws from multiple sources. Bilateral international trade data at the product level (1995–2022) is sourced from the BACI database provided by CEPII (Centre d’Etudes Prospectives et d’Informations Internationales). Country-level covariates, including output, expenditure, price indices, and governance indicators, are obtained from the World Bank’s Development Indicators. Institutional quality is captured using the Polity V dataset (Marshall and Gurr, Reference Marshall and Gurr2020). The governance indicators from the World Bank are not combined with other institutional datasets in this study, given that they are composite indices already constructed from a range of other governance and institutional sources (Kaufmann and Kraay, Reference Kaufmann and Kraay2024). The key variables of interest are briefly detailed in Table 1.
List of key variables of interest and their purpose

Table 1 Long description
Five key variables summarize different dimensions of international trade and how governance may influence them. Product diversification is captured by the number of unique products each country exports, used as a proxy for economic complexity and resilience. Trade network expansion is captured by the number of unique trade partners per country, reflecting market access shaped by openness and institutional support. Bilateral trade depth is represented by the number of unique products per trade partner, while product competitiveness and reach are represented by the number of unique trade partners per product. Trade intensity and value creation are captured by the average trade value per product per partner, linked to efficiency, competitiveness, and value added. The entries define concepts and intended interpretation rather than reporting numeric results, so no ranking or trend across countries or products can be inferred from this table alone.
4. Stylized Facts – Trade Margins in ECOWAS?
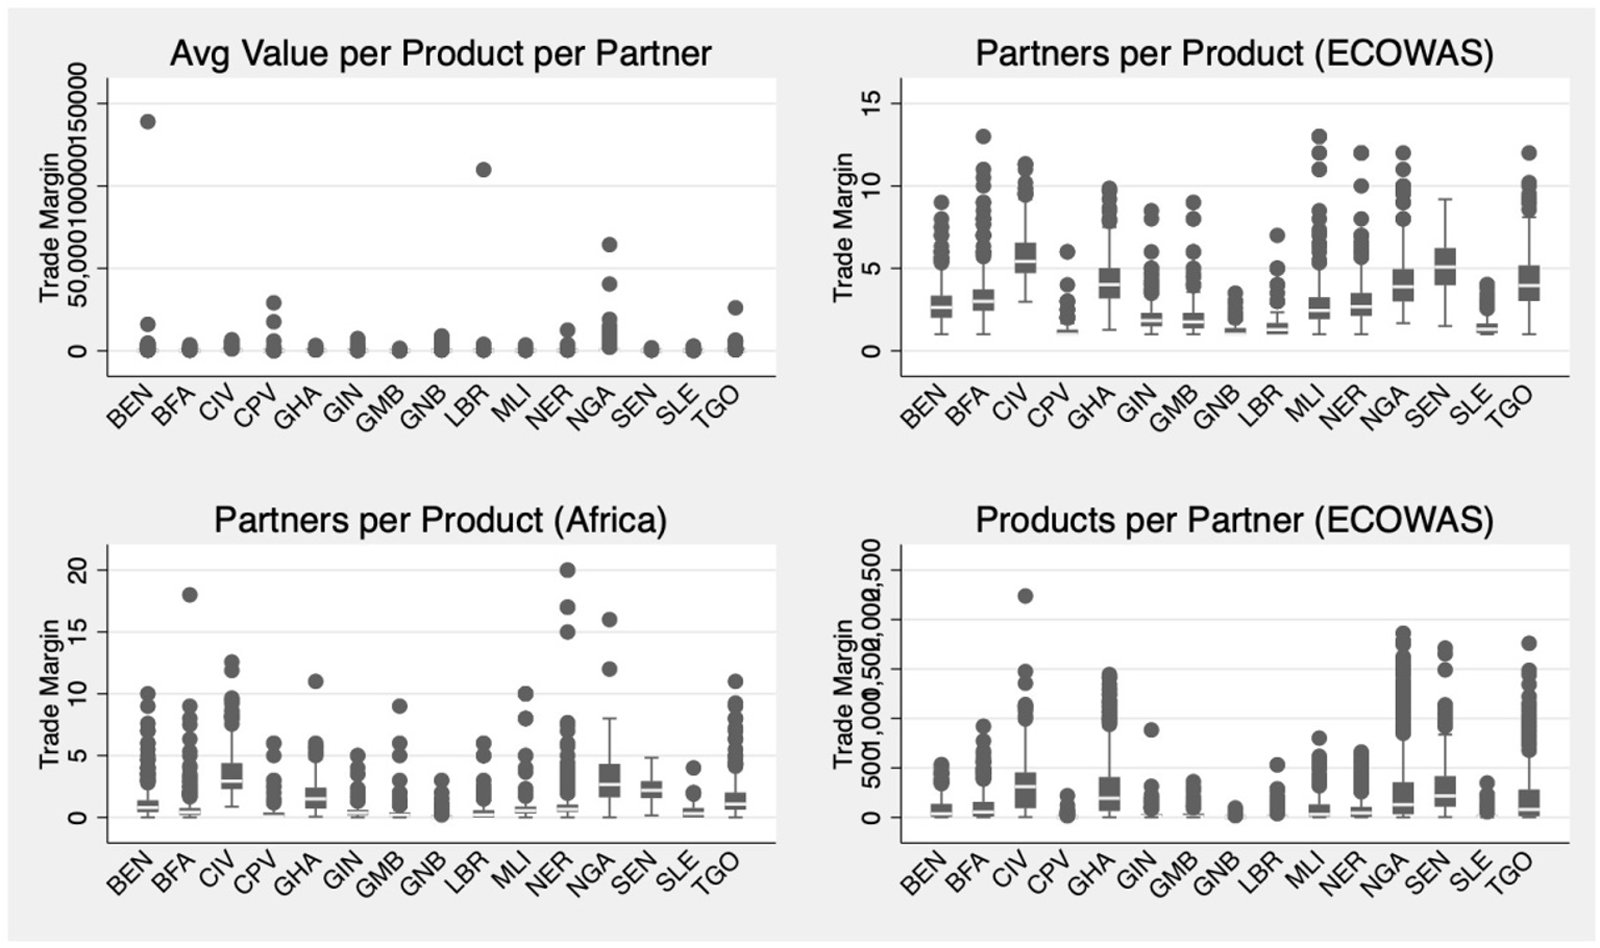
To get a sense of the nature and drivers of trade margins within ECOWAS, Figure 5 presents an illustration of the distribution of four key product-level trade margins across all ECOWAS member states. These include: (i) average value per product per partner, (ii) partners per product (ECOWAS only), (iii) partners per product (Africa), and (iv) products per partner (ECOWAS only). The data reveal substantial variation across countries. For instance, Nigeria, Cote d’Ivoire, and Senegal consistently record higher values across most trade margins, particularly in terms of product diversification and regional reach. In contrast, landlocked economies, such as Burkina Faso and Niger, display tighter distributions and lower averages, suggesting narrower trade portfolios and limited partner networks.
The distribution of trade margins across ECOWAS countries.

Figure 5 Long description
Avg Value per Product per Part ner. X-axis label: Country. Y-axis label: Trade Margin. Y-axis range: 0 to 15. X-axis categories: BEN, BFA, CIV, CPV, GHA, GIN, GMB, GNB, LBR, MLI, NER, NGA, SEN, SLE, TGO. Plotted points by country appear as vertical clusters. Visible points include values near 0 for all countries and higher points including approximately 14 for BEN, approximately 10 for GHA and approximately 12 for SEN. Part ners per Product (ECOWAS). X-axis label: Country. Y-axis label: Trade Margin. Y-axis range: 0 to 15. X-axis categories: BEN, BFA, CIV, CPV, GHA, GIN, GMB, GNB, LBR, MLI, NER, NGA, SEN, SLE, TGO. Each country shows a vertical cluster of points and a box-and-whisker element. Visible points extend from near 0 up to approximately 15, with multiple points near the upper range for NGA and SEN. Part ners per Product (Africa). X-axis label: Country. Y-axis label: Trade Margin. Y-axis range: 0 to 20. X-axis categories: BEN, BFA, CIV, CPV, GHA, GIN, GMB, GNB, LBR, MLI, NER, NGA, SEN, SLE, TGO. Plotted points by country appear as vertical clusters. Visible points extend from near 0 up to approximately 20, with upper-range points near 20 for NGA and SEN. Products per Part ner (ECOWAS). X-axis label: Country. Y-axis label: Trade Margin. Y-axis range: 0 to 20. X-axis categories: BEN, BFA, CIV, CPV, GHA, GIN, GMB, GNB, LBR, MLI, NER, NGA, SEN, SLE, TGO. Plotted points by country appear as vertical clusters. Visible points extend from near 0 up to approximately 20, with upper-range points near 20 for NGA and SEN.
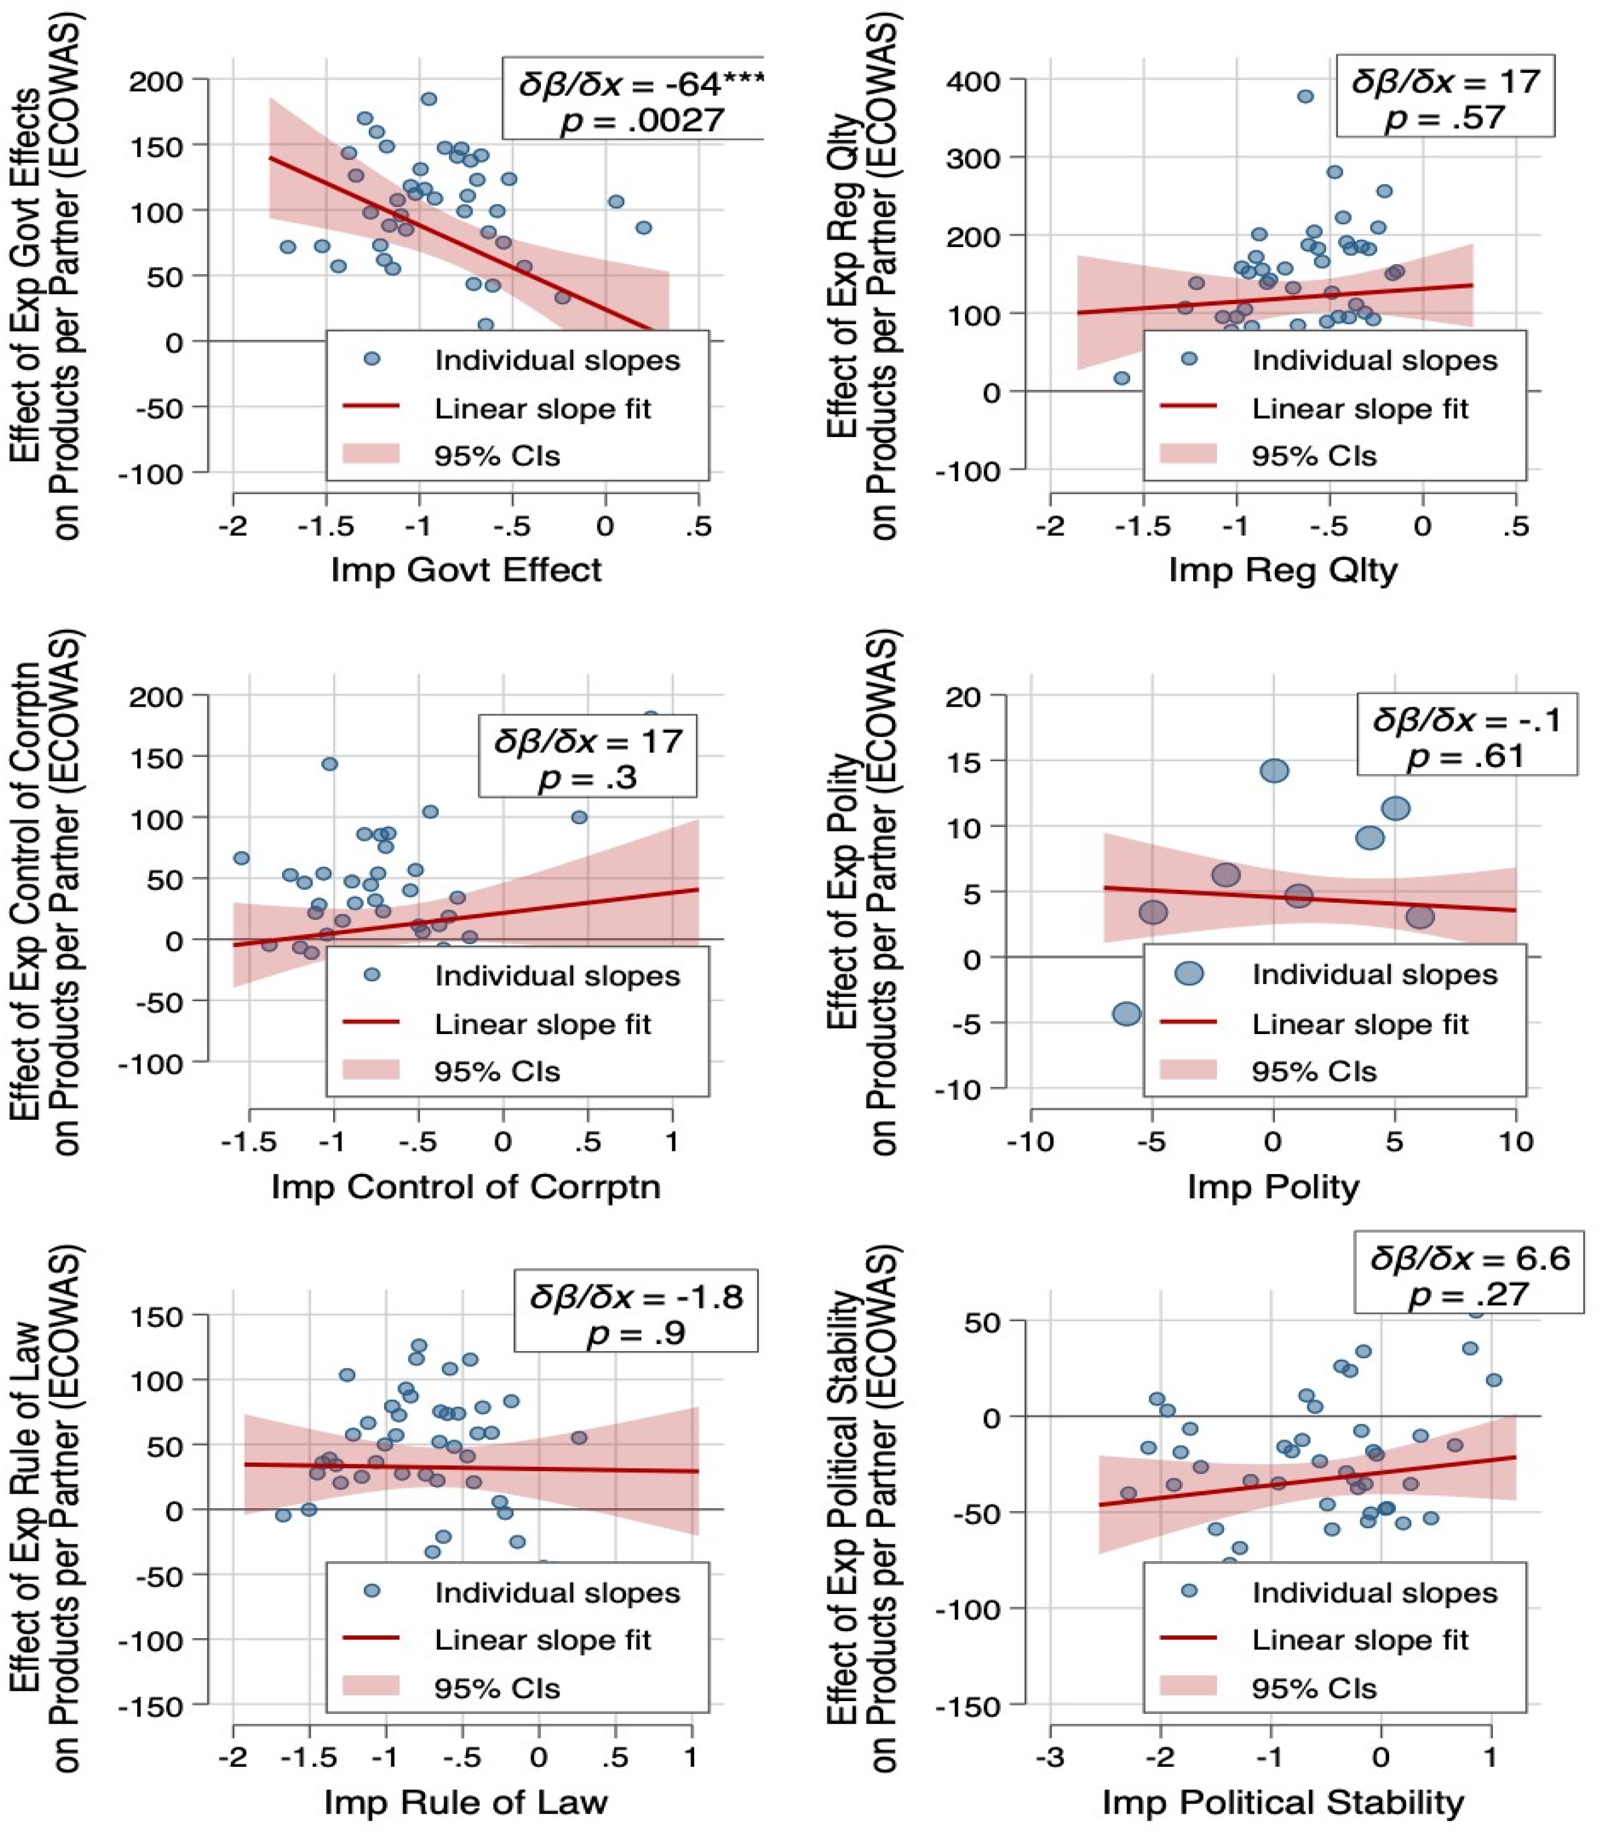
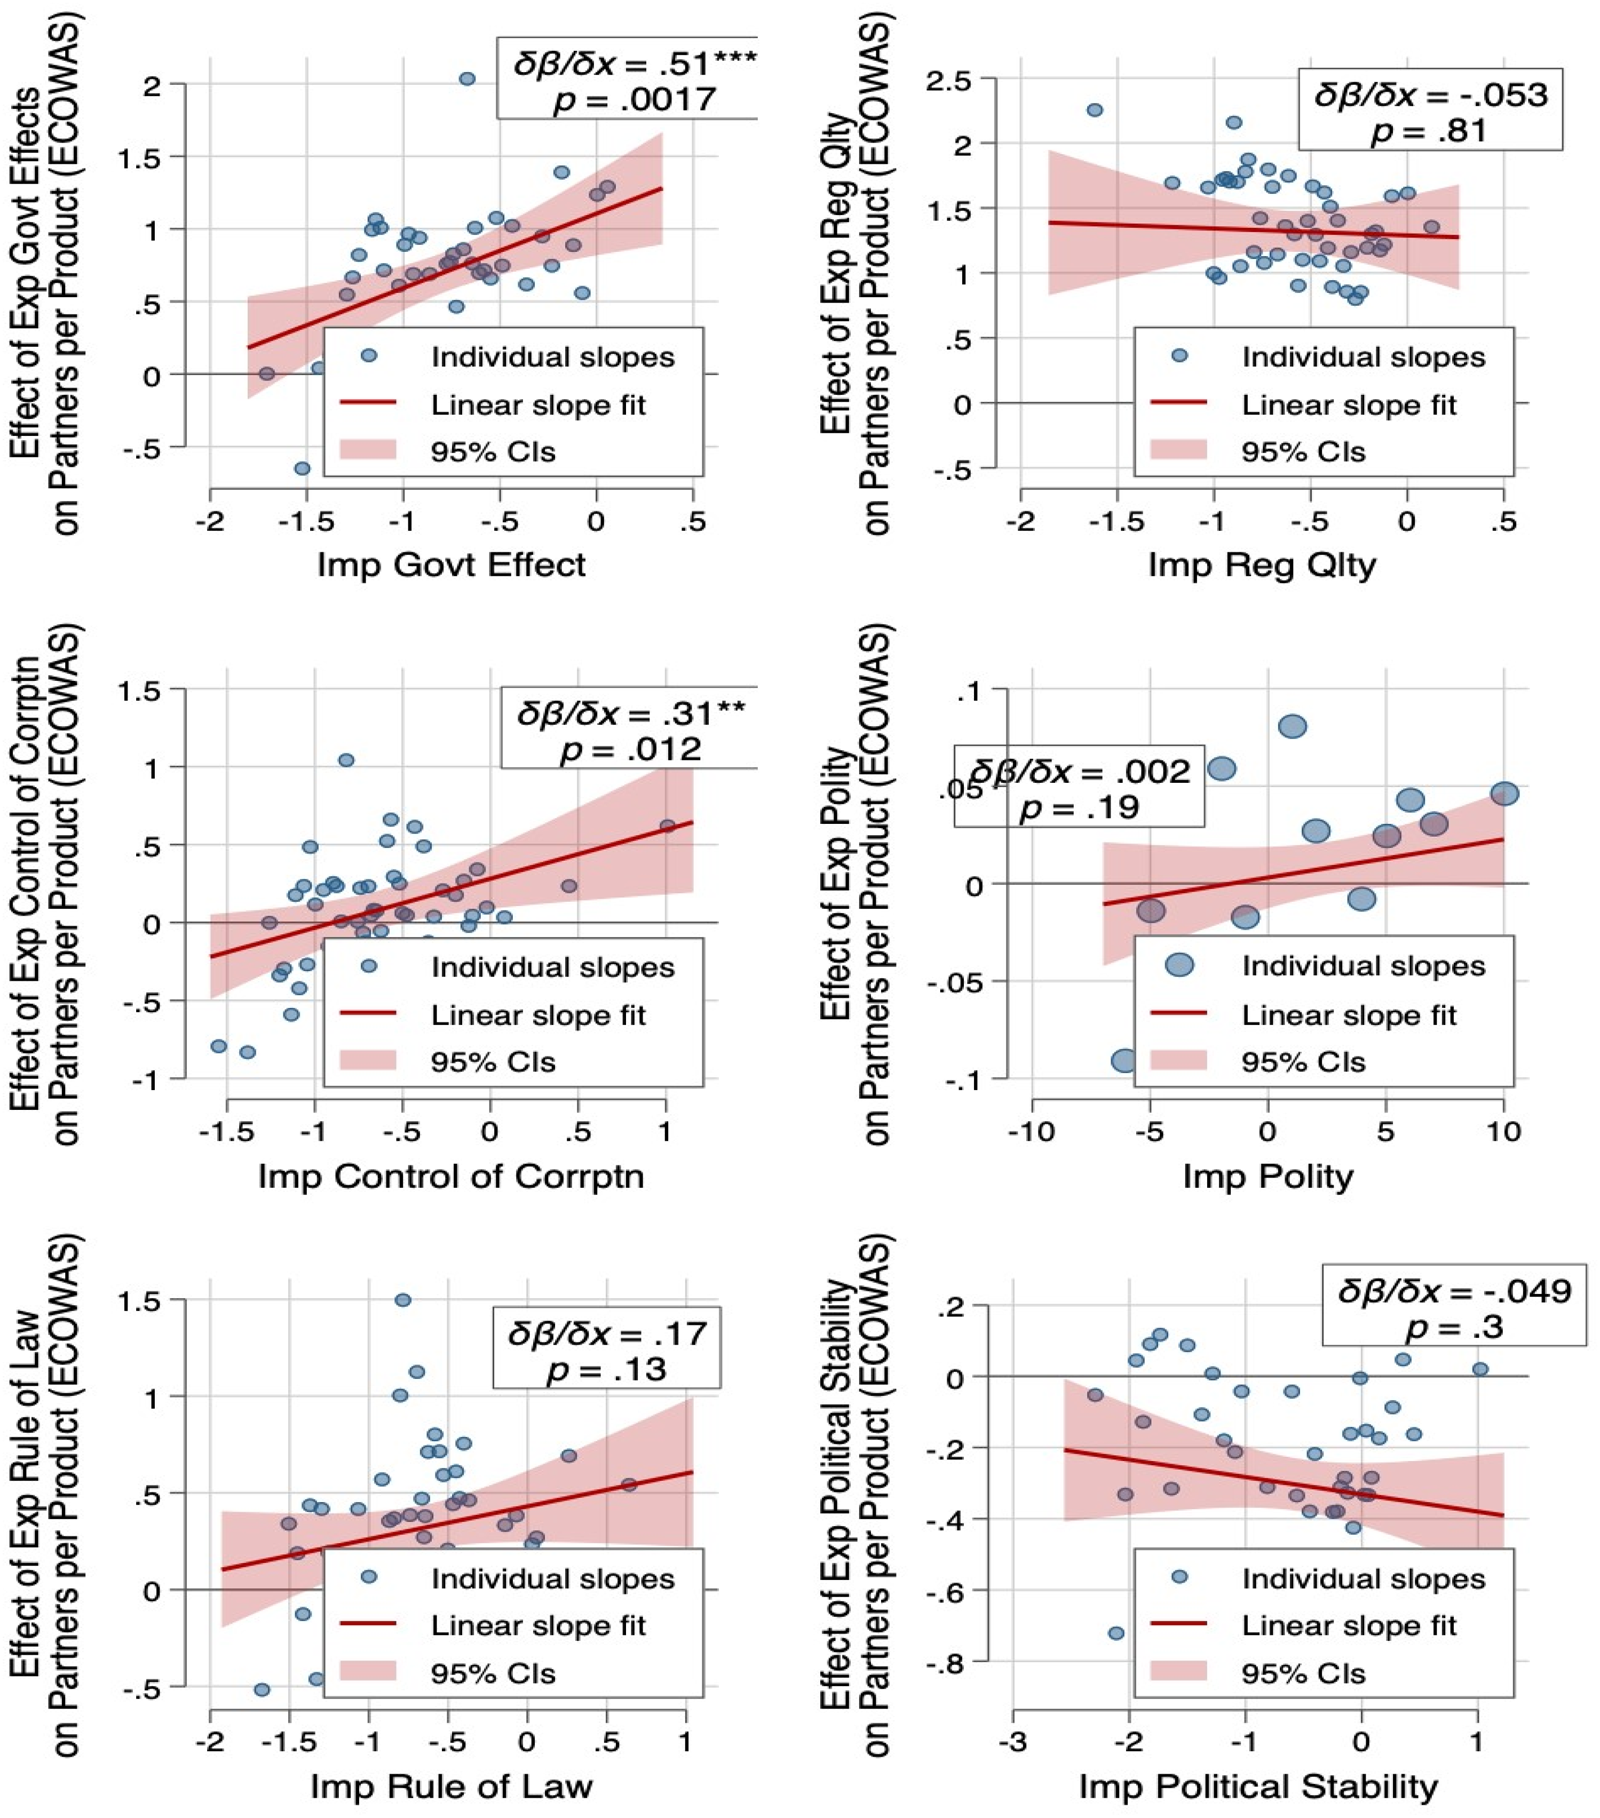
It is plausible that the observed variation in trade performance is shaped not only by geography or size but also by governance and institutional differences across member states. To explore this, Figures 6 and 7 present fitted estimates derived from interaction plots of exporter and importer governance indicators, to show the marginal effect of exporter governance on trade margins (products per partner in Figure 6 and partners per product in Figure 7) at varying levels of importer governance. Each slope is estimated across 50 quantiles of importer governance quality.
Interactive relationship between exporter and importer governance, institutions, and product concentration.

Figure 6 Long description
Six scatter plots arranged in 3 rows and 2 columns. Top-left scatter plot: The y-axis label is Effect of Exp Gov Effect(s) on Products per Part ner. The y-axis range is negative 100 to 200. The x-axis label is Imp Govt Eff. The x-axis range is negative 2 to 0. A text annotation reads delta beta over delta x equals negative 64 and p equals.0027. Points are plotted across the full x-axis range, with y-values spanning roughly negative 100 to about 200. A fitted line slopes downward. Legend text reads Individual slopes, Linear slope fit, 95 percent CI. Top-right scatter plot: The y-axis label is Effect of Exp Reg Qty(s) on Products per Part ner. The y-axis range is negative 200 to 400. The x-axis label is Imp Reg Qty. The x-axis range is negative 2 to 0. A text annotation reads delta beta over delta x equals 17 and p equals.57. Points are plotted across the full x-axis range, with y-values spanning roughly negative 200 to about 400. A fitted line slopes upward. Legend text reads Individual slopes, Linear slope fit, 95 percent CI. Middle-left scatter plot: The y-axis label is Effect of Exp Control of Corruptn(s) on Products per Part ner. The y-axis range is negative 100 to 200. The x-axis label is Imp Control of Corruptn. The x-axis range is negative 1.5 to 0. A text annotation reads delta beta over delta x equals 17 and p equals.3. Points are plotted across the full x-axis range, with y-values spanning roughly negative 100 to about 200. A fitted line slopes upward. Legend text reads Individual slopes, Linear slope fit, 95 percent CI. Middle-right scatter plot: The y-axis label is Effect of Exp Polity(s) on Products per Part ner. The y-axis range is negative 20 to 20. The x-axis label is Imp Polity. The x-axis range is negative 10 to 10. A text annotation reads delta beta over delta x equals 0 and p equals.61. Points are plotted across the full x-axis range, with y-values spanning roughly negative 20 to about 20. A fitted line is near horizontal. Legend text reads Individual slopes, Linear slope fit, 95 percent CI. Bottom-left scatter plot: The y-axis label is Effect of Exp Rule of Law(s) on Products per Part ner. The y-axis range is negative 100 to 150. The x-axis label is Imp Rule of Law. The x-axis range is negative 2 to 0. A text annotation reads delta beta over delta x equals negative 1.8 and p equals.9. Points are plotted across the full x-axis range, with y-values spanning roughly negative 100 to about 150. A fitted line slopes slightly downward. Legend text reads Individual slopes, Linear slope fit, 95 percent CI. Bottom-right scatter plot: The y-axis label is Effect of Exp Political Stability(s) on Products per Part ner. The y-axis range is negative 150 to 150. The x-axis label is Imp Political Stability. The x-axis range is negative 3 to 0. A text annotation reads delta beta over delta x equals 36 and p equals.27. Points are plotted across the full x-axis range, with y-values spanning roughly negative 150 to about 150. A fitted line slopes upward. Legend text reads Individual slopes, Linear slope fit, 95 percent CI.
Interactive relationship between exporter and importer governance, institutions, and product-partner networks.

Figure 7 Long description
Six scatter plots display the effect of different governance indicators on trade margins. Each plot includes individual slopes, a linear slope fit and 95 percent confidence intervals. 1. The first plot shows the effect of government effectiveness on products per partner. The horizontal axis ranges from negative 2 to 2 and the vertical axis ranges from negative 1.5 to 1.5. The slope is 0.51 with a p-value of 0.0017. 2. The second plot illustrates the effect of regulatory quality on partners per product. The horizontal axis ranges from negative 5 to 5 and the vertical axis ranges from negative 1.5 to 1.5. The slope is negative 0.053 with a p-value of 0.81. 3. The third plot depicts the effect of control of corruption on products per partner. The horizontal axis ranges from negative 2 to 2 and the vertical axis ranges from negative 1.5 to 1.5. The slope is 0.31 with a p-value of 0.012. 4. The fourth plot shows the effect of polity on partners per product. The horizontal axis ranges from 0 to 10 and the vertical axis ranges from negative 1.5 to 1.5. The slope is 0.002 with a p-value of 0.19. 5. The fifth plot presents the effect of rule of law on products per partner. The horizontal axis ranges from negative 2 to 2 and the vertical axis ranges from negative 1.5 to 1.5. The slope is 0.17 with a p-value of 0.13. 6. The sixth plot shows the effect of political stability on partners per product. The horizontal axis ranges from negative 5 to 5 and the vertical axis ranges from negative 1.5 to 1.5. The slope is negative 0.049 with a p-value of 0.3.
Figure 6 shows that governance complementarity is limited for this margin. Of the six governance indicators evaluated, only government effectiveness exhibits a statistically significant interaction. The negative slope in this panel suggests that the marginal effect of exporter governance effectiveness on trade concentration decreases as importer governance improves. In practical terms, stronger governance in both trading partners may not necessarily increase trade concentration, and may even introduce institutional frictions that reduce it. What this suggests is that while governance quality may be improving across the region, what matters more for trade within ECOWAS is how these improvements interact. Countries may react strategically to each other’s institutional changes, either through deliberate alignment or subtle retaliatory adjustments, especially when governance mechanisms, such as customs procedures, certification, or contract enforcement, serve as implicit or explicit trade policy tools. It suggests that there are no immediately apparent complementarities to this aspect of trade (i.e. number of products per partner).
By contrast, Figure 7, which plots partners per product (a core measure of extensive margins), reveals more robust patterns of institutional interaction. Exporter government’s efforts to control corruption and improve the rule of law have significant and positive marginal effects at higher levels of importer governance. This suggests a meaningful degree of complementarity in institutional reinforcement – both exporting and importing countries exhibit improvements in governance, particularly in enforcement-related domains, and the ability of ECOWAS firms to distribute their products across a wider set of regional markets is substantially enhanced. These network effects are precisely the kinds of outcomes that regional integration schemes aim to deliver. Both Figures 6 and 7 imply that the influence of governance on trade margins in ECOWAS is neither uniform nor linear. While exporter governance alone may have some effects, the stronger product-based networks that regional integration seeks to reinforce may still require the appropriate complementary or reciprocal improvements by trading partners.
5. Empirical Method
The study adopts a stepwise approach to understanding intra-ECOWAS trade. It begins by establishing baseline trade patterns and core determinants of trade flows before incorporating product-level trade measures by destination (ECOWAS, Africa, Rest of World) to assess whether external ties complement or substitute regional trade. Governance variables are introduced next to evaluate whether misalignments constrain trade integration. Both the direct effects and interactive partner-country effects, with a focus on institutional quality, rule of law, regulatory quality, and corruption are tested. Finally, the analysis extends to intensive and extensive trade margins to capture both the depth (value per product-partner) and breadth (diversity of goods and partners) of trade. This holistic framework enables the study to move beyond aggregate flows and explore how governance, structural attributes, and network linkages jointly shape regional trade dynamics and integration.
Given the nature of bilateral trade analysis, where each interaction between all potential trade partners is analysed, the gravity model is particularly suitable. This model, inspired by Newton’s law of gravity, uses the concepts of distance and ‘economic mass’ to explain trade flows. First introduced in seminal papers by Tinbergen (Reference Tinbergen1962) and Pöyhönen (Reference Pöyhönen1963), the model was later theoretically formalized by Anderson (Reference Anderson1979). The empirical specification put forth by Mátyás (Reference Mátyás1997) informs the version used in this study. The gravity model is one of the most effective empirical models in trade economics, well-regarded for its ability to capture the variation in interactions across space for trade and factors of production. Its main advantage lies in its capacity to infer trade costs in settings where such impediments are often unobservable.
This study examines trade in the ECOWAS region using the gravity model framework (Anderson and Van Wincoop, Reference Anderson and Van Wincoop2003), progressively integrating trade networks, industry attributes, and governance to provide a more comprehensive analysis. The analysis will first conduct a standard gravity model, estimating trade flows between ECOWAS countries while controlling for conventional gravity variables such as distance, shared borders, common language, economic size, exchange rates, tariffs, and remoteness-adjusted indicators of market access (Yotov et al., Reference Yotov, Piermartini and Larch2016). Importantly, the model employs the augmented version which accounts for the zero problem that arises with the log of trade values (Silva and Tenreyro, Reference Silva and Tenreyro2006), and applies a Poisson Pseudo maximum likelihood (PPML) estimation to capture this (Silva and Tenreyro, Reference Silva and Tenreyro2006).
Following some of the theoretical underpinnings of De Groot et al. (Reference De Groot, Linders, Rietveld and Subramanian2004), and subsequently Alvarez et al. (Reference Alvarez, Barbero, Rodríguez-Pose and Zofio2018) and Liu et al. (Reference Liu, Lu and Wang2020), the study incorporates political institutions and governance features that are closely tied to economic interactions. Using Liu et al. (Reference Liu, Lu and Wang2020)’s adaptation of the basic gravity model (Anderson and Van Wincoop, Reference Anderson and Van Wincoop2003) obtains:
 \begin{equation*}{T_{ij}} = \frac{{{Y_i}{Y_j}}}{{{D_{ij}}}}{\eta _{ij}}\end{equation*}
which represents trade flows from country  $i$ to country
 $j$, and is proportional to the gross domestic product (GDP) of the two countries, denoted by
 ${Y_i}$ and
 ${Y_j}$, which in turn is inversely proportional to their trade distance
 ${D_{ij}}$. The stochastic error
 ${\eta _{ij}}$ accounts for the deviations from this functional relationship, and is usually assumed to be independent of the regressors, that is,
 $\mathbb{E}\left( {{\eta _{ij}}\mid {Y_i},{Y_j},{D_{ij}}} \right) = 1$.
 \begin{equation*}\mathbb{E}\left( {{T_{ij}}} \right) = \frac{{{Y_i}{Y_j}}}{{{D_{ij}}}}\end{equation*}
We therefore introduce a new assumption which argues that  ${D_{ij}}$ is of the following form:
 \begin{equation*}{D_{ij}} = {\text{exp}}\left( {{\text{INSTCOM}}{{\text{P}}_{ij}}} \right) \cdot {\text{DIS}}{{\text{T}}_{ij}}\end{equation*}
Here  ${\text{INSTCOM}}{{\text{P}}_{ij}}$ quantifies the level of reciprocity or complementarity between country
 $i$ and country
 $j$, which includes 6 different measures: rule of law, regulatory quality, government effectiveness, political stability and absence of violence/terrorism, control of corruption, and voice and accountability. In addition, it also includes a measure of political institutions from Polity V. These governance and institutional elements are interacted between country
 $i$ and country
 $j$ to obtain a trade resistance term that functions in a similar manner to other resistance terms such as distance, common language, contiguity, etc. In addition, remoteness, and multilateral resistance terms are also captured in the model. The initial model specification is of the form:
 \begin{equation*}\text{In}{T_{ijt}} = {\alpha _0} + {\alpha _1}\text{In}{Y_{jt}} + {\alpha _2}\text{In}{Y_{it}} + {\alpha _k}{Z_{it}} + {\alpha _{k2}}{Z_{jt}} + {\theta _1}\text{INSTCOM}{P_{ij}} + {\theta _2}\text{In}\,\,\text{DIS}{T_{ij}} + {\theta _i}{Z_{ij}} + {\varepsilon _{jt}} + {u_{ijt}}\end{equation*}
where  ${\text{ln}}{T_{ijt}}$ is the trade flow or volume of trade from country
 $i$ to country
 $j$ at time
 $t$;
 ${Y_{it}}$ is the GDP of the exporting country
 $i$ and
 ${Y_{jt}}$ is the GDP of country
 $j$, both at time
 $t$.
 ${Z_{it}}$ and
 ${Z_{jt}}$ are both vectors of control variables for country
 $i$ and country
 $j$ respectively, which include CPI, tariffs, gross fixed capital formation, industry composition, and industry per partner concentration, all at time .
 ${\text{Dis}}{{\text{t}}_{ij}}$ is the distance between country
 $i$ and country
 $j$.
 ${\theta _i}{Z_{ij}}$ are other gravity variables such as common language, contiguity, common colony, and exchange rate. Finally, to capture any other pair-determined characteristics that may impact on trade between specific bilateral trade partners within ECOWAS, are the remoteness and fixed-country pair and time effects:
 ${\varepsilon _{jt}}$ and
 ${u_{ijt}}$,. and to circumvent the log of zero trade issue, the Poisson Pseudo Maximum Likelihood (PPML) is used to estimate the gravity equation, which does away with the need to log the trade value. The resultant augmented gravity model is specified as:
 \begin{equation*}{T_{ijt}} = {\alpha _0} + {\alpha _1}{\text{ln}}{Y_{it}} + {\alpha _2}{\text{ln}}{Y_{jt}} + {\alpha _k}{Z_{it}} + {\alpha _{k2}}{Z_{jt}} + {\theta _1}{\text{INSTCOM}}{{\text{P}}_{ij}} + {\theta _2}{\text{lnDIS}}{{\text{T}}_{ij}} + {\theta _i}{Z_{ij}} + {\varepsilon _{jt}} + {u_{ijt}}\end{equation*}
where the only change is the removal of the log from the trade value. A key contribution of this paper is that we look beyond just trade values and consider multiple other channels of trade that do not specifically deal with the volume or value of trade. The other concepts that  ${T_{ijt}}$ stands for in our analysis are listed and described in Table 1.
6. Results and Discussion
6.1 Gravity Model Estimations
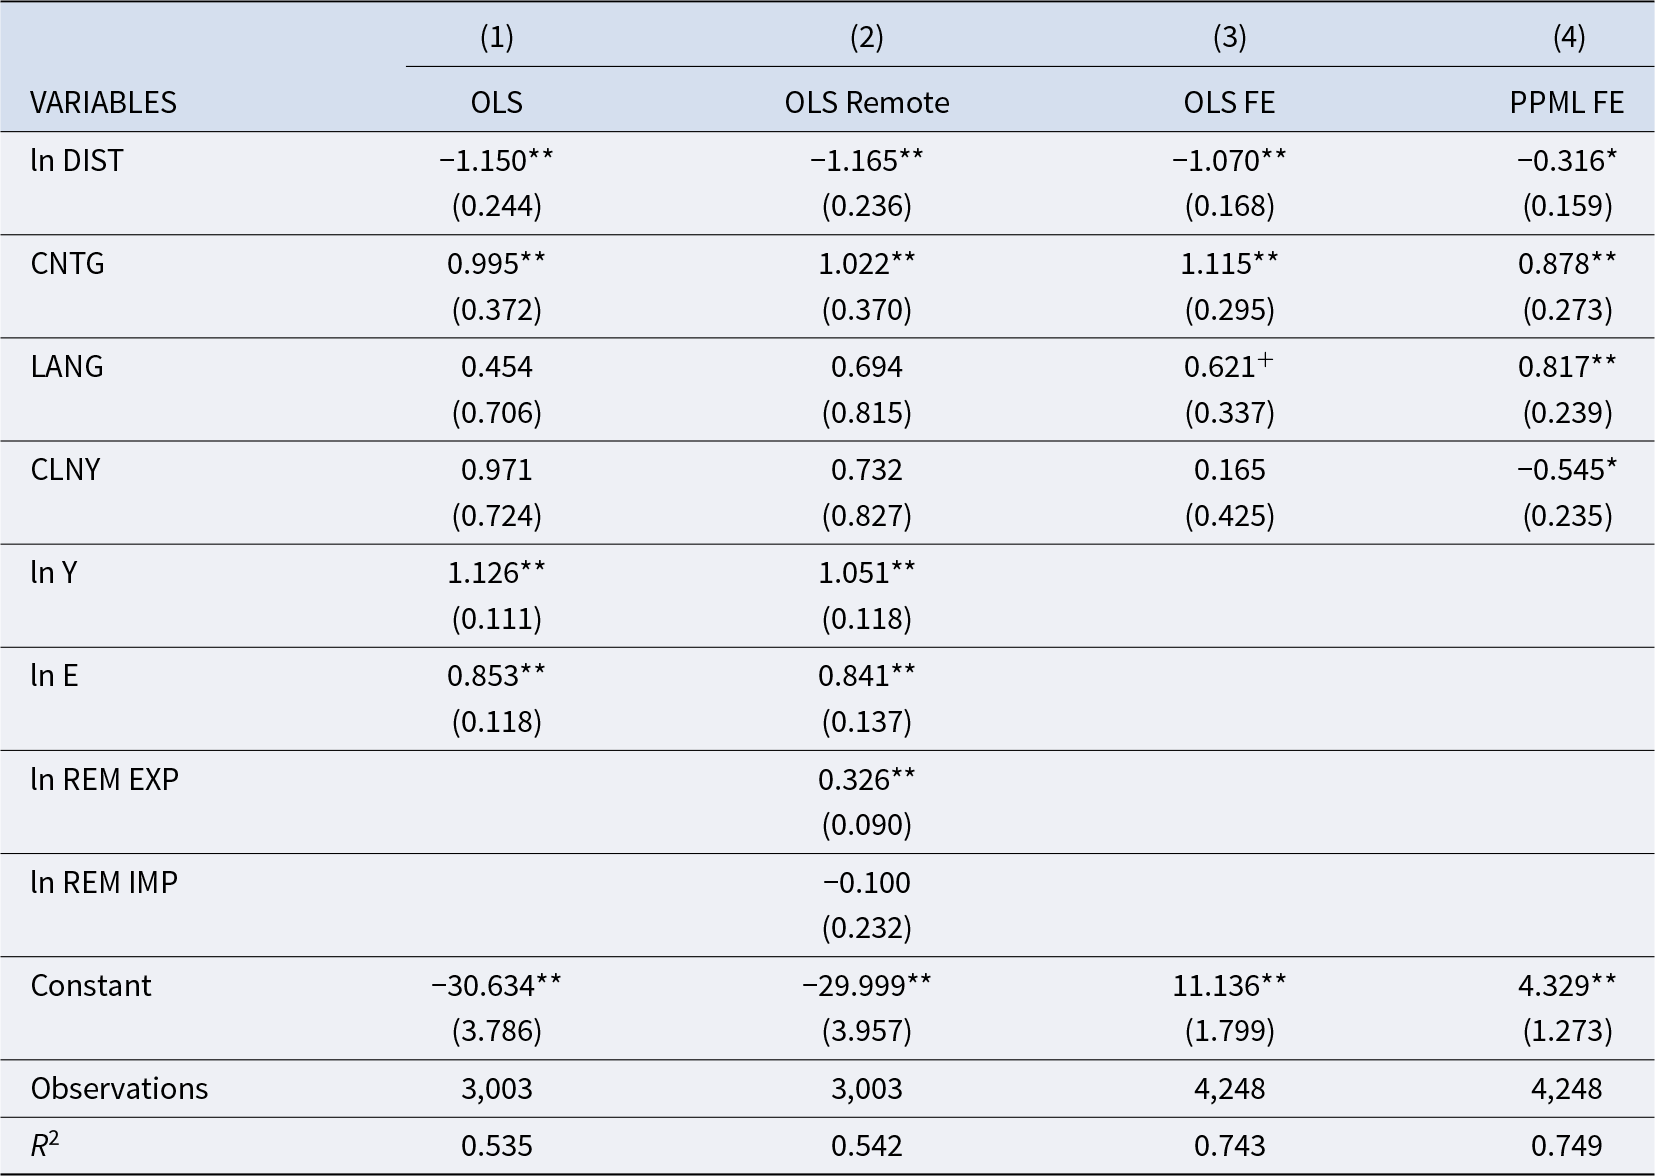
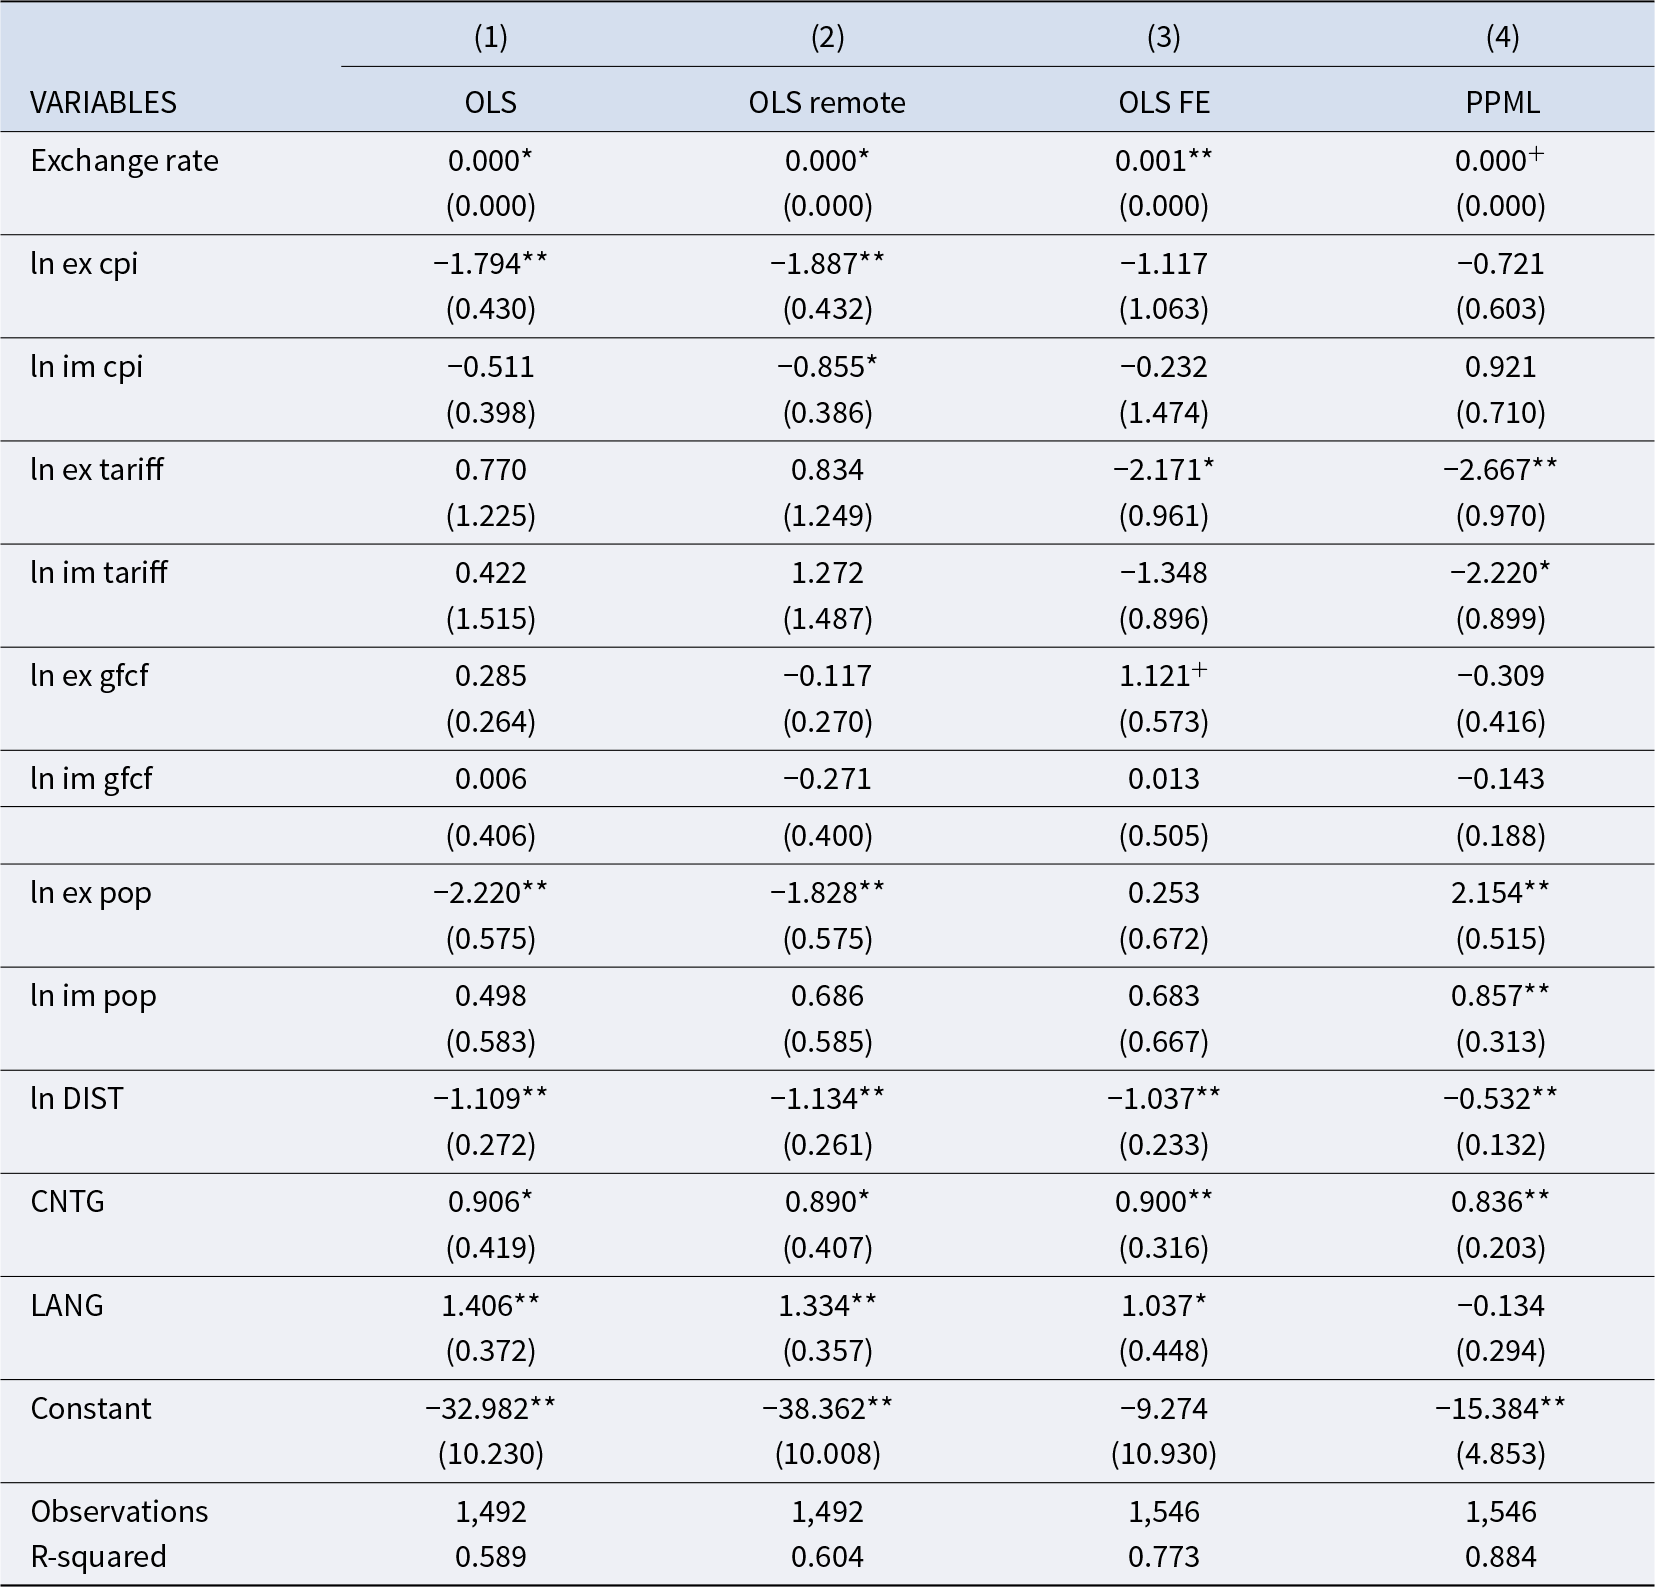
The baseline gravity model produced results align with theoretical expectations. Distance has a negative effect on bilateral trade within ECOWAS countries, whereas contiguity and shared language has a positive influence on trade flows. However, once remoteness and country size are accounted for, the effect of language, which was previously significant and positive, becomes insignificant, particularly in the PPML estimation. The included gravity variables explain a substantial proportion of the variation in bilateral trade within ECOWAS (see Table A1). Additional trade determinants, such as exchange rates, inflation, tariffs, population, and domestic capital investment, are incorporated to provide further insight into intra-ECOWAS trade. All the potential confounders have expected coefficient signs, and the results for distance remain robust across all specifications. In the fixed-effects models (OLS FE and PPML FE), the exporter-time and importer-time fixed effects fully absorb the multilateral resistance terms, country size, and any other time-varying country-specific determinants (see Table A1 and Table A2).
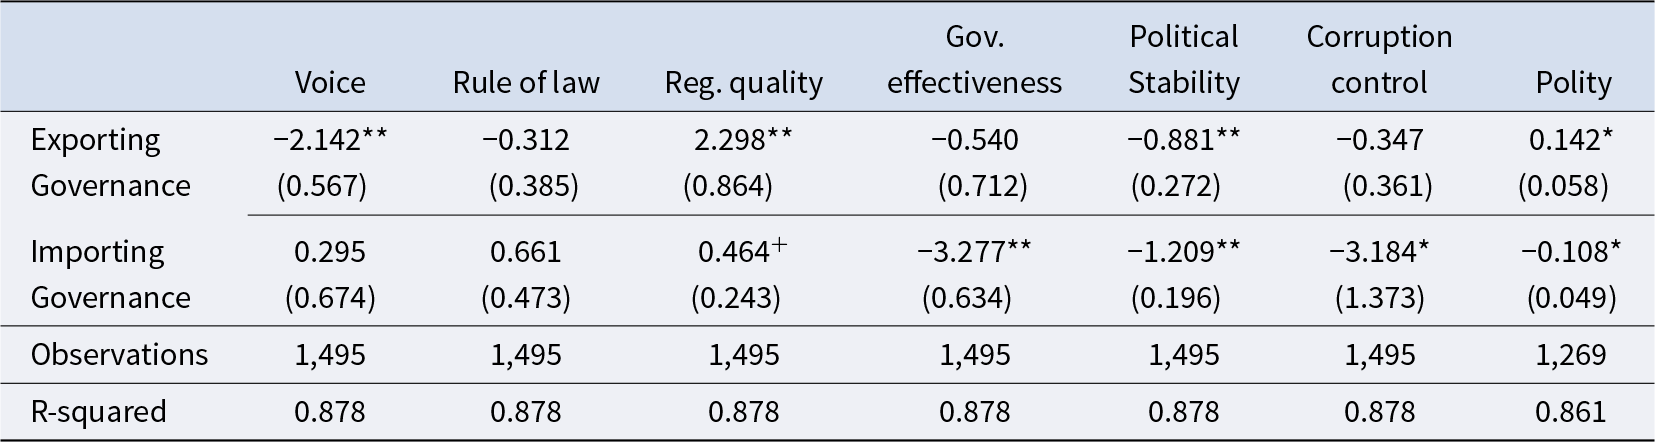
To what extent is intra-ECOWAS bilateral trade influenced by governance in both the exporting and importing countries? Table 2 provides strong evidence that governance plays a crucial role, albeit in a non-uniform manner. For exporting countries, governance variables, such as voice and accountability and overall political institutions, appear particularly significant in shaping intra-ECOWAS exports. The coefficient on exporting country voice and accountability is statistically significant but negative, suggesting that higher levels of voice and accountability in exporting countries are associated with lower intra-ECOWAS trade volumes once country-specific effects are accounted for.
Domestic and foreign governance and intra-ECOWAS trade

Table 2 Long description
Regression results relate intra-regional trade to separate governance indicators for exporting and importing countries, reported as coefficients with standard errors and significance markers. For exporters, voice has a large negative association and regulatory quality has a large positive association, both statistically strong; corruption control is also negative and statistically strong. Exporter rule of law, government effectiveness, political stability, and polity are smaller in magnitude, with polity showing a small positive association. For importers, government effectiveness and corruption control show large negative associations, and political stability is also negative and statistically strong; regulatory quality is modestly positive with weaker statistical support. Importer voice and rule of law are positive but not statistically strong, while polity is slightly negative and statistically significant. Model fit is high and similar across specifications, with about 1,495 observations for most columns and fewer for the polity column.
Notes: Variables included in the regression but not reported are exchange rate, distance, contiguity, language, partner per reporter Africa, partner per reporter ECOWAS, partner per reporter row, industries per partner, industries per country, exporting and importing – CPI, tariffs, gross fixed capital formation, population. Institutional variables represent individual regressions.
Standard errors in parentheses. ** is p < 0.01, * is p < 0.05, + is p < 0.1.
Conversely, in terms of governance and institutions in the importing country, corruption control, political instability and control of violence, and government effectiveness are all strongly and negatively correlated with exports within the region, which highlights how governance effects are not as clear-cut in their effects as often expected. Notably, importing country rule of law and regulatory quality are not negatively associated with trade; if anything, regulatory quality displays a marginally positive relationship. Most of the governance measures in the importing countries appear to be associated with lower intra-ECOWAS trade volumes, which is somewhat counter-intuitive given the general expectation that better governance should facilitate economic transactions. This contrast with the common expectation of uniformly positive governance effects echoes findings that the exporter’s legal-institutional environment often binds more strongly, given the enforcement and contracting realities (Berkowitz et al., Reference Berkowitz, Moenius and Pistor2004). This may be because it is generally expected that importing country institutions will have a much weaker impact on trade than exporting country institutions (Berkowitz et al., Reference Berkowitz, Moenius and Pistor2004). It also accords with the distinction between rule-based and relation-based governance: asymmetries, and especially gaps, can depress trade when one side tightens rules that the other cannot readily match (Li and Samsell, Reference Li and Samsell2009). It may also be because of the very nature of firms and exporters in ECOWAS member states.
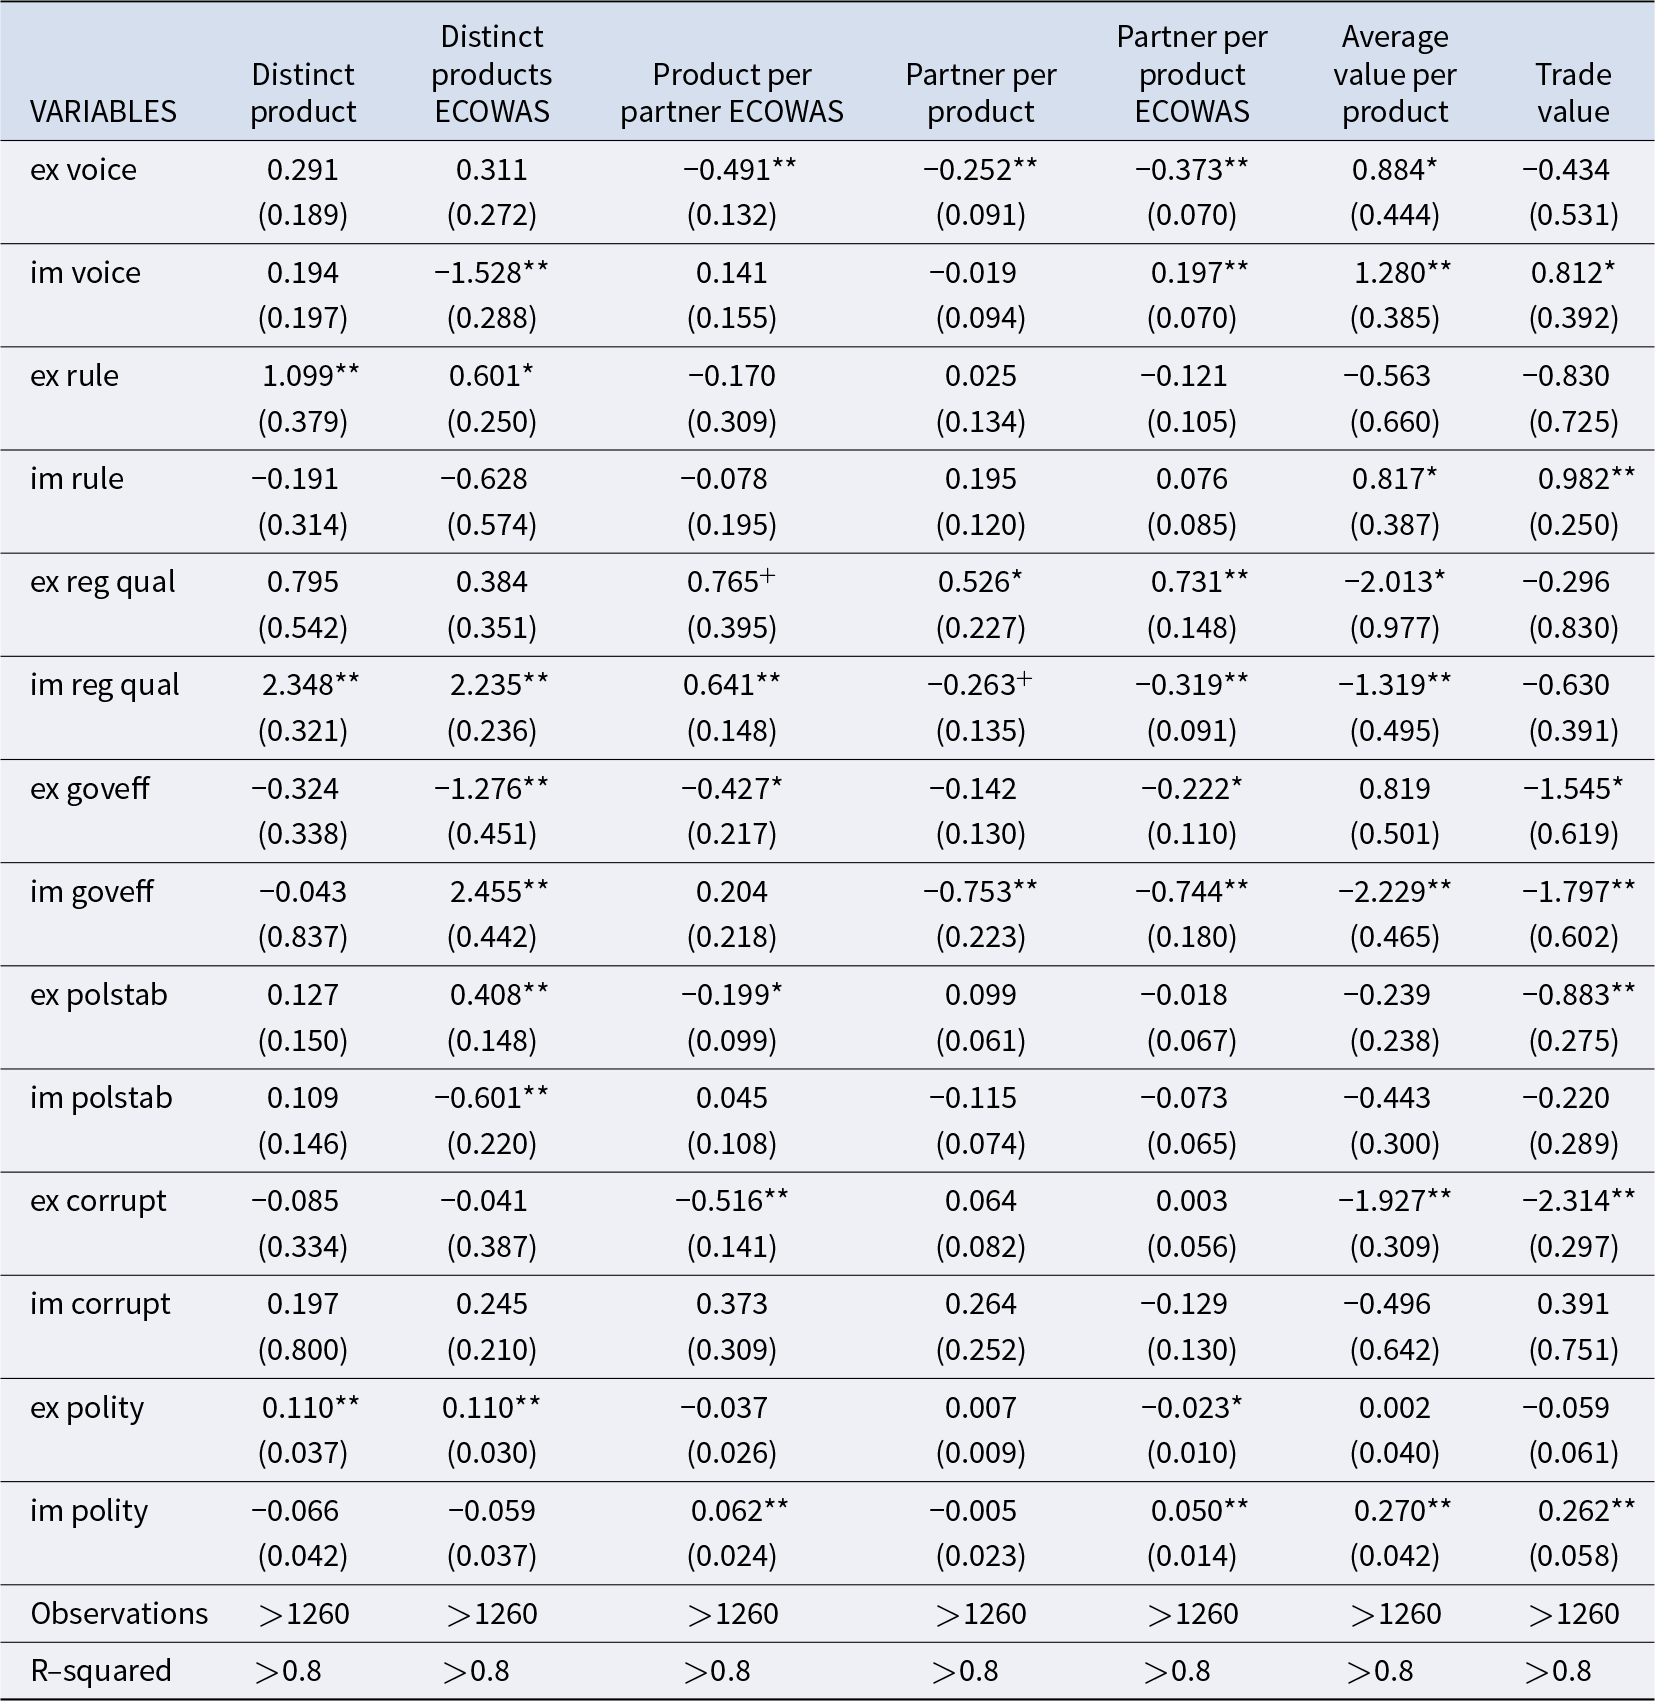
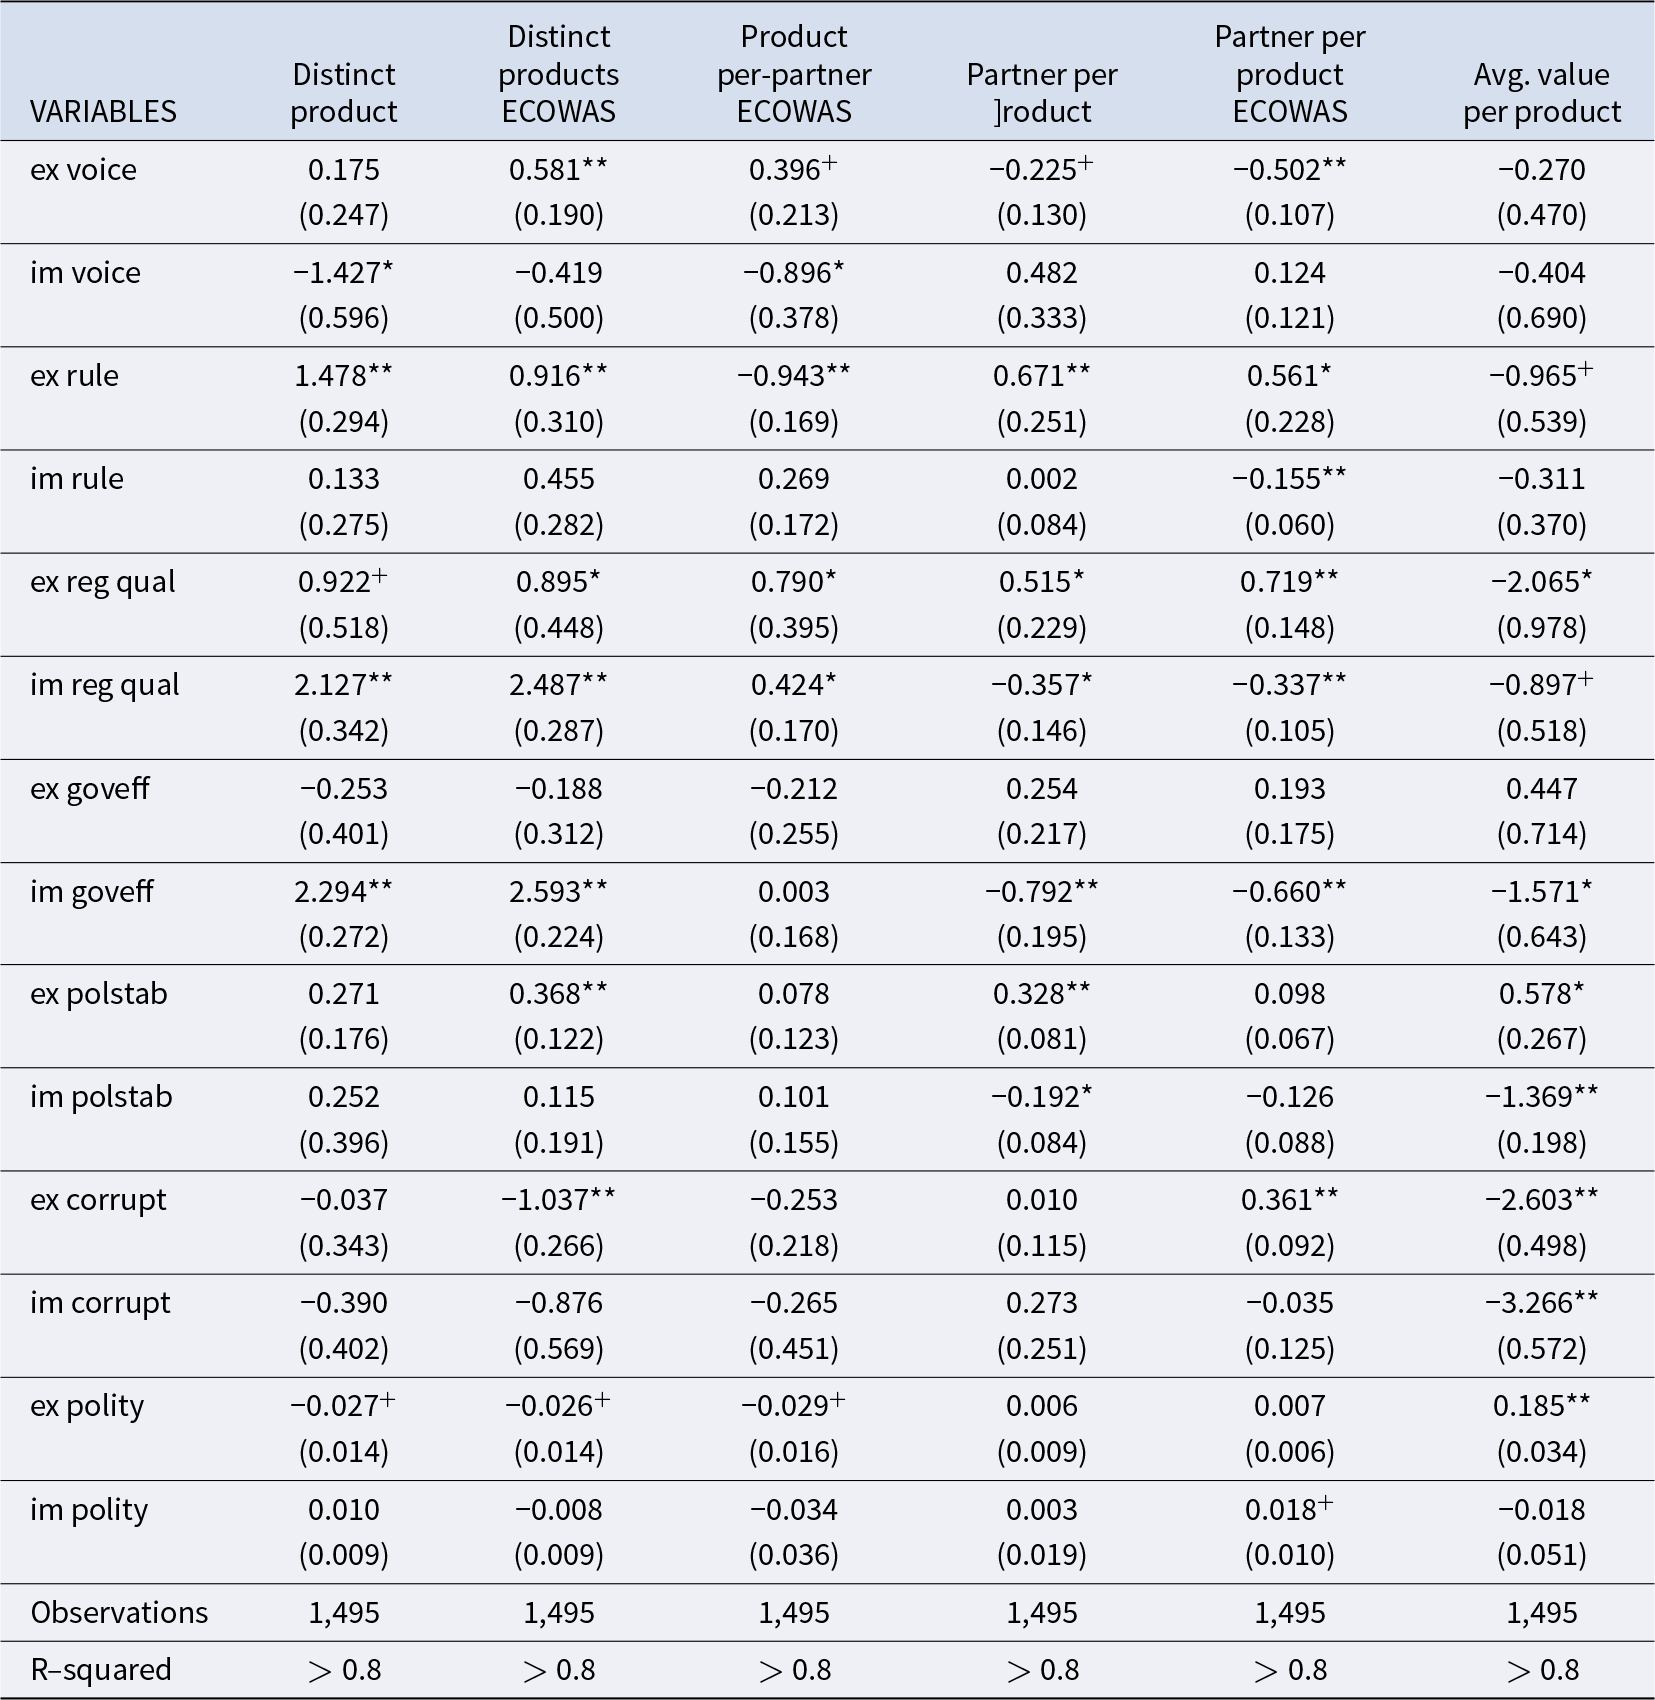
There is some evidence suggesting that relation-based countries, similar to many ECOWAS member states, may see trade flows reduce due to importing country institutions, relative to what is observed in rule-based countries (Li and Samsell, Reference Li and Samsell2009). This means that governance influences trade not only at the micro-level but also through strategic interactions between countries. National institutions do not operate in isolation; rather, they interact through historical, ideological, and cultural relationships between states. These strategic responses to governance improvements (or deterioration) may be a more decisive factor in intra-ECOWAS trade patterns. Indeed, ECOWAS-specific evidence generally reports positive institutional impacts on trade, which our negative importer-side estimates partially counteract, suggesting heterogeneity by margin, period, and estimator (Oshota and Wahab, Reference Oshota and Wahab2022). Additionally, it is possible that the manner in which exporting and importing country institutions and governance influence trade is not necessarily through intensive margins but rather through extensive margins. This is further examined in Table A3 in the appendix, where the impact of each individual governance measure, from both the importer and exporter side, is analysed. The results suggest that trade margins such as product diversity, product networks and even product penetration within ECOWAS, are indeed positively linked with governance. This margin-specificity is consistent with the broader literature that emphasizes institutional frictions as operating differently across extensive versus intensive margins (Kim et al., Reference Kim, Londregan and Ratkovic2019).
When considering governance effects on both the intensive and extensive margins of bilateral trade, Table 3 indicates that, in general, there are no positive reciprocities and that this is consistent across most of the trade features. Such tit-for-tat patterns resonate with work on overlapping regional institutions and dispute dynamics, where institutional layering can generate defensive adjustments rather than uniformly liberalizing effects (Gomez-Mera and Molinari, Reference Gomez-Mera and Molinari2014). What it does show, is some evidence of tit-for-tat, where negative indications occur on both importing and exporting country governance and institutions and their impact on trade features. Government effectiveness exhibits the clearest reciprocity pattern, particularly for partner-per-product networks and overall trade value, where both exporter and importer governance coefficients are negative and statistically significant.
Exporter and importer governance effects (reciprocities) on trade features

Table 3 Long description
Regression coefficients relate exporter and importer governance indicators to seven trade outcomes: product variety, ECOWAS-specific variety and intensity measures, partner diversification, average value per product, and total trade value. Importer regulatory quality is consistently positive for variety and intensity, including distinct products, distinct products in ECOWAS, and products per partner in ECOWAS, while it is negative for partner-per-product measures and average value per product. Exporter voice is associated with fewer products per partner in ECOWAS and fewer partners per product (both overall and in ECOWAS), but higher average value per product; its link to total trade value is not statistically clear. Importer voice is strongly negative for distinct products in ECOWAS but positive for partner per product in ECOWAS, average value per product, and trade value. Exporter rule of law increases distinct products (overall and in ECOWAS), whereas importer rule of law raises average value per product and trade value. Exporter government effectiveness reduces ECOWAS distinct products and products per partner in ECOWAS and is linked to lower trade value, while importer government effectiveness increases ECOWAS distinct products but reduces partner-per-product measures, average value per product, and trade value. Exporter corruption is linked to fewer products per partner in ECOWAS and markedly lower average value per product and trade value; other corruption estimates are less precise. Results come from a PPML gravity-style specification with many controls and fixed effects, so coefficients indicate conditional associations rather than definitive causal effects.
Notes: Variables included in the regression but not reported are exchange rate, distance, contiguity, language, extensive margins covariates, exporting and importing – CPI, tariffs, gross fixed capital formation, population. Exporter time fixed effects, importer time fixed effects, multilateral resistance terms. Institutional variables added in pairs.
Standard errors in parentheses. ** is p < 0.01, * is p < 0.05, + is p < 0.1. PPML estimation.
This suggests that improvements in administrative effectiveness do not necessarily translate into broader regional trade networks and may instead be associated with a consolidation of existing trade relationships. There is also some evidence of this. When political stability, and absence of violence and terrorism, are considered, other distinct patterns emerge. Regulatory quality appears to be most consistently associated with stronger product-partner networks and greater bilateral product penetration, although its effects on broader product variety are mixed. Political stability exhibits a less uniform relationship, with some measures indicating greater product-reach, while others suggest a narrowing of trade variety. Improvements in institutional quality may therefore support more structured and stable trade relationships, but are not necessarily linked to higher levels of product diversification. This is similar to evidence in the literature that suggests integration paths differ across blocs, with network structure and institutional design conditioning how governance changes map into diversification versus consolidation (Krapohl and Fink, Reference Krapohl and Fink2013).
In some cases, stronger governance in importing countries appears to constrain the diversity of products traded, possibly due to stricter regulatory frameworks or shifting trade preferences that do not necessarily favor ECOWAS exporters. Governance also shapes the ability of ECOWAS firms to enter new markets. Institutional factors, such as regulatory quality and the rule of law in exporting countries, are associated with greater market reach and product diversification within ECOWAS and beyond. This suggests that well-governed firms are better positioned to navigate complex trade networks. However, the intensive margin of trade presents a different picture. Stronger governance in exporting countries does not appear to support an increase in the value of traded goods. In fact, improvements in governance may impose compliance costs or regulatory constraints that limit firms’ ability to scale up trade value. Only the overall quality of political institutions in exporting countries seems to have a positive influence on the average value of traded products. This aligns with evidence that political-institutional features matter more for the extensive margin than for intensive volumes, particularly in products where interpersonal contact and monitoring are salient (Kim et al., Reference Kim, Londregan and Ratkovic2019).
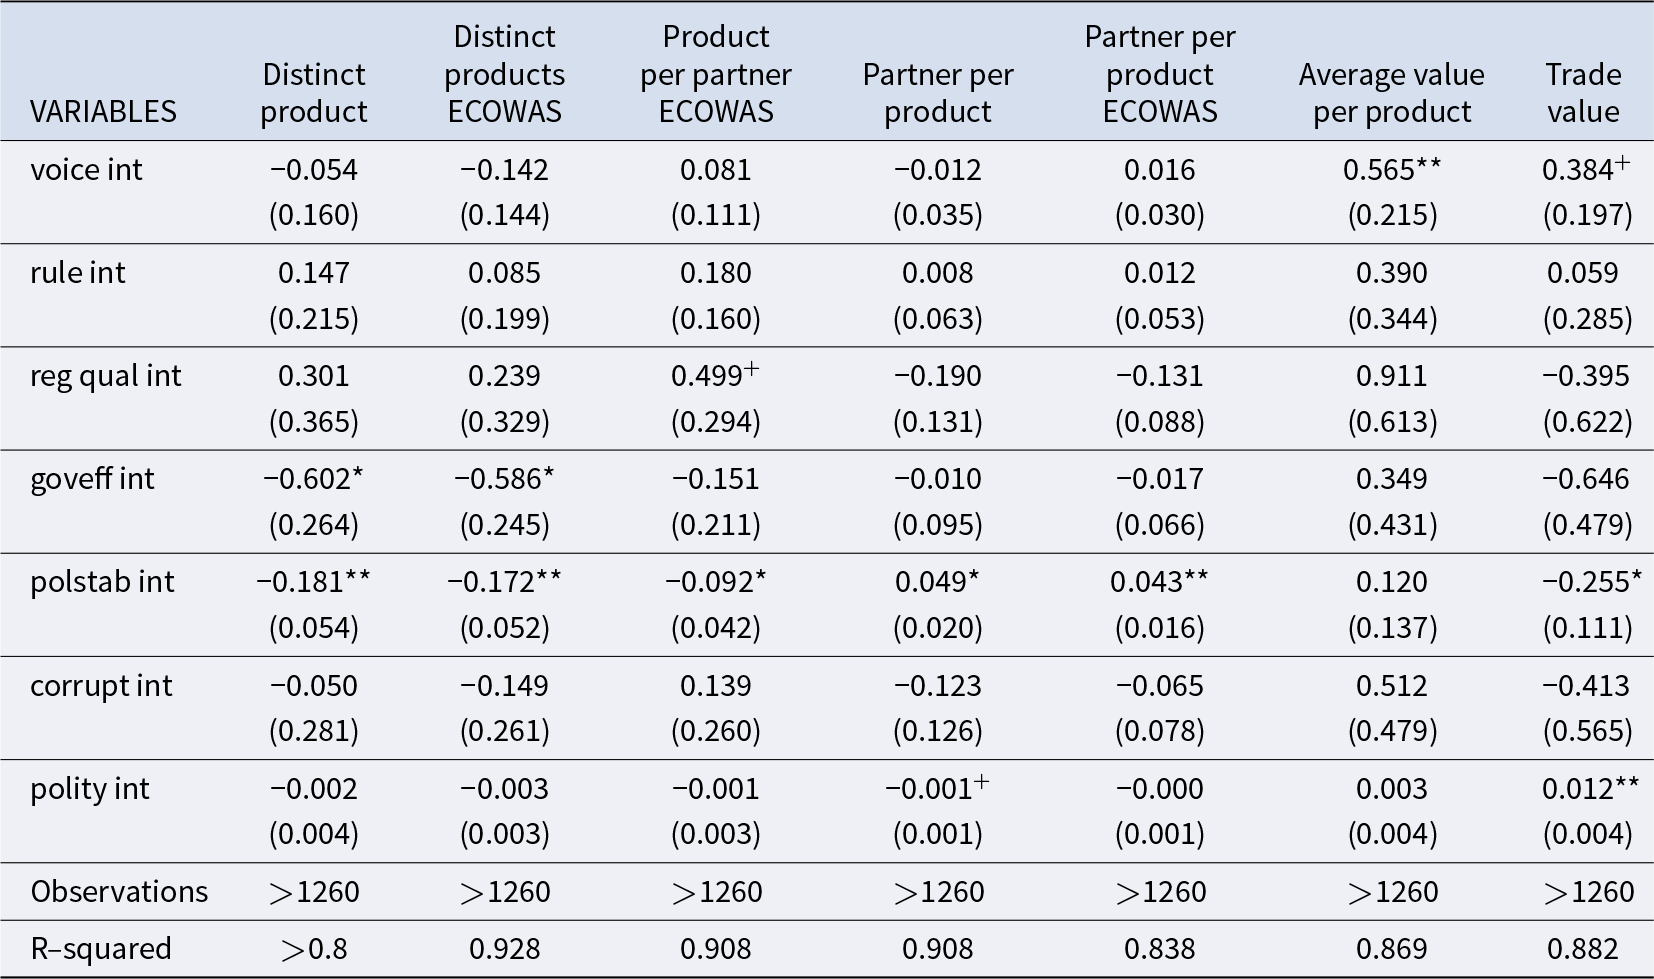
These findings suggest that governance influences trade through different mechanisms at different trade margins. While extensive margins respond more directly to governance conditions in both exporting and importing countries, intensive margins may be shaped by institutional interactions and strategic responses between ECOWAS member states. This is tested in Table 4, where governance interactions between trading partners are explicitly analysed. The larger magnitudes of the governance coefficients relative to those in Table 3 suggest that the interaction of institutional environments across trading partners plays a crucial role in determining trade outcomes.
Interactive governance (complementarities and or reciprocity) determinants of intra-ECOWAS extensive and intensive product margins

Table 4 Long description
Regression results report interaction effects of governance indicators on intra-ECOWAS trade margins: product variety (distinct products), ECOWAS-only variety, products per partner, partners per product (overall and ECOWAS), average value per product, and total trade value. Voice interaction is the clearest positive result for value outcomes, increasing average value per product (0.565, significant at 1 percent) and weakly increasing trade value (0.384, significant at 10 percent), while showing no clear effects on variety measures. Government effectiveness interaction reduces product variety: distinct products (minus 0.602, significant at 5 percent) and distinct products within ECOWAS (minus 0.586, significant at 5 percent), with no statistically clear effects on value measures. Political stability interaction shows mixed effects: it lowers distinct products (minus 0.181, significant at 1 percent), lowers ECOWAS distinct products (minus 0.172, significant at 1 percent), and lowers products per partner in ECOWAS (minus 0.092, significant at 5 percent), but increases partners per product overall (0.049, significant at 5 percent) and within ECOWAS (0.043, significant at 1 percent), and slightly reduces trade value (minus 0.255, significant at 5 percent). Regulatory quality interaction is only weakly positive for products per partner in ECOWAS (0.499, significant at 10 percent); rule of law and corruption interactions are not statistically clear across outcomes. Polity interaction is near zero for most margins but is positive for trade value (0.012, significant at 1 percent). All models use more than 1,260 observations and report high fit (R-squared roughly 0.84 to 0.93), and results should be interpreted as conditional on many additional controls and fixed effects not shown.
Notes: PPML estimation. Variables included in the regression but not reported are exchange rate, distance, contiguity, language, extensive margins covariates, exporting and importing – CPI, tariffs, gross fixed capital formation, population. Exporter time fixed effects, importer time fixed effects, multilateral resistance terms.
Standard errors in parentheses. ** is p < 0.01, * is p < 0.05, + is p < 0.1.
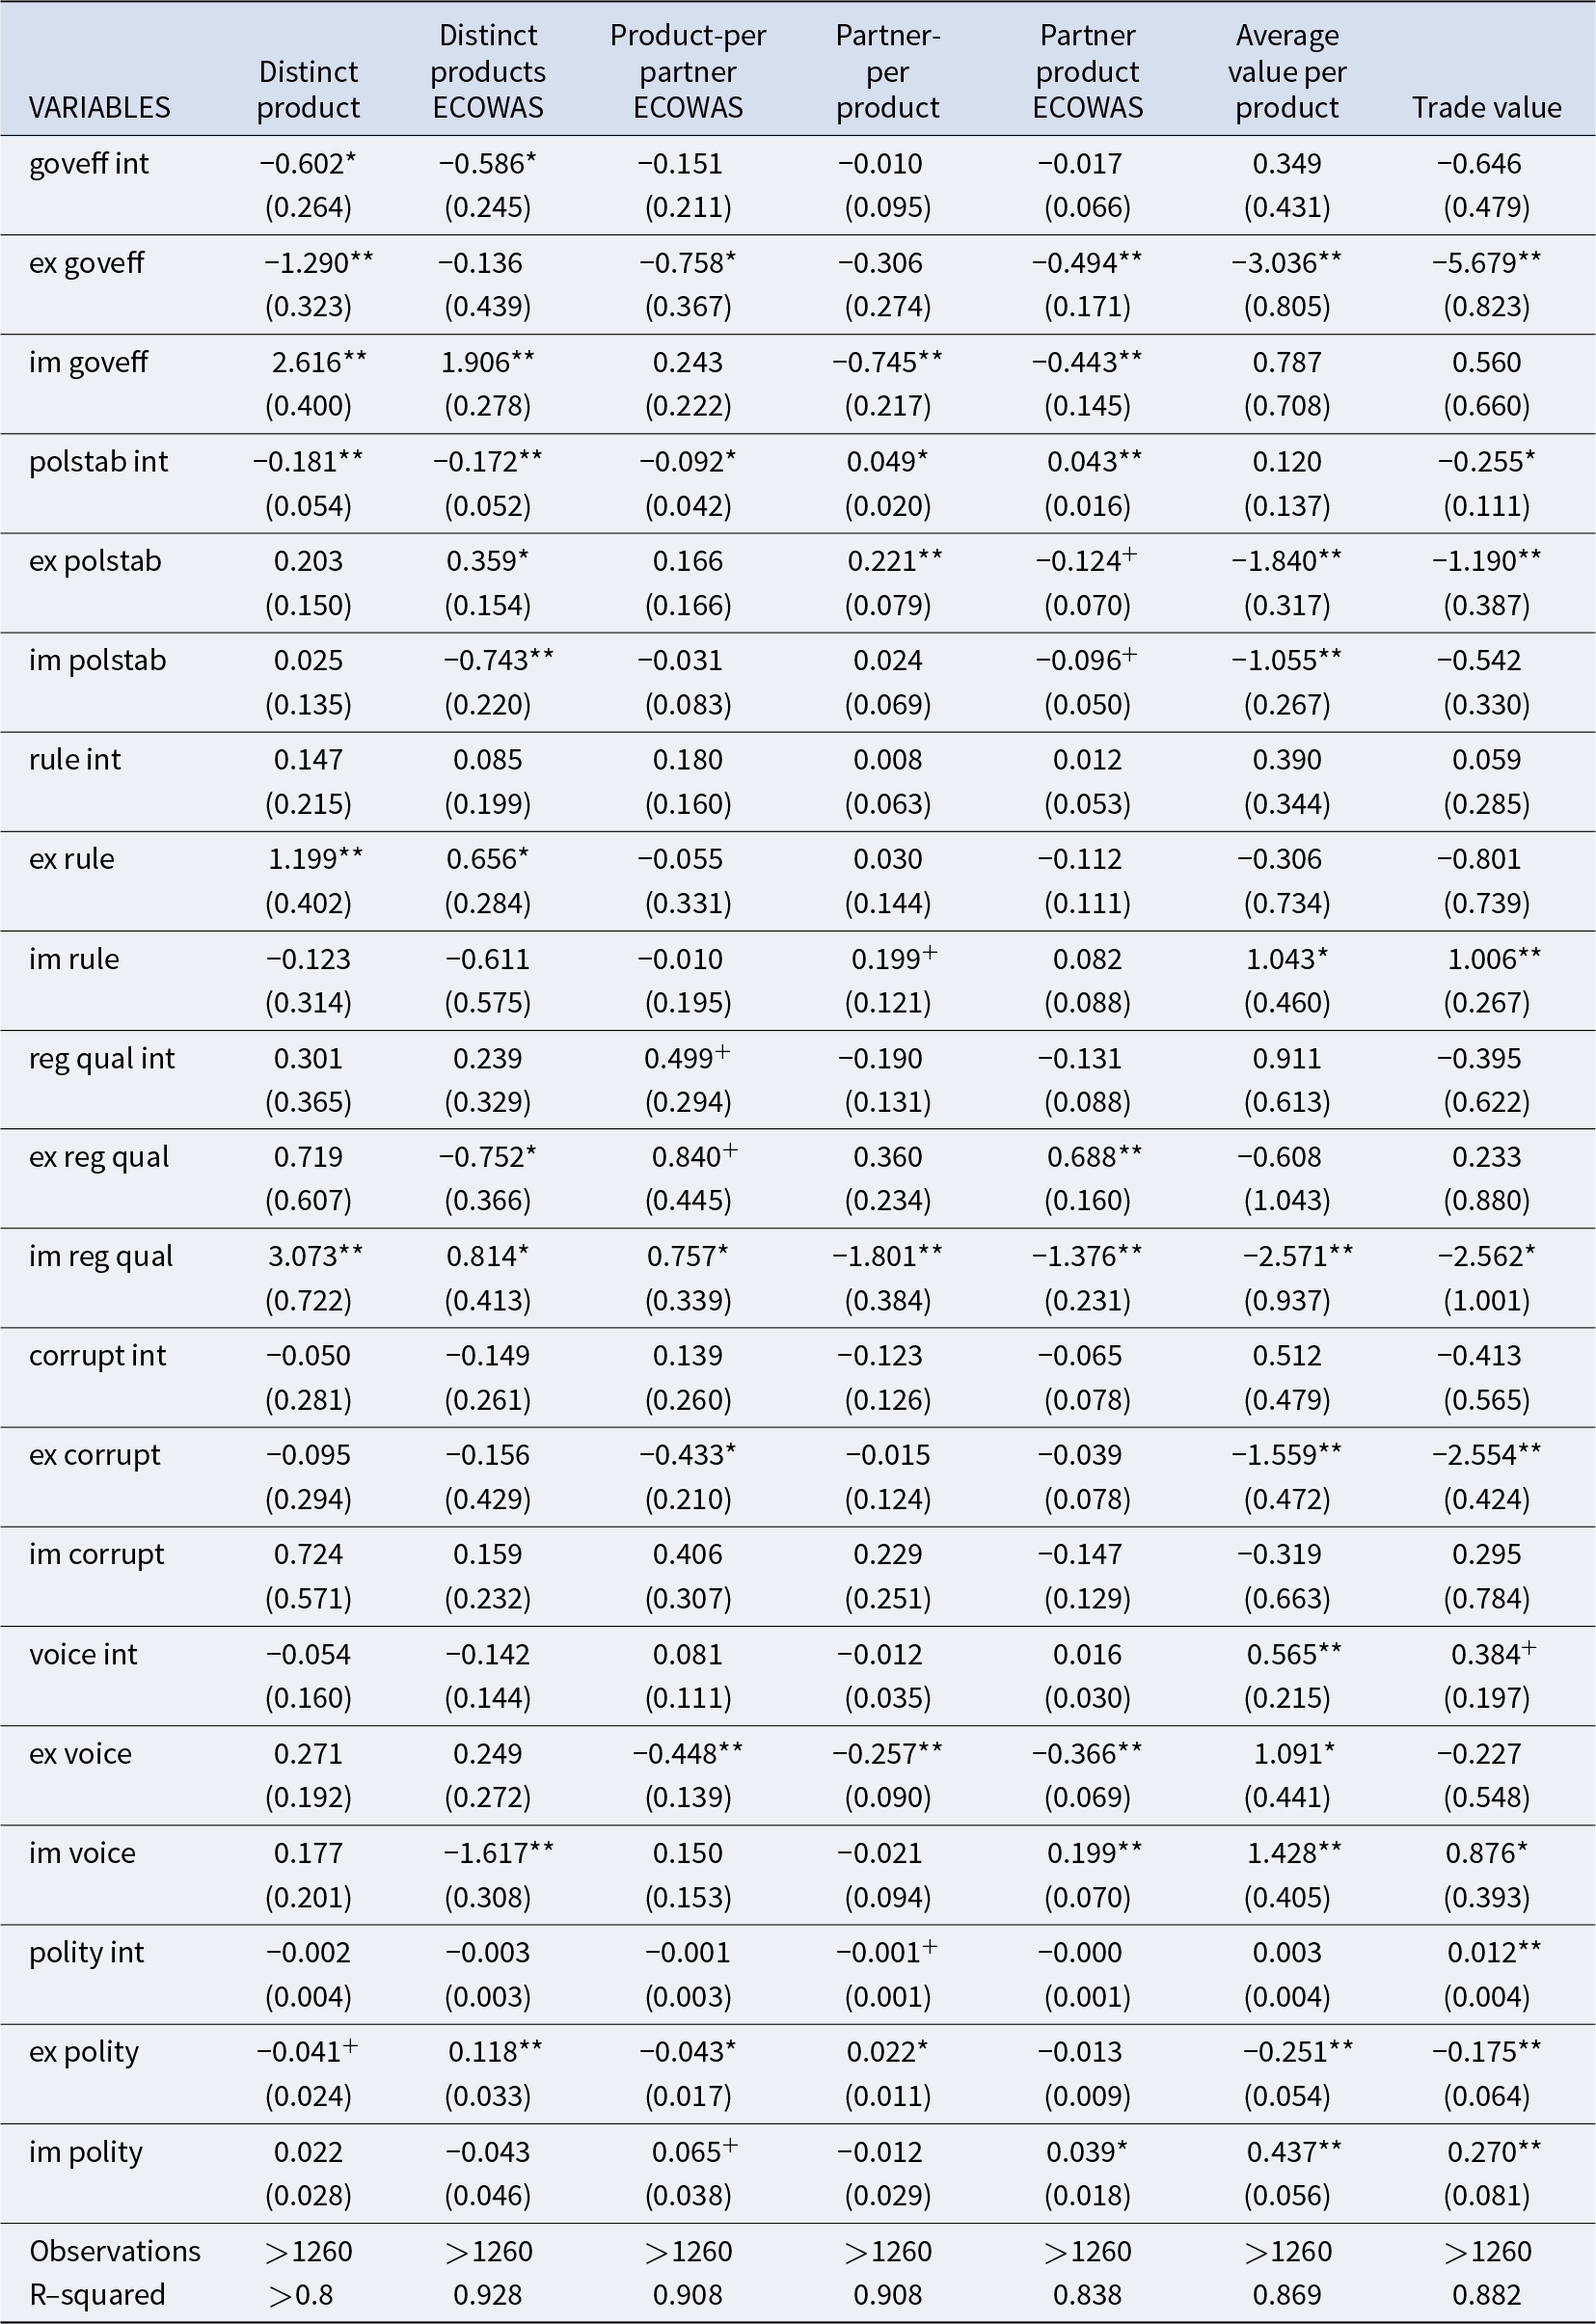
One notable pattern is that when both exporting and importing governance effectiveness are included, the influence of governance on trade variety and partner diversification becomes much stronger. For instance, when governance interactions are introduced, the magnitude of the institutional effects increases substantially relative to the individual governance specifications (see Table A3 in the appendix). This reinforces the idea that governance is not a unilateral driver of trade, but rather a factor that operates through bilateral institutional synergies. The findings also point to the role of governance alignment in shaping trade patterns. Some governance measures, such as voice and accountability and political stability, exhibit stronger negative effects on trade. This suggests that governance asymmetries between trading partners may create friction that inhibits trade expansion. For instance, if you have a country with strong regulatory enforcement trading with a country with weaker institutional controls, they may face challenges in sustaining a long-term trade relationship. It is possible that there are more instances of complementarities than reciprocities in trade.
The analysis in Table 4 builds on the prior findings by explicitly examining how institutional interactions between trading partners shape intra-ECOWAS trade margins. That is, are there complementarities in governance with important implications for intra-ECOWAS trade? For instance, Escandon et al. (Reference Escandon, Salas and Losada-Otalora2023) and Goldstein and Freeman (Reference Goldstein and Freeman1990) demonstrate that cultural and governance reciprocity plays a role in shaping export patterns. Similarly, within ECOWAS, certain governance policies may be mirrored between countries, potentially leading to strategic responses that either facilitate or hinder trade efficiency. The interaction terms point to selective complementarities rather than blanket gains. This is consistent with the idea that trade gains arise when partners’ rules cohere – i.e., there is compatibility between two rule-based environments – whereas mixed pairings see weaker or negative effects (Li and Samsell, Reference Li and Samsell2009). Joint improvements in government effectiveness are associated with significantly lower levels of product variety, as evidenced by the negative coefficients on both distinct products and distinct products within ECOWAS. This suggests that as administrative capacity aligns between trading partners, trade may become increasingly specialized around a narrower set of products rather than expanding into new product categories. By contrast, political stability complementarities reduce variety and depth per partner (negative on Distinct Product and Product per partner), but increase the breadth of partners per product (positive on partner per product), indicating consolidation around a stable core of products traded with more partners.
On the intensive margin, complementarities in voice and accountability are linked to quality upgrading and higher values (positive for average value per product, and weak for trade value), whereas other governance pairings are mostly imprecise. Taken together, ECOWAS trade may respond to institutional complementarities by narrowing the product mix while widening market reach under stability, and by raising unit values where participatory governance aligns, consistent with specialization and upgrading rather than overall expansion. Again, the mechanism sits comfortably with institutional-cost arguments in gravity, which suggests alignment reduces uncertainty and specific transaction costs, but the implied specialization can narrow product scope (De Groot et al., Reference De Groot, Linders, Rietveld and Subramanian2004).
To ensure complementarities are effectively isolated, it is important to incorporate the individual exporter and importer governance and institutions measures, while incorporating the interactions terms. This also helps to distinguish between tit-for-tat emanating from reciprocities, and quid-pro-quo effects emanating from complementarities.Footnote 2 The interaction terms indicate selective complementarities. Joint government effectiveness is associated with less product variety, consistent with specialization as administrative capacity aligns. Comparable patterns appear when regional institutions evolve asymmetrically, creating frictions that shift networks rather than expanding them (Gomez-Mera and Molinari, Reference Gomez-Mera and Molinari2014; Krapohl and Fink, Reference Krapohl and Fink2013). Political stability interactions reduce variety and products per partner but increase partners per product, implying a narrower mix traded with more partners.
For trade value, voice and accountability complementarities are associated with higher unit values and stronger trade relationships. The interaction term is positive and statistically significant for average value per product and weakly significant for overall trade value, making it one of the strongest positive complementarities identified in the analysis. Individually, exporter governance effectiveness lowers variety, while importer governance effectiveness reduces partner-per-product and trade value. Regulatory-quality complementarities raise products per partner; on the import side, higher regulatory quality is linked to fewer partners per product and lower trade value, suggesting binding import side compliance. Such import-side stringency fits the exporter–importer asymmetry highlighted by legal institutions work, where enforcement loci and compliance obligations do not need to be symmetric (Berkowitz et al., Reference Berkowitz, Moenius and Pistor2004). For corruption, interaction effects are imprecise; import-side corruption lowers distinct products (ECOWAS measure) but its effect on trade value is not significant. Finally, polity shows a small positive interaction effect on trade value, whereas import-side polity significantly reduces both distinct products and trade value, pointing to policy shifts that may constrain extensive margins. This echoes the margin-specific findings that political institutions tend to shape entry and variety more than they do value, with effects concentrated in products sensitive to monitoring and contact (Kim et al., Reference Kim, Londregan and Ratkovic2019).
7. Conclusion
In this study, we set out to examine multiple components of trade within ECOWAS, including extensive margins, product-level intensive margins, and the industry composition and concentration characteristics of trade in the region. We then explored how governance interactions – termed complementarities between the institutional quality of ECOWAS trade partners – influence these trade dynamics. The analysis employed bilateral product-level trade data from CEPII, covering the period 1995–2022 for all 15 ECOWAS member states, and estimated the gravity model using the PPML estimation method.
The findings reveal marked differences across the various dimensions of trade. They highlight the importance of examining extensive trade margins alongside the more commonly studied intensive margins, as each provides distinct insights into the nature of intra-ECOWAS trade. No single governance dimension exhibits uniformly positive effects across all specifications. However, regulatory quality and political institutions display some of the most consistently favourable associations with intra-ECOWAS trade margins, while the effects of voice and accountability, government effectiveness, and political stability vary considerably across trade dimensions. However, for ECOWAS countries aiming to enhance their product networks and diversify export destinations, exporting country regulatory quality is important.
Lastly, the core contribution of this study lies in its examination of governance complementarities or the interactive effects of governance quality between ECOWAS trade partners on trade outcomes. The results from the interaction terms suggest that different governance dimensions play distinct roles across trade margins. Regulatory quality complementarities appear relevant for driving product concentration within ECOWAS, particularly in terms of the number of products per partner and the structure of trade relationships. Voice and accountability appear to have a complementarity effect specifically on the average value per product per partner, suggesting its role in deepening bilateral trade relationships. These results highlight the unique role that regulatory convergence can play in supporting deeper trade within ECOWAS, while regional political stability remains important for deepening the geographical reach of existing products. This distinction is particularly relevant in light of the current tensions between ECOWAS and Sahel-region countries, as institutional misalignments could risk undermining integration gains.
There are a number of policy implications that follow from this paper. Beyond aggregate volumes, ECOWAS should prioritize product-level trade margins to neutralize the ‘behemoth’ effect of large members and surface actionable levers. Our results point to governance channels, rather than broad institutional scores, as the key determinants of margins; policy should therefore diagnose and target the mechanisms shaping the extensive margin (variety, entry) versus the intensive margin (unit values, depth). Regional integration should foster complementarities in government effectiveness (co-ordinated customs, mutual recognition, interoperable digital permits) while monitoring for negative reciprocity that can shrink product variety. Because many flows move through informal corridors, effectiveness gains in one country can unintentionally suppress beneficial informal trade; sequencing should pair formalization (simplified regimes for small consignments, risk-based controls) with transitional safeguards and corridor pilots. A simple ‘margin dashboard’ and ex-ante impact tests can help ensure reforms remain complementary, not punitive, across the bloc.
Data availability statement
We have uploaded the data to the World Trade Review Dataverse (hosted on Harvard Dataverse). Reference: Fadiran, D. (2026) ‘Institutions, Governance & Intra-regional Trade Margins: Complementarities or Reciprocity in ECOWAS?’ [Dataset], World Trade Review Dataverse, Harvard Dataverse, Draft Version, https://doi.org/10.7910/DVN/IG1QUI.
Appendix
Baseline gravity model in ECOWAS

Table A1 Long description
Regression results for bilateral trade in ECOWAS are reported across four specifications: two ordinary least squares models, an ordinary least squares model with fixed effects, and a Poisson pseudo-maximum-likelihood model with fixed effects. Distance has a negative coefficient in every model, ranging from about minus 1.17 in the first two models to minus 0.32 in the PPML fixed-effects model, and is statistically significant throughout. Contiguity has a positive and statistically significant association in all models, with coefficients around 0.88 to 1.12. Common language is positive in all models and becomes statistically significant in the fixed-effects and PPML fixed-effects specifications, reaching about 0.82 in the PPML fixed-effects model. Colonial ties are positive but not statistically significant in the first three models, then turn negative and statistically significant in the PPML fixed-effects model at about minus 0.55. Income and expenditure variables appear only in the first two models and are positive and statistically significant, while remote exporter is positive and significant and remote importer is negative but not significant in the second model. Sample size is 3,003 observations for the first two models and 4,248 for the fixed-effects models, with reported fit measures rising from about 0.54 in the first two models to about 0.75 in the fixed-effects models; coefficient sizes and significance should be compared cautiously because model types and included controls differ.
Intra-ECOWAS trade, and traditional determinants of trade

Table A2 Long description
Regression results for intra-ECOWAS bilateral trade are reported across four specifications: OLS, OLS remote, OLS with fixed effects, and PPML. Distance is negative and statistically significant in every model, with the largest magnitude in OLS and the smallest in PPML, indicating trade falls as partners are farther apart. Sharing a border is positive and significant in all models, suggesting neighboring countries trade more. A common language is positive and significant in the three OLS-based models but becomes small and not statistically significant in PPML. Exporter population is strongly negative in the first two OLS models, becomes near zero with fixed effects, and turns strongly positive and significant in PPML; importer population is positive and becomes significant in PPML. Exporter consumer prices are negative and significant in the first two OLS models but not significant with fixed effects or PPML, while importer consumer prices are mixed and only positive and significant in PPML. Tariff effects differ by specification: exporter and importer tariffs are negative and statistically significant in the fixed-effects and PPML models, but not in the first two OLS models. Model fit and sample size vary slightly, with about 1,492 to 1,546 observations and higher reported fit in the fixed-effects and PPML specifications, so coefficient patterns should be compared with attention to the estimator used.
Note: Standard errors in parentheses. ** is p < 0.01, * is p < 0.05, + is p < 0.1.
Domestic and foreign governance determinants of intra-ECOWAS extensive and intensive product margins

Table A3 Long description
Regression results link exporter and importer governance indicators to six trade-margin outcomes: distinct products, ECOWAS-only distinct products, products per ECOWAS partner, partners per product (overall and ECOWAS), and average value per product. Exporter rule of law shows large positive associations with product variety and partner counts, including distinct products and partners per product, but a negative association with products per ECOWAS partner and with average value per product. Importer regulatory quality and importer government effectiveness are strongly positive for distinct products (including ECOWAS-only), yet both are negative for partners per product and for average value per product, with importer government effectiveness showing one of the largest drops in partners per product. Exporter voice is positive for ECOWAS distinct products but negative for partner measures, while importer voice is negative for product variety and products per ECOWAS partner. Corruption measures are linked to lower ECOWAS distinct products and sharply lower average value per product, especially for importer corruption; exporter corruption is also associated with lower average value but higher ECOWAS partners per product. Political stability effects are mixed: exporter stability is positive for ECOWAS distinct products and partners per product and slightly positive for average value, whereas importer stability is negative for partners per product and strongly negative for average value. All models use the same sample size of 1,495 observations and report high model fit; coefficients should be read as conditional associations with statistical significance indicated by stars and plus signs.
Notes: PPML estimation. Variables included in the regression but not reported are exchange rate, distance, contiguity, language, extensive margins covariates, exporting and importing – CPI, tariffs, gross fixed capital formation, population. Exporter time fixed effects, importer time fixed effects, multilateral resistance terms. Institutional variables added individually.
Standard errors in parentheses. ** is p < 0.01, * is p < 0.05, + is p < 0.1.
Governance and institutions complementarities and reciprocities on trade dynamics

Table A4 Long description
Regression coefficients with standard errors in parentheses link governance and institutional indicators to seven trade outcomes: product variety, ECOWAS-specific variety, products per partner, partners per product, partner-product links in ECOWAS, average value per product, and total trade value. Governance effectiveness is negative for export outcomes, including large declines in average value per product and overall trade value, while import governance effectiveness is positive for distinct products and ECOWAS distinct products but negative for partners per product and ECOWAS partner-product links. Political stability is generally negative for product variety and trade value in the interaction term, but export political stability increases partners per product while reducing average value per product and trade value. Rule of law shows positive export effects on distinct products and ECOWAS distinct products, while import rule of law increases average value per product and trade value. Regulatory quality on the import side strongly increases distinct products but is associated with fewer partners per product and fewer ECOWAS partner-product links, and it reduces average value per product and trade value. Corruption measures show limited effects overall, though export corruption is linked to lower products per partner and lower average value per product and trade value. Voice and accountability has mixed patterns: export voice reduces products per partner and partner link measures but raises average value per product, while import voice reduces ECOWAS distinct products yet increases ECOWAS partner-product links, average value per product, and trade value. Polity effects are small in magnitude, with export polity tending to reduce value measures and import polity tending to raise them. Model fit is high across outcomes, with more than 1,260 observations for each regression and R-squared values mostly above 0.8; statistical significance varies by coefficient, so non-starred estimates should be treated as uncertain.

 Open access

