


%20--%3e%3c!DOCTYPE%20svg%20PUBLIC%20'-//W3C//DTD%20SVG%201.0//EN'%20'http://www.w3.org/TR/2001/REC-SVG-20010904/DTD/svg10.dtd'%3e%3csvg%20version='1.0'%20id='Layer_1'%20xmlns='http://www.w3.org/2000/svg'%20xmlns:xlink='http://www.w3.org/1999/xlink'%20x='0px'%20y='0px'%20width='64px'%20height='64px'%20viewBox='5.5%20-3.5%2064%2064'%20enable-background='new%205.5%20-3.5%2064%2064'%20xml:space='preserve'%3e%3cg%3e%3ccircle%20fill='%23FFFFFF'%20fill-opacity='0'%20cx='37.785'%20cy='28.501'%20r='28.836'/%3e%3cpath%20fill='%23595959'%20d='M37.441-3.5c8.951,0,16.572,3.125,22.857,9.372c3.008,3.009,5.295,6.448,6.857,10.314%20c1.561,3.867,2.344,7.971,2.344,12.314c0,4.381-0.773,8.486-2.314,12.313c-1.543,3.828-3.82,7.21-6.828,10.143%20c-3.123,3.085-6.666,5.448-10.629,7.086c-3.961,1.638-8.057,2.457-12.285,2.457s-8.276-0.808-12.143-2.429%20c-3.866-1.618-7.333-3.961-10.4-7.027c-3.067-3.066-5.4-6.524-7-10.372S5.5,32.767,5.5,28.5c0-4.229,0.809-8.295,2.428-12.2%20c1.619-3.905,3.972-7.4,7.057-10.486C21.08-0.394,28.565-3.5,37.441-3.5z%20M37.557,2.272c-7.314,0-13.467,2.553-18.458,7.657%20c-2.515,2.553-4.448,5.419-5.8,8.6c-1.354,3.181-2.029,6.505-2.029,9.972c0,3.429,0.675,6.734,2.029,9.913%20c1.353,3.183,3.285,6.021,5.8,8.516c2.514,2.496,5.351,4.399,8.515,5.715c3.161,1.314,6.476,1.971,9.943,1.971%20c3.428,0,6.75-0.665,9.973-1.999c3.219-1.335,6.121-3.257,8.713-5.771c4.99-4.876,7.484-10.99,7.484-18.344%20c0-3.543-0.648-6.895-1.943-10.057c-1.293-3.162-3.18-5.98-5.654-8.458C50.984,4.844,44.795,2.272,37.557,2.272z%20M37.156,23.187%20l-4.287,2.229c-0.458-0.951-1.019-1.619-1.685-2c-0.667-0.38-1.286-0.571-1.858-0.571c-2.856,0-4.286,1.885-4.286,5.657%20c0,1.714,0.362,3.084,1.085,4.113c0.724,1.029,1.791,1.544,3.201,1.544c1.867,0,3.181-0.915,3.944-2.743l3.942,2%20c-0.838,1.563-2,2.791-3.486,3.686c-1.484,0.896-3.123,1.343-4.914,1.343c-2.857,0-5.163-0.875-6.915-2.629%20c-1.752-1.752-2.628-4.19-2.628-7.313c0-3.048,0.886-5.466,2.657-7.257c1.771-1.79,4.009-2.686,6.715-2.686%20C32.604,18.558,35.441,20.101,37.156,23.187z%20M55.613,23.187l-4.229,2.229c-0.457-0.951-1.02-1.619-1.686-2%20c-0.668-0.38-1.307-0.571-1.914-0.571c-2.857,0-4.287,1.885-4.287,5.657c0,1.714,0.363,3.084,1.086,4.113%20c0.723,1.029,1.789,1.544,3.201,1.544c1.865,0,3.18-0.915,3.941-2.743l4,2c-0.875,1.563-2.057,2.791-3.541,3.686%20c-1.486,0.896-3.105,1.343-4.857,1.343c-2.896,0-5.209-0.875-6.941-2.629c-1.736-1.752-2.602-4.19-2.602-7.313%20c0-3.048,0.885-5.466,2.658-7.257c1.77-1.79,4.008-2.686,6.713-2.686C51.117,18.558,53.938,20.101,55.613,23.187z'/%3e%3c/g%3e%3c/svg%3e)
%20--%3e%3c!DOCTYPE%20svg%20PUBLIC%20'-//W3C//DTD%20SVG%201.0//EN'%20'http://www.w3.org/TR/2001/REC-SVG-20010904/DTD/svg10.dtd'%3e%3csvg%20version='1.0'%20id='Layer_1'%20xmlns='http://www.w3.org/2000/svg'%20xmlns:xlink='http://www.w3.org/1999/xlink'%20x='0px'%20y='0px'%20width='64px'%20height='64px'%20viewBox='5.5%20-3.5%2064%2064'%20enable-background='new%205.5%20-3.5%2064%2064'%20xml:space='preserve'%3e%3cg%3e%3ccircle%20fill='%23FFFFFF'%20fill-opacity='0'%20cx='37.637'%20cy='28.806'%20r='28.276'/%3e%3cg%3e%3cpath%20fill='%23595959'%20d='M37.443-3.5c8.988,0,16.57,3.085,22.742,9.257C66.393,11.967,69.5,19.548,69.5,28.5c0,8.991-3.049,16.476-9.145,22.456%20C53.879,57.319,46.242,60.5,37.443,60.5c-8.649,0-16.153-3.144-22.514-9.43C8.644,44.784,5.5,37.262,5.5,28.5%20c0-8.761,3.144-16.342,9.429-22.742C21.101-0.415,28.604-3.5,37.443-3.5z%20M37.557,2.272c-7.276,0-13.428,2.553-18.457,7.657%20c-5.22,5.334-7.829,11.525-7.829,18.572c0,7.086,2.59,13.22,7.77,18.398c5.181,5.182,11.352,7.771,18.514,7.771%20c7.123,0,13.334-2.607,18.629-7.828c5.029-4.838,7.543-10.952,7.543-18.343c0-7.276-2.553-13.465-7.656-18.571%20C50.967,4.824,44.795,2.272,37.557,2.272z%20M46.129,20.557v13.085h-3.656v15.542h-9.944V33.643h-3.656V20.557%20c0-0.572,0.2-1.057,0.599-1.457c0.401-0.399,0.887-0.6,1.457-0.6h13.144c0.533,0,1.01,0.2,1.428,0.6%20C45.918,19.5,46.129,19.986,46.129,20.557z%20M33.042,12.329c0-3.008,1.485-4.514,4.458-4.514s4.457,1.504,4.457,4.514%20c0,2.971-1.486,4.457-4.457,4.457S33.042,15.3,33.042,12.329z'/%3e%3c/g%3e%3c/g%3e%3c/svg%3e)
Introduction
Global mortality attributed to measles has been on the decline in recent decades [Reference Dabbagh1], significantly contributing to the overall decrease in childhood mortality [Reference Van den Ent2]. Most countries achieved the 2010 global goal of reducing measles mortality by 90% and evidence of measurable progress by 2015 target [Reference Strebel3] has recently generated optimism that global eradication is feasible by 2020. Accelerated measles control activities, financial and technical support by high-burden countries have made possible much of the recent progress. In spite of such progress and availability of vaccines, periodic outbreaks of measles continue to appear in many parts of the world including under-vaccinated populations [Reference Spika4] and developed countries [5, Reference Zarb6]. Measles remains a killer of children around the world [Reference Orenstein and Hinman7, Reference Poland and Jacobson8]. Crucial gaps in available data, inadequate surveillance and vital record registrations thwart both the guidance to prevention programmes and eradication of measles [Reference Simons, Ferrari and Fricks9]. The short-term horizon of 2020 and re-emergence of measles even in traditionally low-burden countries appear to dampen the recent optimism about the disease eradication.
Nowhere is the burden of measles being more felt than in fragile health systems and conflict zones [Reference Kouadio, Kamigaki and Oshitani10]. Somalia has been facing severe development challenges due to political instability and the unending cycle of violence. Conflict and fragility are considered a challenge to sustainable development and 2 billion people live in countries where development outcomes are affected by these conditions [11]. Somalia has remained a fragile state for close to three decades and was ranked the second most fragile state with a score of 114 out of possible 120 [12]. The country remains a fragile state vulnerable to infectious disease outbreaks [Reference Bruckner and Checchi13]. In 2012, Somalia was one of the only three countries in the world where immunisation coverage with measles was under 50% and among the few countries still using selected sentinel sites and lacking nationwide surveillance [14].
The motivation for this study is that while combined efforts by the Federal Government of Somalia and the World Health Organisation (WHO) have sought to combat measles in recent years, reported cases increased manyfold. In 2017 alone, there were nearly 20 000 reported cases, four times as many incidences as 2015 and 2016 [15]. Additionally, the motivation for this study comes from the absence of evidence on the extent of economic loss associated with measles-related deaths, especially in conflict and fragile zones. This study set out to provide evidence by estimating the indirect cost associated with measles-related deaths among children aged 0–14 years in Somalia. Specifically, the paper considers the pertinent questions: What is the economic burden or indirect cost associated with measles-related deaths among children aged 0–14 years in Somalia? How do uncertainties about epidemiologic, economic and conflict and fragility conditions affect the magnitude and robustness of the indirect cost associated with measles-related deaths? Estimating the indirect cost of measles in a poor, fragile and conflict-prone country with a weak health care system is important in informing evidence-based interventions, policy and practice that may help reduce mortality.
The rest of the paper is organised as follows: next, the paper presents the methodology in terms of conceptual framework, model specification, computation, discounting and sensitivity analysis. Then, the paper reports baselines and extended results along with sensitivity and robustness checks. Finally, the paper presents the discussion of the results and conclusion.
Methods
Conceptual framework
The method involves the estimation of indirect cost associated with measles-related deaths among children aged 0–14 years in Somalia. The paper used a macroeconomic model of cost-of-illness (COI) within the framework of recommendations of reporting economic evaluations according to the WHO guideline for identifying the economic consequences of disease and injury [16]. This paper computed undiscounted productive years of life lost (UDPYLL), discounted productive years of life lost (DPYLL) and conflict and growth-adjusted non-health gross domestic product per capita (aNHGDPPC) associated with measles-related deaths. This information was then used to estimate the present value of the non-health gross domestic product loss (NHGDPLoss) associated with measles-related deaths among children aged 01–14 years. Previous studies have used similar approaches to estimate the impact of deaths associated with a disease on non-health components of the future gross domestic product (GDP) [14]. The impact of deaths associated with disease on the non-health components of GDP is the ‘quantity of interest’ when estimating the indirect cost [16–Reference Kirigia18]. The use of health services or goods does not generate utility or welfare per se [Reference Grossman19]. GDP, which is the total value of all marketed final goods and services produced in an economy during a year, is regarded as one of the measures of the market production forgone due to disease death. While medical care and health expenditures actually form part of GDP [Reference Kirigia18, Reference Kirigia20], a more appropriate quantity of interest would be the impact of disease or injury on the non-health components of GDP [Reference Chisholm17].
Total non-health macroeconomic loss of measles model and specification
This paper follows the general framework of previous studies [16, Reference Kirigia18–Reference Kirigia20] in measuring the indirect cost by computing the present value of NHGDPLoss due to disease death. In particular, this paper follows the approach of allowing a finite and stable upper limit growth component to NHGDPPC by assuming that NHGDPPC cannot exceed GDP per capita (GDPPC) in any given year in the future [Reference Da'ar21]. However, while providing a specific context of disease burden in a conflict and fragile health system, the present study augments previous approaches by adjusting the NHGDPPC for conflict and fragility conditions. Conflict and fragility conditions affect the macroeconomic fundamentals of health systems [Reference Martin and Evans22].
The NHGDPLoss associated with measles-related deaths among children aged 0–14 years is the product of the total number of DPYLL above the minimum employment age lost, the NHGDPPC and the estimated total number of deaths associated with measles in that age group (ETMD0–14). ETMD0–14 is calculated from the proportion of total measles deaths of children aged 0–14 years (PTMD0–14) out of the total measles deaths reported of the population aged <65 years.
The number of productive years of life lost (PYLL) for children aged 0–14 years was calculated by subtracting the sum of the average age at death (AAD0–14) and years remaining to attain the minimum age of employment i.e. the average years lost at the death of a child before attaining the age of employment (YEL) from life expectancy (LE) at birth. In 2015, LE at birth in Somalia was 56.6 years for females and 53.5 for males according to health data we gleaned from WHO updates, World Bank and United Nations for Population [23]; or for simplicity, 57 and 54 years were used. AAD0–14 is the simple average age at death for age group 0–14, which equals to 0 plus 14 years divided by 2 (0 + 14/2) = 7. A simple average was used since available evidence of measles deaths did not indicate the distribution by age. The legal minimum age of employment is 15 years according to Article II of the International Labour Organisation (ILO) convention [24]. From AAD0–14, YEL is 15 − 7 = 8. Thus, the number of future PYLL equals LE minus 15 years. In 2015, the PYLL for female children aged 0–14 years in Somalia was 42 years, i.e. LE of 57 years minus the sum of AAD (7 years) and YEL (8 years). Similarly, the PYLL for male children aged 0–14 years was 39 years:


where PYLL, LE, AAD and YEL are defined in the preceding section. The present value of NHGDPLoss to the country due to measles-related deaths among children aged 0–14 years is given by

where pvN0−14is the present value of total non-health GDP loss due to measles deaths among children aged 0–14 years, disaggregated by gender according to equations (3) and (4):

and

where
• NHGDPLoss0–14 is the net present value of conflict- and growth-adjusted total non-health GDP loss due to measles-related deaths among children aged 0–14 years;
• G is the GDP per capita;
• H is the health expenditure per capita;
• D is the estimated total measles deaths (ETMD) that occur among children aged 0–14 years;
• G-H is the non-health GDP per capita;
• α is a growth adjustment parameter depicting the proportion of non-health GDP per capita to GDP per capita;
• $\alpha = \displaystyle{{G_T-H_t} \over {G_T-H_{t-1}}};\;{\rm and \; 0} \lt; \alpha \lt; 1$
 , by assumption;
• $\beta$
Z is a conflict and fragility-adjustment parameter;• $\beta = {\rm CF}{\rm I}_{{\rm SOM}}/{\rm CF}{\rm I}_{{\rm MAX}} \; {\rm and \; 0} \lt \beta \lt 1$
, by assumption;• $1/(1 + r)^t$
Zis the discount factor;• $\sum\nolimits_{t = 1}^T {}$
Zdepicts the summation from year t to T; t represents the first year of life lost to measles and T is the terminal year, i.e. the final year of all future PYLL per measles death as defined earlier.





Discounting
The present value of the NHGDPLoss due to measles-related deaths is the sum of NHGDPLossF(0–14) and NHGDPLossM(0–14). The NHGDPLoss for each group was estimated by multiplying the total number of DPYLL (which is equivalent to the sum of the discount factors) by the aNHGDPPC and the ETMD(0–14) in that age group. Future costs diminish the more distant in the future they occur, hence society generally value them less than the present costs. This underscores the premise of discounting, which necessitates the need to adjust for the time value of losses occurring in different periods. Discounting future health outcomes have been addressed in previous studies [Reference Chapman and Elstein25, Reference Torgerson and Raftery26]. Discounting future costs and benefits is performed because of time preference, which refers to the desire to realise benefits in the present while deferring any negative effects of doing so [Reference Torgerson and Raftery26]. Failure to discount effects even when costs are counted for can lead to inconsistent or misleading results [Reference Weinstein and Stason27]. Failing to discount future costs also has the effect of dampening the present benefits of reducing burden, potentially slowing interventions to be more cost-effective than they would otherwise seem.
Sensitivity analysis
This paper then conducted a sensitivity analysis to assess the impact of a range of values of a set of epidemiologic and economic factors on the indirect cost associated with measles-related deaths. These factors include the proportion of aNHGDPPC to GDPPC, discount rate, PTDM and conflict and fragility conditions. The existence of a range of values of these factors necessitated the accounting for uncertainty [Reference Levin and McEwan28, Reference McEwan29], a methodology emphasised in health economic models [Reference Cartwright30, Reference Taylor31].
Results
Baseline results
The 42 and 39 (female and male respectively) UDPYLL among children aged between 0 and 14 years, yielded 23.7 and 22.8 DPYLL after applying a 3% discount rate. This section presents the baseline results without the assumption of instability. The unadjusted non-health GDP per capita (uNHGDPPC) in 2015 was $271, which is the GDPPC of $426 less the per capita total health expenditure (PCTHE) of $155. In 2015, the ETMD of the population aged less than 65 years was 8617. The PTMD0–14 was 43.2%, translating to ETMD0–14 of 3723 (0.432 × 8617). Of these deaths, 50.2% were female translating to 1868 females and 1854 males. At a 3% discount rate, the estimated DPYLL was 23.7 for female and 22.8 for male, respectively. Thus, the baseline present value of NHGDPLossF(0–14) due to measles-related deaths among female children aged 0–14 years is approximately $12 002 898, which is obtained by multiplying 23.7, the DPYLL, by $271, the uNHGDPPC and 1868, the ETMDF(0–14). On the other hand, the net present value of NHGDPLossM(0–14) due to measles-related deaths among male children of the same age would be $11 458 553, which is approximately obtained by multiplying 22.8, the DPYLL, by $271, the uNHGDPPC and 1854, the ETMDM(0–14). Together, the baseline results in 2015 values reveal measles deaths among children aged 0–14 years could decrease NHGDP of the country by $23.46 million, representing a potential loss of $6303 per death. Table 1 illustrates the parameterisation of the model used to compute the indirect cost of measles, while Appendix Table A1 reveals the variables and sources of data.
Computation of measles-related total non-health GDP loss in Somalia

Results with growth-and instability assumptions
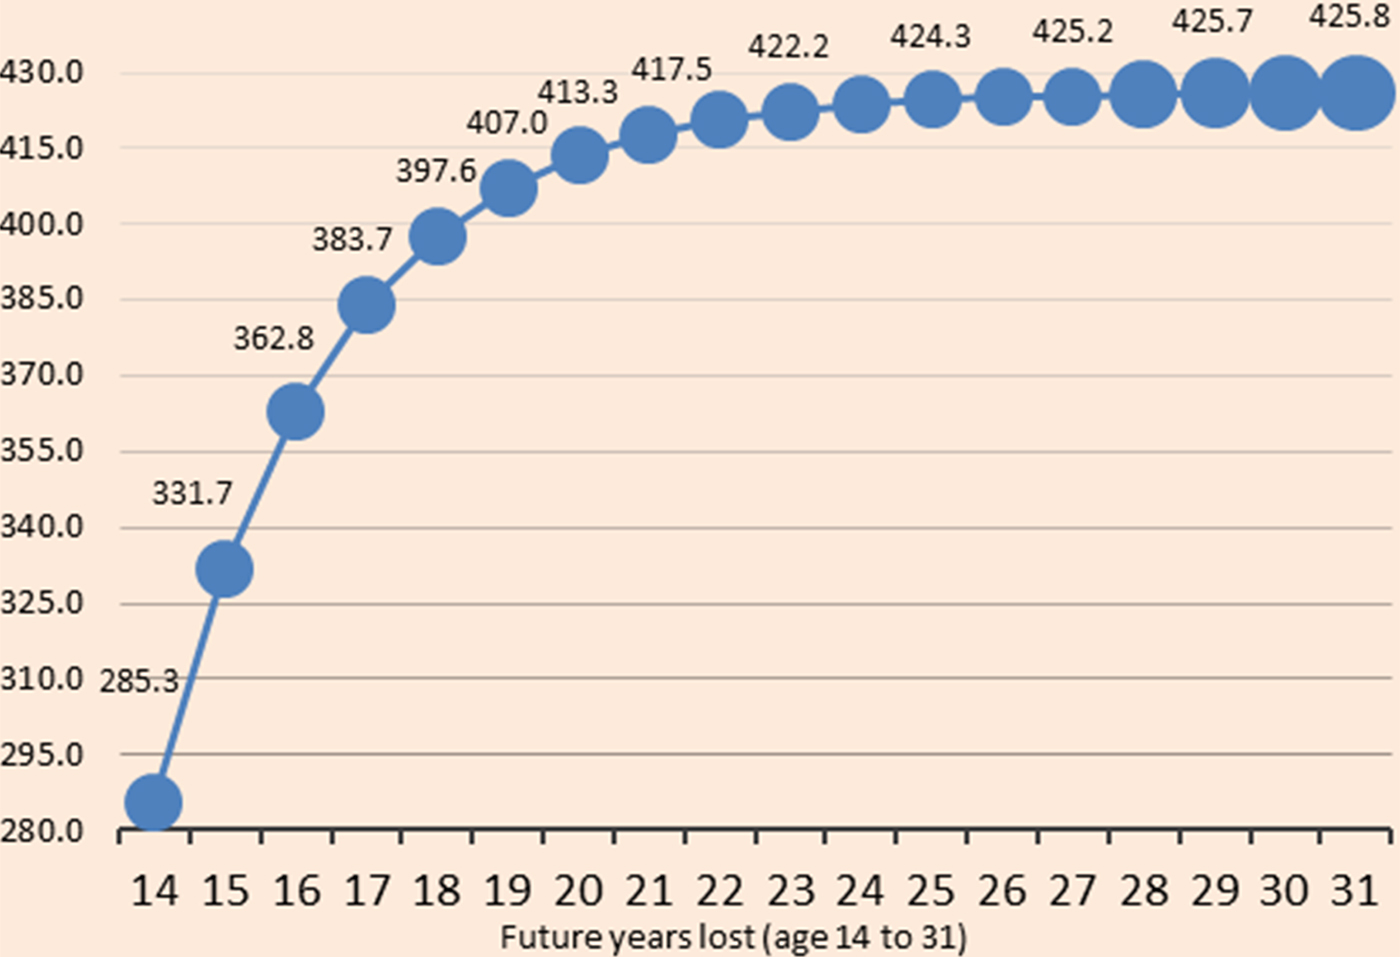
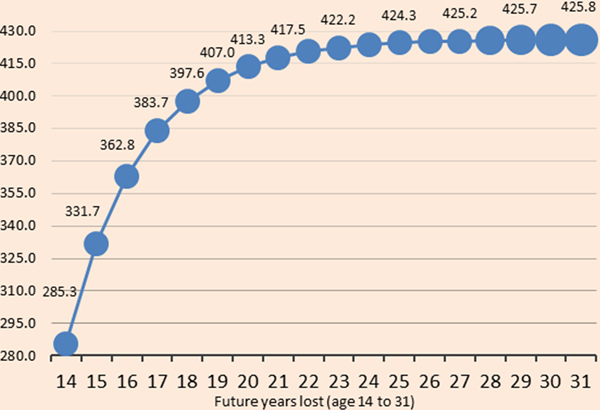
Figure 1 shows growth- and instability-adjusted non-health GDP loss associated with measles-related deaths increases with PYLL at a decreasing rate. Each additional PYLL results in a smaller increase in the loss since the earlier years of a child's life are more important to future productivity. Conflict and fragility conditions account for part of the bigger marginal losses in the initial future PYLL.
Growth- and CFI-adjusted non-health GDP loss ($ millions) associated with future years of life lost due to measles (from 14 to 31 years).
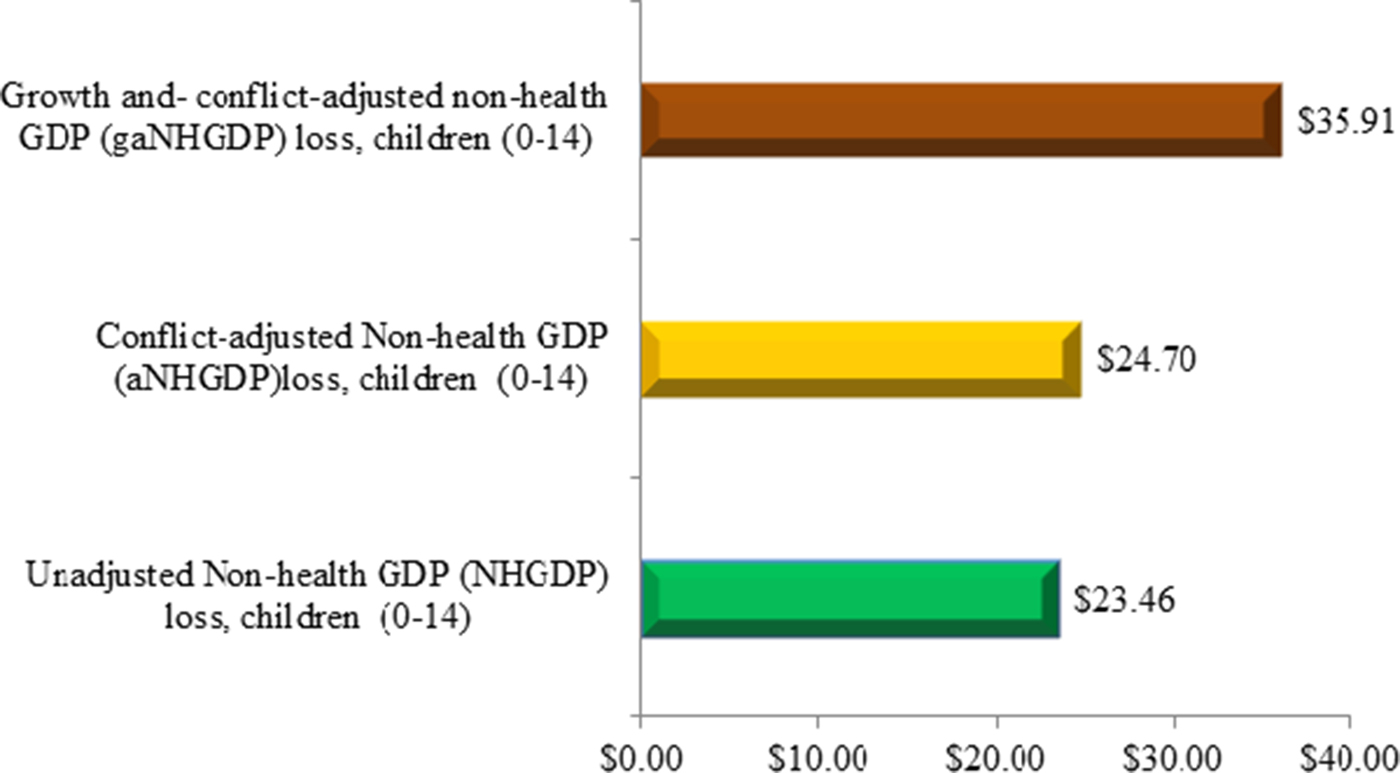
Taking into account conflict and fragility conditions would increase the estimated total loss by 5.3% to $24.70 million. The loss is expected to be $35.91 million over the DPYLL, adjusting the aNHGDPPC for an upper limit modified growth. This translates to a loss of $9645 per death in 2015 value. The upper limit modified growth assumption implies that the NHGDPPC will not increase forever and cannot intuitively exceed GDPPC in any given year in the future. Figure 2 depicts the baseline results with conflict and growth adjusted values.
Present value non-health GDP loss ($ millions).
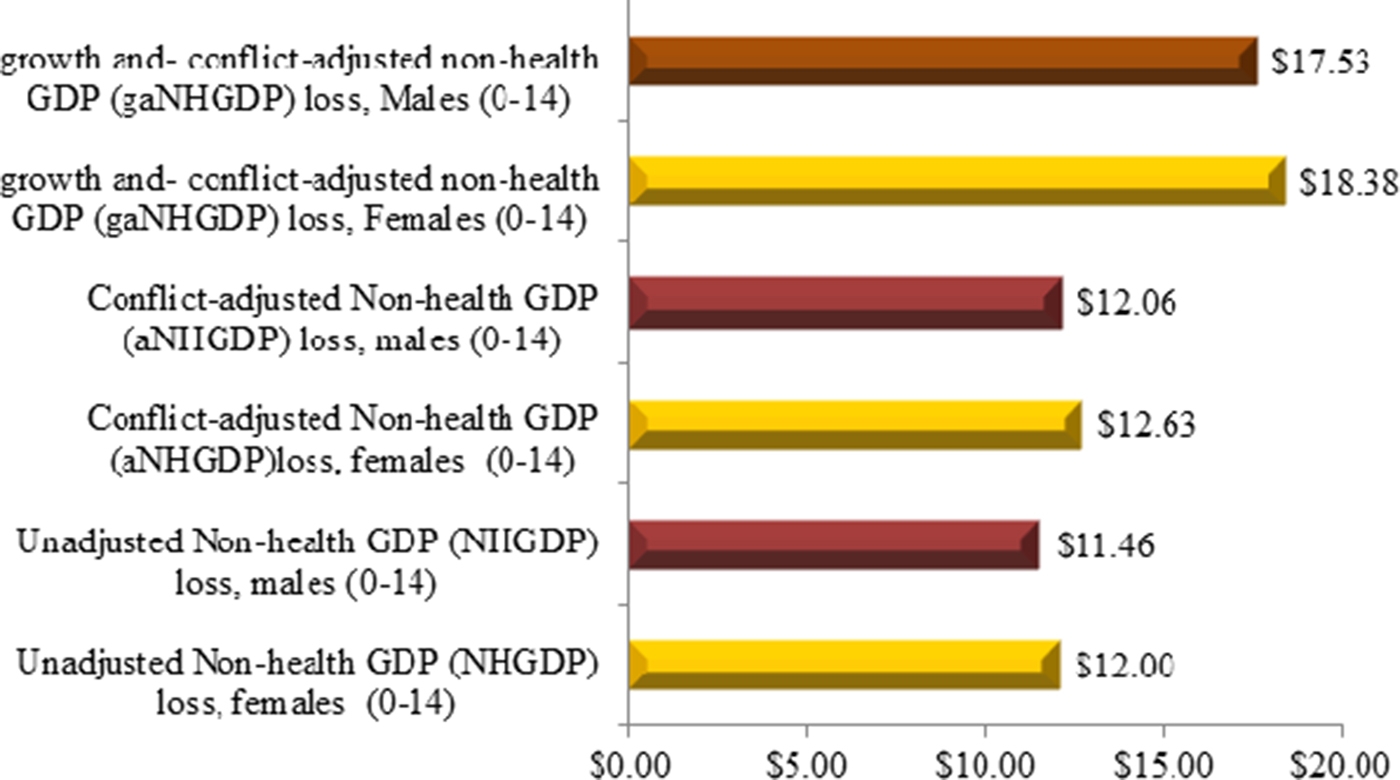
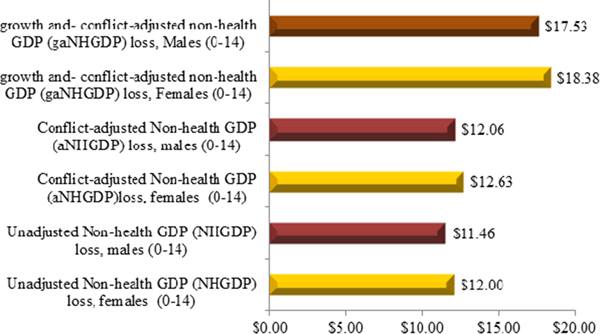
Disaggregating the NHGDPLoss by gender reveals that female children aged 0–14 years would approximately account for 51.2% of the indirect cost related to measles deaths (Fig. 3).
Present value non-health GDP loss ($ millions) by gender.
Sensitivity results
Table 2 depicts the model factor input assumptions with baseline values and variability of ±20%.
Baseline parameter assumption values

Table 3 shows a 20% reduction in the discount rate, the proportion of aNHGDPPC to GDPPC and conflict and fragility conditions increased the indirect cost by 10.8%, 1.1% and 1.3% to $39.79, $36.31 and $36.4 million, respectively. These increases were up from the baseline case of $35.91 million. However, a 20% reduction in the PTMD(0–14) decreased the indirect cost to $28.73 million, representing a fall of 20% down from the baseline case of $35.91 million. Table 3 also shows that a 20% increase in the discount rate, the proportion of aNHGDPPC to GDPPC and conflict and fragility conditions decreased the indirect cost to $32.56, $35.02 and $35.81 million, respectively, down from the baseline case of $35.91 million. However, a 20% increase in the PTMD(0–14) symmetrically increased the indirect cost by 20% to $43.09 million, up from the baseline case.
Sensitivity and adjusted sensitivity of indirect cost associated with measles-related deaths ($000’)

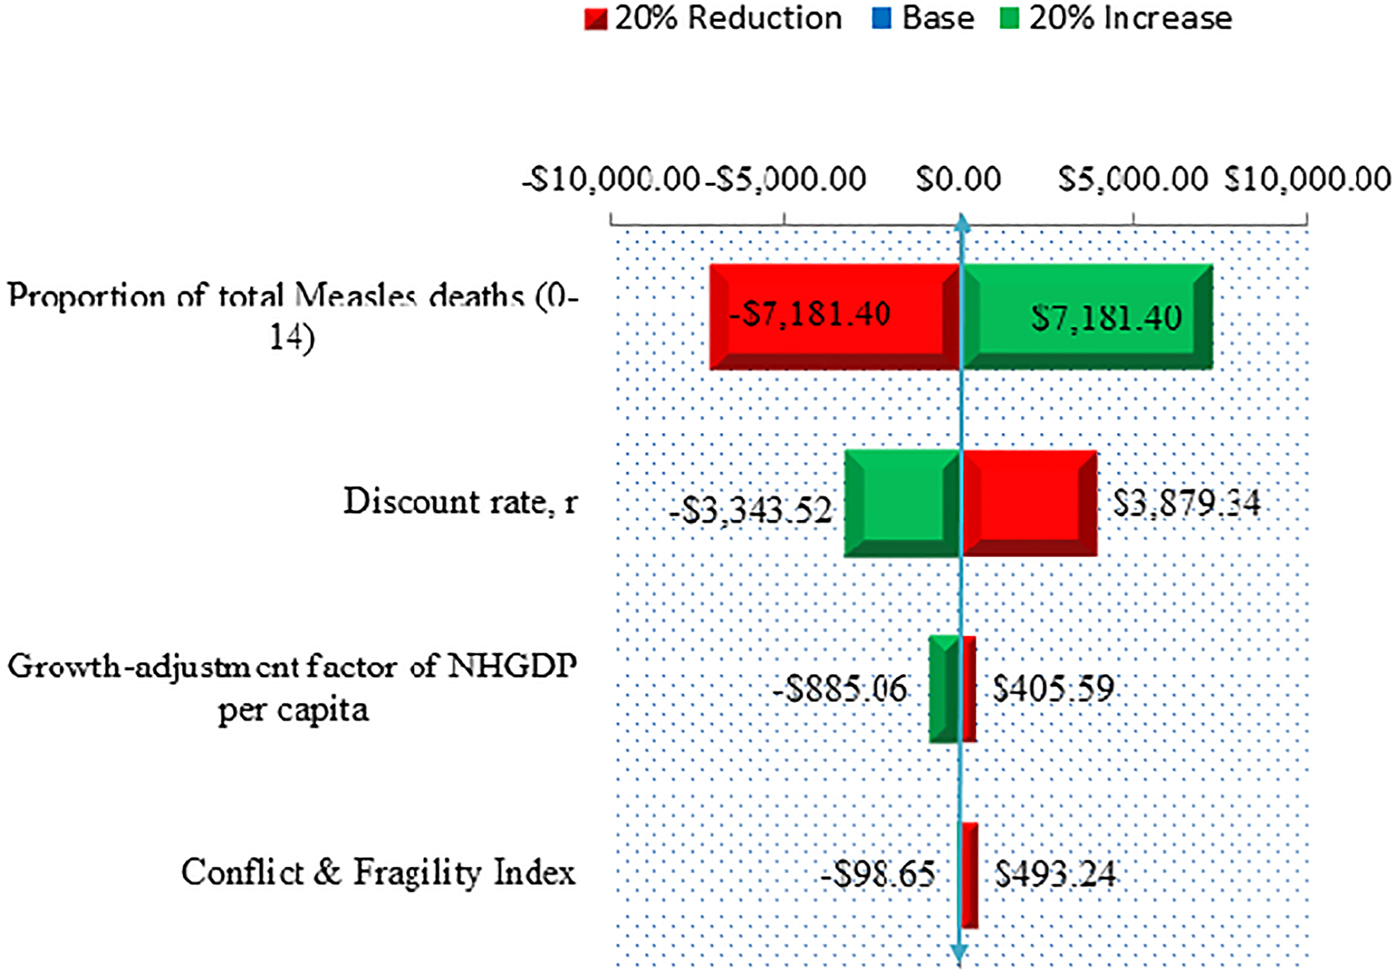
Finally, Table 3 shows adjusted sensitivity, which essentially is the relative and absolute changes (ranges), associated with a ±20% variability of the parameter assumptions. A 20% reduction in discount rate, the proportion of aNHGDPPC to GDPPC and conflict and fragility conditions would add to the baseline total loss approximately $3.88 million, $405 590 and $493 240 respectively, while a 20% increase in these factors reduces the total loss by $3.34 million, $885 060 and $98 650 respectively, during the same period. Allowing the PTMD(0–14) to vary in a similar fashion would produce the opposite effect. For example, a 20% reduction in the PTMD(0–14) would decrease the total loss by approximately $7.18 million while a 20% increase in this factor would symmetrically add the total loss same amount.
The foregoing sensitivity analyses show that the NHGDPloss associated with measles-related deaths would change when the variability of the different model factor input assumptions are taken into consideration. However, the changes do not much influence the actual estimates in relation to the baseline value, suggesting that the results are robust to the different model factor input changes.
Figure 4 shows a Tornado diagram depicting the sensitivity of the NHGDPLoss with respect to epidemiologic and economic factors. The PTMD(0–14) and the discount rate would account for much of the variability of the loss to the economy. However, less uncertainty would be attributable to instability and growth adjusted assumptions in the health system and macroeconomic fundamentals and conflict and fragility conditions.
A Tornado Diagram depicting the sensitivity of NPV Non-Health GDP per Capita loss ($000’) with respect to epidemiologic and economic factors.
Discussion
Setting out to provide evidence in Somalia, this study estimated the indirect cost associated with measles-related deaths among children aged 0–14 years. Generally, the literature shows that measles continues to affect African countries [Reference Ibrahim32, Reference Mandomando33]. The disease remains a killer among vaccine-preventable diseases, especially among children of developing countries [Reference Stein34, Reference Bryce35]. Additionally, a recent systematic review of the epidemiologic and economic burden of measles, mumps, pertussis and varicella in Germany suggested that there was still considerable morbidity due to childhood diseases [Reference Damm36]. The present study estimation of a significant indirect cost associated with measles-related deaths may be a clear pointer that the disease continues to affect Somalia, especially among children 14 years and younger, robbing off their future productivity and contributions to society. The findings support outcomes of previous studies which reported that measles complications and deaths were disproportionately borne by underage children [Reference Muscat37, Reference García Comas38]. The results also relate to the continued global burden of measles in terms of incidence even in developed countries in the European and Western Pacific Regions [39, 40] and in the United States [40, Reference Ortega-Sanchez41]. The economic burden of measles in these countries, however, mostly related to direct healthcare costs [Reference Van Den Hof43–Reference Beutels and Gay47].
The results further suggest that the estimated economic loss due to measles-related deaths would increase with conflict and fragility conditions over the discounted future PYLL, adding to Somalia's both short-term and long-run economic burden. While the present study provides a different context and considers the additional assumption of conflict and fragility conditions, the results are not only consistent with the indirect and direct cost of measles [Reference Svihrova48, Reference Filia49], but also congruous to findings of studies of other high burden infectious diseases [Reference Kirigia20].
Previous studies examined gender differentials with regards to measles burden. A world review of gender differences in measles mortality showed that females had higher mortalities than males even though they may have generally lower mortalities than males in all ages [Reference Garenne50]. The results suggest that measles-related deaths of girls aged 0–14 years would account for slightly more than half of the loss (51.2%).
To account for uncertainty in data and robustness of results, health economics literature emphasises the need for sensitivity analysis [Reference Levin and McEwan28–Reference Taylor31]. The present study suggests the model and results are robust although somewhat sensitive to changes in the epidemiologic and economic factors, affirming the need for sensitivity analysis. The PTMD0–14 and the discount rate were found to account for much of the variability of the economic loss. Conflict and fragility conditions were associated with less variability, perhaps due to the increasing regularity of such situations in Somalia, a country with weak health and economic systems. The analyses of this paper make a unique contribution to evidence of the economic burden, especially the indirect cost associated with measles-related deaths of children in Somalia. The analyses make a case for estimating and quantifying the total NHGDP loss associated with DPYLL due to measles while adjusting for conflict and fragility conditions in a country with weak health and economic systems. Measuring the indirect cost of measles in this manner is important as it may inform evidence-based interventions that may potentially reduce mortality.
It is important to note several limitations, however. It should be noted that the analysis of this paper was limited to the indirect cost of measles. The analysis did not include direct healthcare costs of measles, making it a partial evaluation. This means that the estimated non-health loss was only related to the value of resource lost due to measles deaths. Potential morbidity costs were not included because of data limitation, implying the absence of some indirect cost relating to the value of future losses in productivity or potential illness or disabilities that may limit the full contributions of people to society. While the estimated measles-related economic burden may inform the need to increase allocation towards prevention or direct healthcare management, it is limited in determining how resources are to be distributed [Reference Pervanidou51]. Thus, this study is limited in informing public health priority settings, in part because of the absence of costs of alternative interventions that could prevent measles-related morbidity and mortality [Reference Shiell, Gerard and Donaldson52, Reference Drummond53]. Finally, there is underreporting of measles in Somalia since the country has fewer than 50% immunisation coverage and uses selected sentinel sites, lacking nationwide surveillance. Consequently, the economic burden captured and reported in this study may be conservative and should be interpreted as such.
Conclusion
In conclusion, the present study's adjustment for conflict and fragility conditions extends the COI approaches and framework of reporting economic evaluation, especially the estimation of economic consequences of disease and injury. The results suggest a significant indirect cost associated with measles-related deaths of children aged 0–14 years in Somalia. The findings underscore the extent of the additional burden of conflict and fragility conditions on measles-related indirect cost in a weak healthcare system, which may point to underlying challenges of reducing mortality.
Given the suggestion that the PTMD0–14 was attributed to the greatest variability in the estimated loss and the importance of reducing measles mortalities to health policy expert and practitioners, continued concerted effort involving systemised healthcare and disease control programmes are paramount. Such programmes should include deliberate nationwide surveillance to increase universal coverage of vaccinations by the healthcare system and/or government and non-government actors. Since conditions of conflict and fragility add up to the economic burden of measles, there needs to be simultaneous concerted to promote security and anti-poverty programmes.
The present value of the estimated indirect cost was robust although it exhibited sensitivity to the variability of the discount rate. While the cost is a future economic burden, it is one which the health system, policymakers, government and other stakeholders should be prepared to colossally discount. Thus, any intervention to control measles could not be timelier as collective actions such as disease surveillance and security measure could be taken now to reduce measles deaths of children 0–14 years in the future. Otherwise, future measles-related costs might be colossal. The society must today place significant value on future benefits to be realised some years to come.
Further research is required to study the full cost of measles, including direct cost. In addition, there is an urgent need for investigating the capacity of the national and local health systems in discounting future burden of measles by responding to periodic outbreaks.
Data
Data were collected from various sources, but inputs used can be availed upon request.
Conflict of interest
The author declares that he has no competing interests.
Appendix
Data inputs and sources





 Open access

