

I. INTRODUCTION
Magnesium Reference Liang, Guan, Tan, Chen and Tang1–Reference Zhang, Tang, Deng, Yang and Liu3 alloys with additions of rare earth (RE) elements are receiving more and more applications in automotive and aerospace industries due to their high strength and good creep resistance at ambient and elevated temperatures. Reference Bohlen, Yi, Letzig and Kainer4–Reference Zhu, Sun, Cui, Wu, Betsofen, Leng, Zhang and Zhang8 RE elements play a key role in modifying the microstructure of Mg alloys. Reference Stanford and Barnett6 Through the microalloying of Mg with RE elements the grain sizes can be reduced. RE-rich particles can pin the grain boundaries, or become the nucleation sizes during dynamic recrystallization (DRX) (particle stimulated nucleation, PSN), both resulting in a high degree of grain refinement and thus contributing to the improvement of formability. However, large particles can also limit ductility enhancement by promoting early fracture.
The texture influences the ductility of Mg alloys. A texture that places most grains in an orientation where it is difficult to deform results in high flow stresses, modest work hardening and, therefore, low values of uniform elongation. Reference Bohlen, Yi, Letzig and Kainer4–Reference Wu, Jin, Wang, Sun, Zhang, Ding and Dong7,Reference Bohlen, Nürnberg, Senn, Letzig and Agnew9,Reference Ball and Prangnell10 It is well recognized that RE elements can weaken and randomize the texture of Mg alloys. The texture weakening has been associated with different mechanisms, such as the easier activation of nonbasal slips Reference Mirza, Chen, Li and Zeng5,Reference Wu, Jin, Wang, Sun, Zhang, Ding and Dong7 and distinct recrystallization behaviors. Reference Bohlen, Nürnberg, Senn, Letzig and Agnew9,Reference Ball and Prangnell10 In the highly alloyed WE54 material, the weakened texture was suggested to result from PSN due to the coarse particles. However, Reference Al-Samman and Li11 in a Mg–Zn–Zr alloy with different RE additions PSN was not the only one mechanism for texture weakening, and solute related effects seemed to play a more significant role in highly soluble alloys, such as Gd (0.73 wt%) and Nd (0.58 wt%). Reference Stanford and Barnett6 RE additions can weaken and modify the texture when in solution at very low alloying levels (such as Mg–1.55 wt% Gd alloy). RE solute atoms segregated to the grain boundaries and affected the grain boundary motion, which could alter the common deformation texture observed in conventional Mg alloys. The impact of RE elements on the texture is potentially important for Mg–RE alloys, which need more attentions.
Mg–Gd–Y–Nd–Zr (Refs. Reference Hou, Peng, Cao, Xu, Kamado, Wang, Wu and Wang12–Reference Peng, Wang, Wu and Wang14) alloy system is newly developed which exhibits notably age-hardening behavior and high mechanical properties. Reference Peng, Wang, Wu and Wang14 The ultimate tensile strength and yield strength of Mg–8Gd–0.6Zr–2Nd–Y (wt%) alloy in the peak-aged state can achieve 293 and 221 MPa at room temperature. Reference Liu, Le, Zhang, Bao and Cui13 The as-extruded Mg–6Gd–3Y–6Nd–0.6Zr alloy had the ultimate tensile strength, yield strength, and elongation of 336 MPa, 300 MPa, and 2.5%, respectively. In the present work, an extruded Mg–8Gd–4Y–1Nd–0.5Zr (wt%) alloy with RE-rich particles in the microstructure was preheated and subjected to hot compression. The evolutions of microstructure and texture were investigated after preheating and hot compression, and the impact of RE-rich particles on texture was discussed. The mechanical properties and aging behavior were also examined.
II. EXPERIMENTAL PROCEDURES
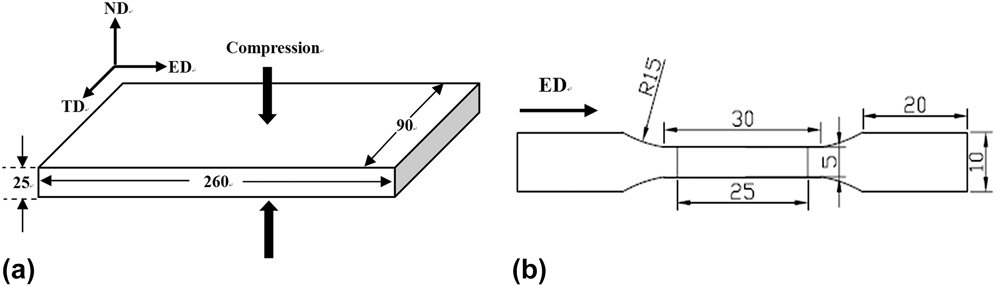
The rectangular billets (260 × 90 × 25 mm3) for hot compression were wire-electrode cut from an extruded Mg–8Gd–4Y–1Nd–0.5Zr (wt%) plate along the extrusion direction (ED). The billets were preheated at 500 °C for 0.5 h and subsequently compressed to a true strain of 0.69 at temperature 450 °C and a strain rate of 0.2 s−1 in one pass along the normal direction (ND), followed by quick quenching into cold water. Figure 1(a) shows the schematic diagram of the billets for compression. ED, ND, and transverse direction (TD) of the extruded plate are adopted to describe the experimental results after compression. The cylindrical samples for tensile testing were machined into 5 mm gauge in diameter and 30 mm gauge in length along ED, as shown in Fig. 1(b). Tensile tests were carried out at room temperature on an Instron 50 kN 3369 test machine (Instron, Canton, Massachusetts) at a crosshead speed of 1 mm/min. Three specimens were tested for each condition. Gauge length markers about 25 mm were drawn on each tensile sample to measure the percentage elongation after fracture. Some samples from the extruded plate and the compressed plate were aged at a temperature of 225 °C to obtain a peak-aged state.
(a) Schematic diagram of the billets for compression and (b) dimensions of cylindrical tensile sample (unit: mm). A gauge length of 25 mm was marked for tensile strain measurement.

The microstructures were examined by Olympus DP 71 optical microscope (OM; Olympus, Tokyo, Japan) and Leo 1530 field emission gun-scanning electron microscope (Leo Electron Microscopy Ltd., Cambridgeshire, UK). Determination of the phases was carried out by x-ray diffraction (XRD). The average grain size was obtained by the mean linear intercept method. The average diameter and area fraction of the particles were calculated using ImageJ. The extruded, preheated, and compressed samples were prepared for electron backscatter diffraction (EBSD) mapping to determine the textures (using the HKL commercial software).
III. RESULTS AND DISCUSSION
A. Microstructure evolution
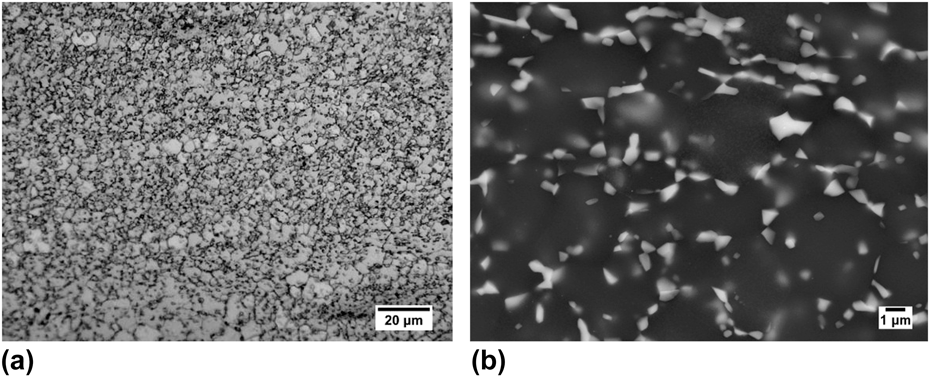
The extruded plate displays a reasonably uniform microstructure. Small and equiaxed grains with an average size of ∼3 μm dominate the microstructure while the middle planes have a few larger grains (∼50 μm). Figure 2 presents a uniform microstructure of the extruded alloy on the plane perpendicular to ED. Small grains are associated with particles with irregular shapes and these are seen more clearly in the scanning electron microscope (SEM) image in Fig. 2(b). It is shown that most of these particles are located along grain boundaries; few are precipitated in the grain interiors. A pinning force always arises from particles, hindering the grain boundary mobility, and leading to a microstructure of fine grains. For the extruded alloy, the area fraction of particles is ∼14% and the average diameter is ∼0.3 μm.
The extruded alloy: (a) OM image showing a uniform microstructure of small grains; (b) SEM image showing the distribution of particles along grain boundaries (ED out of page).

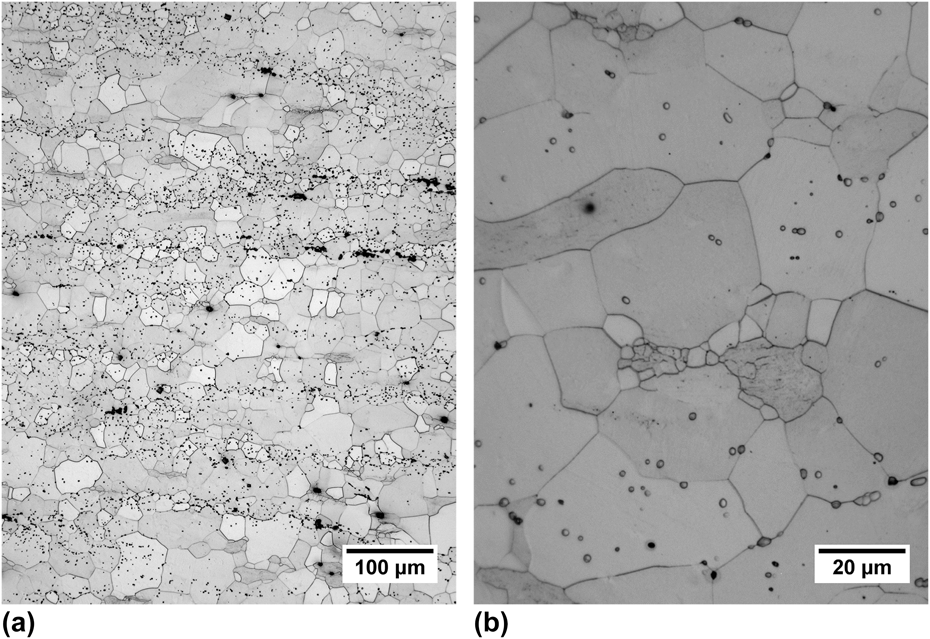
As exhibited in Fig. 2, vast particles are precipitated in the extruded alloy and this is detrimental for the subsequent deformation. As a result, the extruded alloy was preheated at 500 °C for 0.5 h before hot compression. Figure 3 shows the microstructure of the preheated alloy on the plane normal to ED. After preheating, the average grain size rises to ∼13 μm. Meantime, the grain size distribution is not uniform: some grains can be as small as ∼1 μm, while other grains can be as large as ∼73 μm [Fig. 3(b)]. This indicates the formation of new grains due to static recrystallization and the grain growth during the preheat treatment. Moreover, particles have a notable trend to align along TD. A significant dissolution of particles is observed in the preheated alloy because the area fraction decreases to ∼3%, resulting in a profound increase of average grain size due to the decreasing pinning force. However, the average diameter of particles increases to ∼0.8 μm.
OM images of the preheated alloy: (a) low magnification and (b) high magnification (ED out of page).

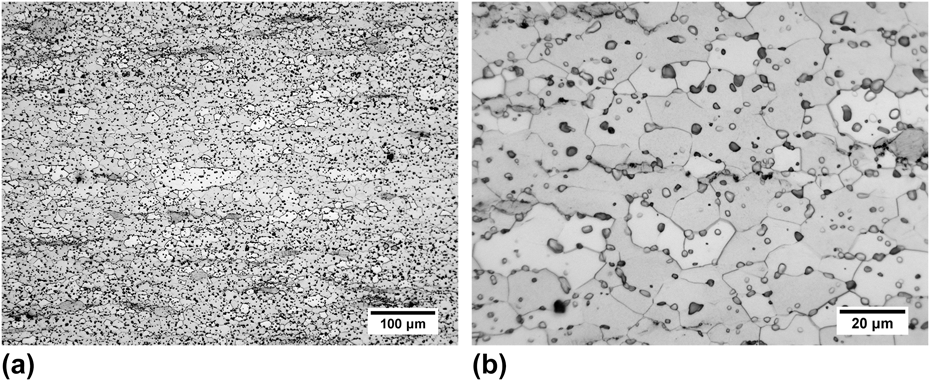
Figure 4 gives the microstructure of the compressed alloy on the plane perpendicular to ED. After compression, a microstructure characterized by a uniform grain size as well as a uniform distribution and morphology of particles is obtained. The average grain size is ∼6.0 μm. The occurrence of DRX during compression is mainly responsible for the grain refinement. In addition, compression at 450 °C leads to an apparent dynamic precipitation of particles because the area fraction reaches ∼8%, while the average diameter is ∼1.7 μm. It is also seen that the particles are randomly distributed both in the grain interiors and along grain boundaries. During hot compression, the absorbed energies are on the one hand beneficial for the formation of new DRX grains, and on the other hand helpful for the precipitation of particles. These two processes are competitive because both release the stored energies.
OM images of the compressed alloy: (a) low magnification and (b) high magnification (ED out of page).

B. Phase determination
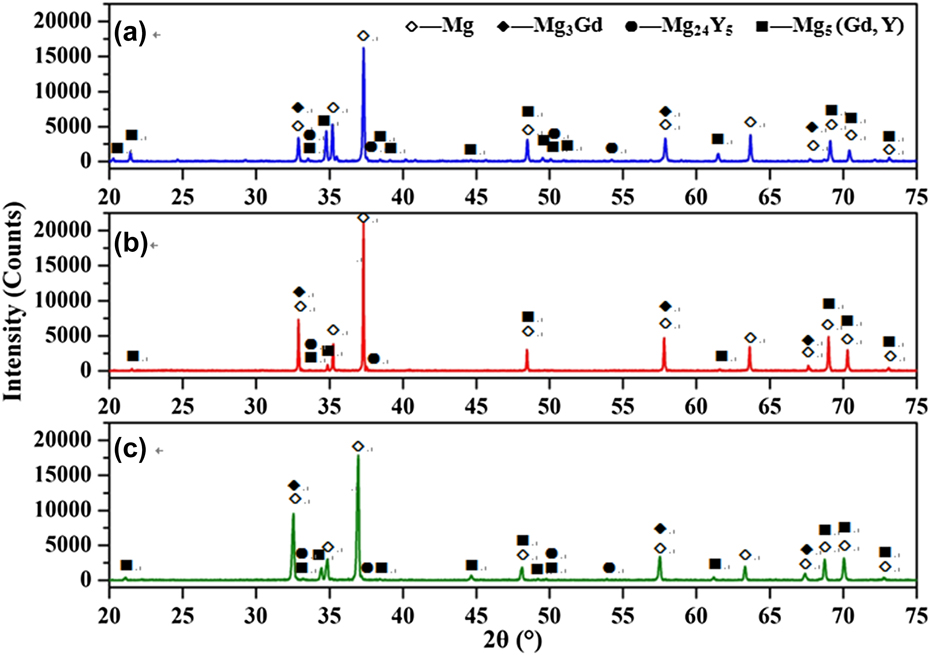
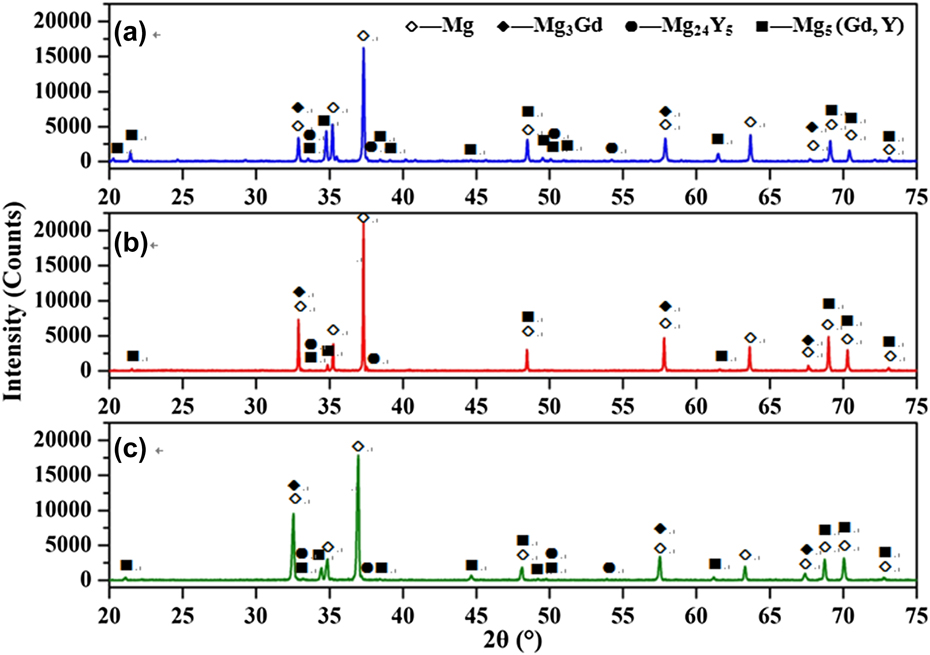
XRD tests were done on the extruded alloy, the preheated alloy, and the compressed alloy to examine the evolution of phases, and the results are shown in Fig. 5. Mg5 (Gd, Y) phase is detected in the three alloys. Peaks of Mg5 (Gd, Y) phase are the strongest in the extruded alloy [Fig. 5(a)], while they are remarkably weakened after preheating [Fig. 5(b)]. However, peaks of Mg5 (Gd, Y) phase have become stronger after compression [Fig. 5(c)], which prove the occurrence of dynamic precipitation during compression. As a result, the evolution of Mg5 (Gd, Y) phase obtained in the XRD results is consistent with that seen from the above optical images of the studied alloys. Reference Li, Zhang, Deng and Tang15 It was suggested that the full dissolution of the Mg5 (Gd, Y) phase in a Mg–Gd–Y alloy was 658 °C. Thus, a certain amount of Mg5 (Gd, Y) particles is retained after the preheat treatment at 500 °C and more Mg5 (Gd, Y) particles are dynamically precipitated during hot compression at temperature up to 450 °C in this work. It is necessary to mention that the peaks of Mg3Gd and Mg24Y5 phases are also detected in Fig. 5, although they are very weak.
XRD patterns of: (a) the extruded alloy; (b) the preheated alloy, and (c) the compressed alloy.
C. Mechanical properties
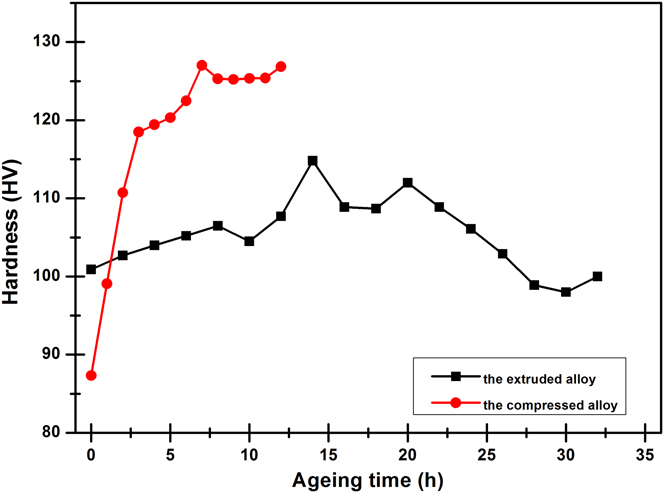
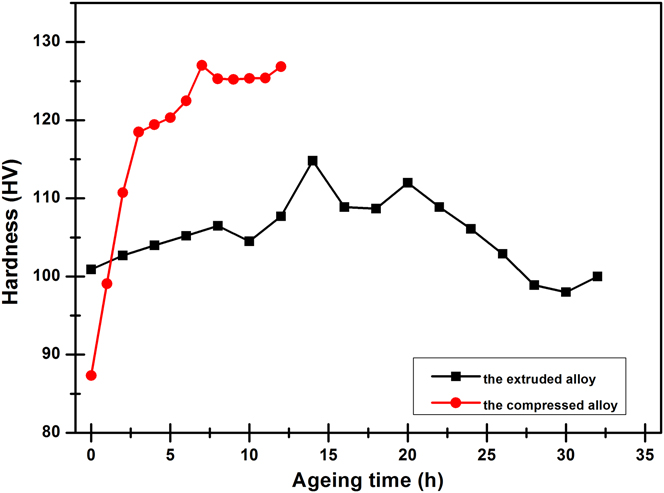
The Vickers hardness of the extruded alloy and the compressed alloy as a function of aging time is shown in Fig. 6. The original hardness of the extruded alloy is 101 HV, higher than 87 HV of the compressed alloy. However, the extruded alloy presents a lower aging hardening ability than the compressed alloy when both aged at 225 °C. The extruded alloy arrives at the peak hardness value of 115 HV after 14 h, only a hardness increment of 14 HV. The compressed alloy reaches the peak hardness value of 127 HV after 7 h with a larger hardness increment of 40 HV. Obviously, the high area fraction of Mg5 (Gd, Y) phase in the extruded alloy reduces its subsequent aging hardening ability.
Aging hardening response of the extruded alloy and the compressed alloy at different aging time.
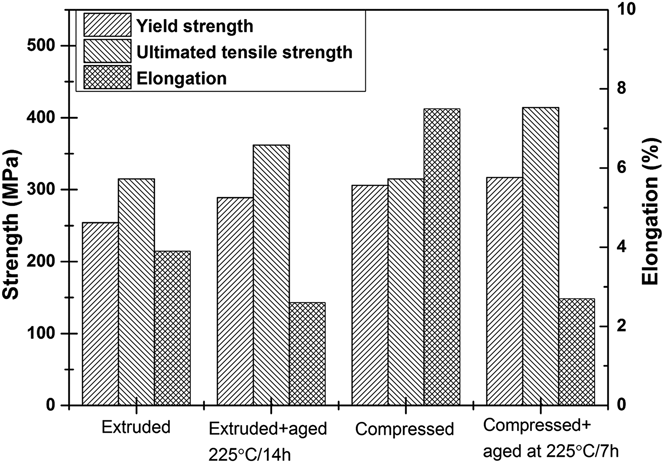
Some tensile samples in both the extruded state and the compressed state were peak aged at 225 °C in an attempt to examine the mechanical properties, and the results are shown in Fig. 7. Compared to the extruded alloy, the compressed alloy shows an equivalent ultimate tensile strength, but its yield strength and elongation are much higher, as well as the yield ratio. The improvement of elongation of the compressed alloy could be mainly brought by its uniform microstructure comprising the grain size and the distribution of particles which will significantly decrease the local stress concentrations.
Mechanical properties at room temperature. Results shown are an average of three tests.

After peak aging treatment, the ultimate tensile strength of the compressed alloy increases from 315 to 416 MPa, a bigger jump than the extruded alloy (from 315 to 362 MPa). As evidenced by both OM images and XRD results, more RE-rich particles in the compressed alloy are dissolved into the matrix, Reference Wu, Zhang, Deng, Tang and Zhong16 which is helpful for the formation of the β′ strengthening phase during aging. Precipitation strengthening is the main contributor to the higher strength of the compressed alloy after peak aging. In whole, the compressed alloy shows better comprehensive mechanical properties than the extruded alloy.
D. Microtexture analysis
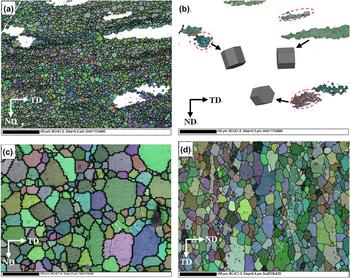
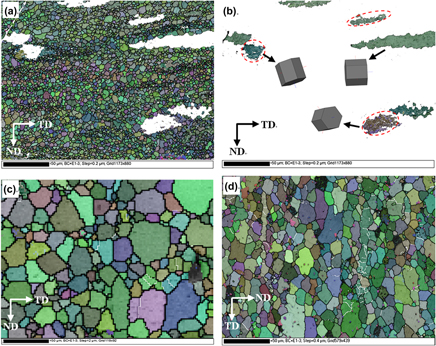
Figure 8 presents the EBSD maps of the extruded alloy, the preheated alloy, and the compressed alloy. In all orientation image maps, thin white line and thick black line represent low-angle grain boundaries (LAGBs, grain boundaries misorientation ≤15°) and high-angle grain boundaries (grain boundaries misorientation >15°), respectively. EBSD map detects the nonuniform microstructure of the extruded alloy, consisting of small grains in Fig. 8(a) and some extra-large grains in Fig. 8(b). Figure 8(a) depicts the same grain structure as that in Fig. 2. The existence of extra-large grains is detrimental for the comprehensive mechanical properties of the extruded alloy (see Fig. 7). Hexagonal cells of the extra-large grains in Fig. 8(b) indicate three orientations: c//TD (4 grains), c//ND (2 grains), and c//ED (1 grain). These extra-large grains show strong orientations. Thus, the texture of the extruded alloy is analyzed in two parts of small grains and the extra-large grains, and this will be discussed later. At the same time, many LAGBs are observed in the extra-large grains [see red circled areas in Fig. 8(b)]. During the subsequent preheat treatment, several reasons may lead to the disappearance of LAGBs, such as through the relaxation of dislocation arrays, or supporting the growth of the neighboring grains, or resulting in the formation of new grains due to static recrystallization. Figure 8(c) shows the EBSD map of the preheated alloy. The LAGBs are more scattered when compared with those of the extruded alloy. Figure 8(d) shows the EBSD map of the compressed alloy. The deformed grains have a not-so-obvious trend to elongate along TD. Most LAGBs are concentrated in some large and elongated grains.
EBSD maps of: (a) small grains in the extruded alloy; (b) the extra-large grains in the extruded alloy; (c) the preheated alloy, and (d) the compressed alloy. (These four maps have the same length scale.)

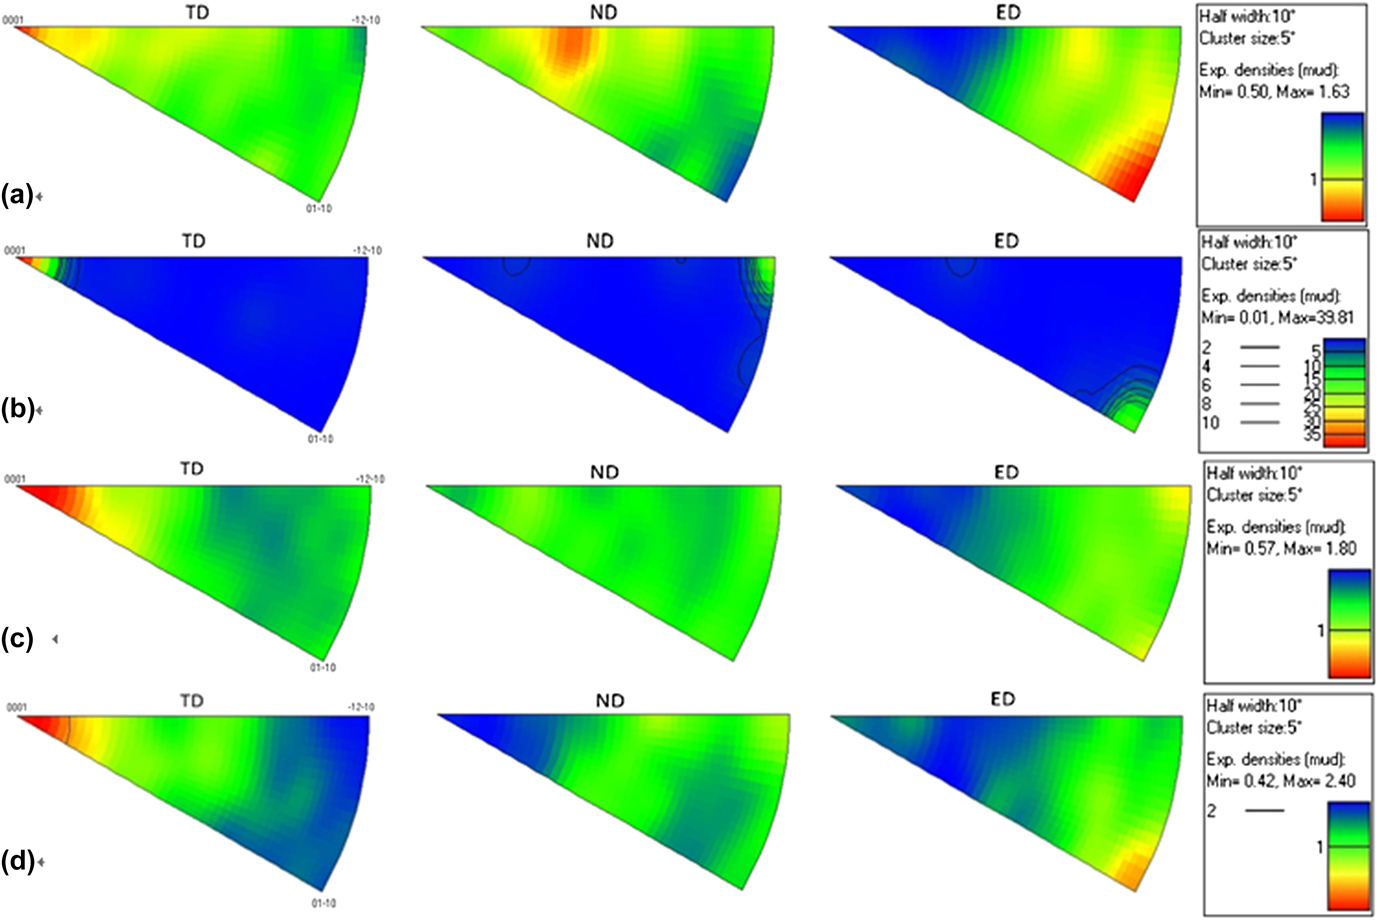
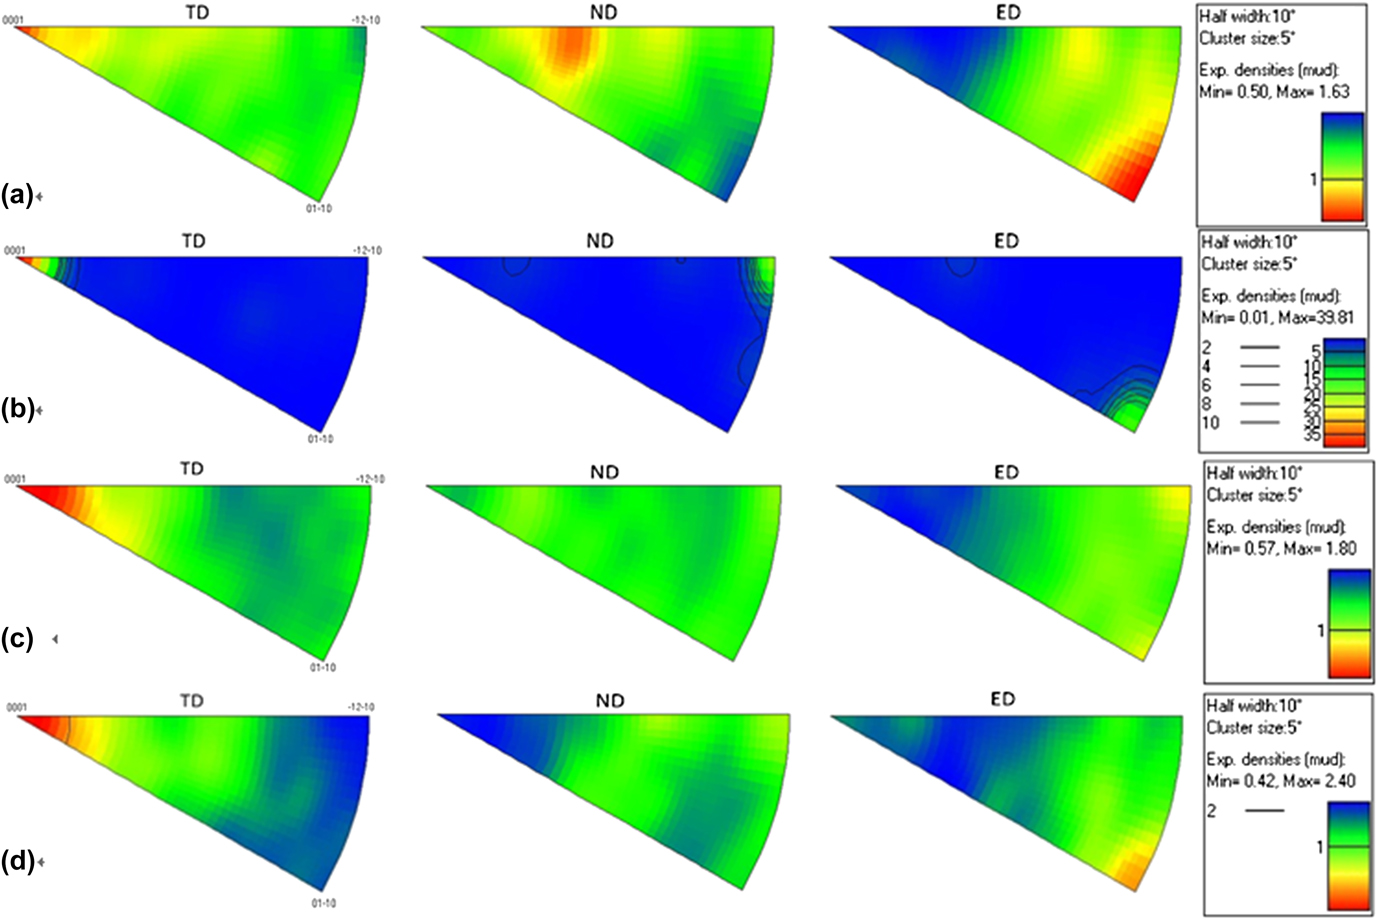
The corresponding pole figures of the studied alloys are shown in Fig. 9. Figure 9(a) exhibits small grains in Fig. 8(a) in the extruded alloy have a weak and random texture with the maximum intensity of 1.63 (mud). Specifically, three distinguishable texture peaks are located at
 $\left\langle {0001} \right\rangle //{\rm{TD}}$
,
 $\left\langle {11\overline 2 1} \right\rangle //{\rm{ND}}$
, and
 $\left\langle {10\overline 1 0} \right\rangle //{\rm{ED}}$
, respectively. Small grains principally orient their c-axes normal to ED. Since the extruded alloy is highly alloyed, it is difficult to tell the influences of RE solutes in the matrix and RE-rich particles on the texture apart. The weak recrystallization texture of the extruded alloy may stem from both of them. Figure 9(b) gives a strong texture type of
 $\left\langle {0001} \right\rangle //{\rm{TD}}$
of the extra-large grains in the extruded alloy, according with the hexagonal cells marked in Fig. 8(b). The texture of the extruded alloy is
 $\left\langle {0001} \right\rangle //{\rm{TD}}$
with the maximum texture intensity of 4.58 (mud) by analyzing the small grains and the extra-large grains together. The preheated alloy presents a main texture component of
 $\left\langle {0001} \right\rangle //{\rm{TD}}$
with the maximum texture intensity of 1.80 (mud), as shown in Fig. 9(c).
Reference Farzadfar, Sanjari, Jung, Essadiqi and Yue17
Upon annealing of the deformed Mg alloys, the texture can remain unchanged, but weakened with the addition of Y element. The texture type of the extruded alloy in the present work is kept the same but strongly weakened after preheating. And it is interesting to observe in Fig. 9(d) that the texture of the compressed alloy is also
 $\left\langle {0001} \right\rangle //{\rm{TD}}$
.
Inverse pole figures (IPF) of: (a) small grains of the extruded alloy; (b) the extra-large grains in the extruded alloy; (c) the preheated alloy, and (d) the compressed alloy. In IPF, red color represents the maximum intensity.
Basal texture is preferred to form after compressive deformations, such as in AZ31,
Reference Al-Samman, Li and Chowdhury18–Reference Wang, Xin, Huang and Liu22
AZ80,
Reference Shi, Chen and Ke23
and ZK60 (Ref. Reference Wang, Kang and Cho24) alloys,
Reference Hadorn, Hantzsche, Yi, Bohlen, Letzig, Wollmershauser and Agnew25–Reference Xia, Zhang, Li, Ma and Li27
but the situation is rather different in the researches of Mg–RE alloys. In the conventional Mg alloys, the obtained basal texture is often related to basal slip
Reference Chang, Wang, Zhao and Qi19,Reference Wang, Xin, Huang and Liu22
; when the initial grain orientations are favorable for tensile twinning, c-axes of grains can be rotated about 86.3°
 $\left\langle {11\overline 2 0} \right\rangle$
to form the basal texture. These two situations are not the explanation to the present study.
Reference Li26
Li obtained a randomized basal texture component after hot compression of Mg–9Gd–4Y–0.6Zr alloy, where the deviation from the ideal basal texture arose from orientated growth within deformation bands.
Reference Xia, Zhang, Li, Ma and Li27
Xia et al. found that the orientation tended to be random in Mg–Gd–Y–Nd–Zr alloy after compression at 500 °C, which was attributed to DRX and dynamic precipitation. In the present research, the texture of the preheated alloy,
 $\left\langle {0001} \right\rangle //{\rm{TD}}$
, does not change after hot compression at 450 °C. As mentioned above, DRX is evident during compression, as well as dynamic precipitation.
Reference Cottam, Robson, Lorimer and Davis28
DRX grains followed closely the texture of parent grains during hot deformation both in pure Mg and Mg–Y alloys, implying that the change of texture caused by DRX can be ignored.
Reference Stanford and Barnett6,Reference Stanford, Atwell and Barnett29
The precipitated RE-rich particles tended to hinder the crystal lattice's rotation.
Reference Hadorn, Hantzsche, Yi, Bohlen, Letzig, Wollmershauser and Agnew25
Limited grain boundary mobility due to the RE elements solute segregation had suppressed conventional discontinuous DRX, which retained the deformation texture of Mg–RE alloys. These seem to be plausible explanations to the texture evolution during hot compression in this study. Furthermore,
Reference Xia, Zhang, Li, Ma and Li27
in consideration of the random orientation obtained in Xia's research where the alloy was compressed at 500 °C and the RE atoms were mostly dissolved into the Mg matrix with few RE-rich particles retained, it may conclude that RE elements dissolved in the Mg matrix can greatly weaken and randomize the texture while the retained RE-rich particles before deformation will keep the texture unchanged during hot deformations of Mg–RE alloys.
IV. CONCLUSIONS
In this work, the microstructure, texture, and mechanical properties of a Mg–8Gd–4Y–1Nd–0.5Zr (wt%) alloy after hot compression have been studied. The main results are concluded as follows:
-
(1) Boundaries of small grains (∼3 μm) are heavily pinned by irregular-shaped particles in the extruded alloy; these small grains show a weak and random texture, but three texture components of
 $\left\langle {0001} \right\rangle //{\rm{TD}}$
,
$\left\langle {11\overline 2 1} \right\rangle //{\rm{ND}}$
, and
$\left\langle {10\overline 1 0} \right\rangle //{\rm{ED}}$
are observed.
-
(2) The alloy after preheating displays a main texture type of
$\left\langle {0001} \right\rangle //{\rm{TD}}$
, which is reserved after compression because of the retained RE-rich particles in the preheated alloy. -
(3) The compressed alloy shows better comprehensive mechanical properties than the extruded alloy. Its ductility increases to 7.5% from 3.9% of the extruded alloy, which is probably attributed to more homogenous grain size and distribution of particles. The compressed alloy also presents a higher aging hardening ability than the extruded alloy. After peak aging, the yield tensile strength, ultimate tensile strength, and ductility of the compressed alloy are 317, 416 MPa, and 2.7%, respectively.


ACKNOWLEDGMENTS
The authors gratefully acknowledge the financial support from the National Basic Research Program of China (No. A0420110401). The present work was also carried out with the support of the Advanced Characterization Facility in Waurn ponds campus of Deakin University, Geelong, Victoria.