

INTRODUCTION
Among the most ubiquitous themes in research on citizens’ political attitudes and behavior is the influence of social groups. Group identity, membership, and affect have all been found to play a central role in shaping citizens’ political orientations and behavior (Miller, Wlezien, and Hildreth Reference Miller, Wlezien and Hildreth1991; Green, Palmquist, and Schickler Reference Green, Palmquist and Schickler2002; Conover and Feldman Reference Conover and Feldman1981), and nowhere is group influence felt more strongly than in policy attitudes, where citizens often base their policy preferences on their views of social groups supporting, opposing, and benefiting from public policies (Conover Reference Conover1984; Brady and Sniderman Reference Brady and Sniderman1985; Nelson and Kinder Reference Nelson and Kinder1996).
Any list of social groups important for public opinion should include religion. Religion-based groups have played an increasingly visible role in American politics and the impact of religious factors on individuals’ political orientations has grown markedly in recent decades (Layman Reference Layman2001; Green Reference Green2007; Putnam and Campbell Reference Putnam and Campbell2010). Accordingly, religious group cues should be important for citizens’ policy attitudes.
Here we investigate the impact of religious group cues with a survey experiment pitting pairs of religious groups on opposite sides of controversial policy issues. We find that religious group cues are consequential for policy attitudes. They matter primarily for cultural attitudes, among politically unaware individuals, and for the religiously unaffiliated, Democrats, and liberals.
SOCIAL GROUP CUES AND THE RELIGIOUS DIVIDE IN AMERICAN POLITICS
Public opinion research has identified a prominent role for social groups. Mostly uninterested in public affairs, knowing relatively little about political issues, and lacking coherent ideological foundations for their opinions, citizens seek simple ways to make political judgments (Campbell et al. Reference Campbell, Converse, Miller and Stokes1960; Converse Reference Converse and Apter1964; Delli Carpini and Keeter Reference Delli Carpini and Keeter1996; Popkin Reference Popkin1991). Of the simplifying devices, or “heuristics” employed by citizens, none are more powerful or widely used than identification with and feelings about the groups involved in policy debates (Conover Reference Conover1984; Sniderman, Brody, and Tetlock Reference Sniderman, Brody and Tetlock1991; Miller, Wlezien, and Hildreth Reference Miller, Wlezien and Hildreth1991; Nicholson Reference Nicholson2011). Because citizens tend to view the social world through the lens of “in-groups” and “out-groups” (Tajfel Reference Tajfel1982; Kinder and Kam Reference Kinder and Kam2009), they often base their political judgments on their feelings about, identification with, and moral evaluations of relevant social groups (Converse Reference Converse and Apter1964; Conover Reference Conover1984; Brady and Sniderman Reference Brady and Sniderman1985; Nelson and Kinder Reference Nelson and Kinder1996; Kinder and Kam Reference Kinder and Kam2009).
The power of group-based heuristics in shaping political judgments suggests that social group cues can affect citizens’ policy preferences. When information about the policy positions of politically-relevant social groups is provided to citizens, it reminds them of both where they should be on an issue (with the “in-groups” that they identify with or like), and where they should not be (against the “out-groups” that they dislike). Indeed, a large body of experimental and observational work has uncovered ample evidence for the strong influence of group cues on citizens’ policy attitudes (Cohen Reference Cohen2003; Lupia Reference Lupia1994; Mondak Reference Mondak1993; Brady and Sniderman Reference Brady and Sniderman1985; Goren, Federico, and Kittilson Reference Goren, Federico and Kittilson2009).
Social group cues may be especially important for the least politically-aware. While better-informed individuals base their policy attitudes on a wider range of information and better-developed ideological structures, their less-informed counterparts have little to rely on other than their group identities and evaluations. A number of scholars find that group-based cues have a particularly strong effect on the opinions of less-sophisticated individuals, often bringing their positions into line with those of the leaders and activists of their groups (Mondak Reference Mondak1993; Lupia Reference Lupia1994; Arceneaux and Kolodny Reference Arceneaux and Kolodny2009; Boudreau Reference Boudreau2009).
In addition to connecting citizens more closely to the dominant policy views of relevant groups, social group cues may condition the impact of broader political orientations, such as partisanship and ideological identification, on policy attitudes. According to a leading view, party identification is rooted in citizens’ social group identities and their perceptions of the social groups that strongly support each party (Green, Palmquist, and Schickler Reference Green, Palmquist and Schickler2002; Miller, Wlezien, and Hildreth Reference Miller, Wlezien and Hildreth1991; Campbell et al. Reference Campbell, Converse, Miller and Stokes1960). Although ideological identification is thought to reflect individuals’ underlying conceptual structures and policy predispositions, Conover and Feldman (Reference Conover and Feldman1981) show that liberal-conservative identification is often based in group affect and symbols of social conflict. Given this connection between social group identification on the one hand, and partisan and ideological identification on the other, cues about the issue positions of politically-relevant social groups may well trigger or depress the influence of these political orientations (Campbell, Green, and Layman Reference Campbell, Green and Layman2011).
The Political Importance of Religious Groups
Given the impact of social group cues in American politics, it stands to reason that religious group cues would matter as well. After all, religious groups have come to play an increasingly prominent role in politics, particularly conservative and Republican politics (Jelen Reference Jelen1993; Wilcox and Larson Reference Wilcox and Larson2010). The impact of citizens’ religious orientations on their political attitudes and behavior has grown markedly (Layman Reference Layman2001; Green Reference Green2007; Putnam and Campbell Reference Putnam and Campbell2010), with religion now surpassed only by race in political importance among social orientations (Olson and Green Reference Olson and Green2006).
But as the political influence of religion has grown, it also has changed. The religious divide in politics is no longer defined largely by affiliation with a religious tradition, but includes differences based on religious commitment, both within the major religious traditions (Wuthnow Reference Wuthnow1988; Hunter Reference Hunter1991; Layman and Green Reference Layman and Green2006; Green Reference Green2007) as well as between religious and non-religious citizens (Olson and Green Reference Olson and Green2006; Putnam and Campbell Reference Putnam and Campbell2010). As a consequence, faith-based politics has become more complex, with an array of religious groups available as a cueing source for citizens (Layman Reference Layman2001; Green Reference Green2007).
The growth and transformation of religion-based political divides has several implications for the impact of religious group cues on citizen policy attitudes. First, religious group cues are likely to be important for citizens’ policy judgments, and cues tapping into the divides between and within different religious traditions, and between religious and non-religious people, may all be consequential in particular contexts, including the religious, policy, and informational characteristics of citizens.
To test this, we employ a survey experiment in which respondents were given different cues about religious group positions on various policy issues — specifically, government help for homosexuals in jobs, government help for African-Americans, and government-provided health insurance. One group of respondents was told that “religious leaders” take one position on the issues while “non-religious leaders” take the other position, thus testing the persuasive power of religious group cueing generally. To test religious group cueing effects more specifically, another set of respondents was told that evangelical Christian leaders take one position while Catholic leaders take the other position. We incorporated the two largest religious traditions — which are both politically salient — in this specific treatment in order to compare differential effects between the two treatments as well as potential “in-group” and “out-group” dynamics not uncovered by the more general treatment.Footnote 1
Second, the effect of religious group cues should be differentiated by policy domain, and be strongest for attitudes on cultural issues. The literature on social group cues suggests that such cues have the most influence on individuals’ attitudes when they are most relevant to the issue at hand (Mondak Reference Mondak1993; Nelson and Kinder Reference Nelson and Kinder1996; Arceneaux and Kolodny Reference Arceneaux and Kolodny2009). Because the growing importance of religious commitment and the growing political distinctiveness of evangelicals have been most closely associated with cultural issues like abortion and gay rights (Hunter Reference Hunter1991; Layman Reference Layman2001; Layman and Green Reference Layman and Green2006), such information is likely to be most readily accessible — and thus most relevant to the “top of the head” judgments of our respondents (Zaller Reference Zaller1992) — on the homosexual jobs issue.
The cues invoking evangelical leaders also may be relevant on government assistance for African-Americans, activating perceptions, and stereotypes stemming from evangelical political history. Because of the traditionally disproportionate location of evangelicals in the South and the historical opposition of white southerners to black civil rights, there may be a latent association in respondents’ minds between evangelicalism and opposition to government help for blacks. Such associations may be reinforced by stereotypes of religious conservatives as intolerant, racist, and dogmatic among less-religious and more-liberal Americans (Bolce and De Maio Reference Bolce, De Maio and Wilson2007; Reference Bolce and De Maio2008; Greeley and Hout Reference Greeley and Hout2006). Given the traditionally weaker connection between religious groups and social welfare issues (Wilson Reference Wilson, Smidt, Kellstedt and Guth2009), our cues should have less influence on health insurance attitudes.
Third, the growing and changing role of religion in American politics implies that religious tradition and religious commitment should work together to mediate citizens’ responses to religious group cues. That religious commitment has grown more important while religious tradition has continued to be consequential does not necessarily mean that they have independent effects on political orientations. Instead, religious affiliation can mediate the political impact of religious commitment, so that the most committed members of a faith tradition are most likely to adhere to the values, norms, and positions predominant within the tradition, while less-committed members may be disconnected from those ideals (Green et al. Reference Green, Guth, Smidt and Kellstedt1996; Layman Reference Layman2001; Green Reference Green2007).
This seems to suggest that cues about the policy positions favored by a religious group would have their strongest positive effects on the most-committed members of the group, drawing them closer to the preferences of their tradition's leaders. However, the literature on source cues and policy attitudes suggests that when individuals are already knowledgeable about issues and the policy positions of various groups or already have formed strong opinions, cues about the policy inclinations of groups have relatively little impact on opinion (Lupia Reference Lupia1994; Druckman et al. Reference Druckman, Hennessy, Charles and Webber2010; Nicholson Reference Nicholson2011). That may well be the case for the most-committed adherents of a religious tradition. Such religionists should be very familiar with the predominant political views of their religion, have those views reinforced through pastoral leadership and social interaction, and thus be likely to already hold positions consistent with those of their religious groups and its leaders.
Religious group cues also are unlikely to have strong effects on the policy opinions of less-devout members of religious traditions. Given these individuals’ limited exposure and commitment to their religion and its values, religious group cues should be less likely to draw them toward the positions of their own group or away from those of competing groups.
Where religious group cues may have their strongest effect is among people without a religious affiliation. Their positive attraction to the positions espoused by “non-religious” leaders may be limited since most non-religious people do not belong to groups that appeal specifically to the non-religious or actively promote non-religious perspectives (Schoettmer et al. Reference Schoettmer, Campbell, Layman and Green2011). However, their negative reaction to position-taking by religious leaders and especially evangelical leaders may be strong. Non-religious people tend to view traditionally-religious groups, particularly evangelical Christians, quite negatively (Bolce and De Maio Reference Bolce and De Maio1999a; Reference Bolce and De Maio1999b; Reference Bolce, De Maio and Wilson2007; Reference Bolce and De Maio2008; Greeley and Hout Reference Greeley and Hout2006). In fact, some scholars argue that the rapid recent growth in the percentage of Americans with no religious preference is due in part to negative reactions to the increasingly strong connection between religion, especially evangelicalism, and conservative Republican politics (Hout and Fischer Reference Hout and Fischer2002; Putnam and Campbell Reference Putnam and Campbell2010). If a large part of the reason why the religiously unaffiliated have no such affiliation is their aversion to religion's involvement in politics, then providing cues about the policy positions of evangelical and other religious leaders may push them significantly in the opposite direction.
The negative reaction to position-taking by religious leaders and evangelical leaders may extend beyond non-religious people to also typify Democratic and liberal identifiers. As the religion gap between the two parties has grown, Americans have come to associate not only evangelical Christians, but also religious people in general, with the Republican Party and political conservatism (Bolce and De Maio Reference Bolce, De Maio and Wilson2007; Reference Bolce and De Maio2008; McDermott Reference McDermott2009; Campbell, Green, and Layman Reference Campbell, Green and Layman2011). Telling Democrats and liberals where religious and evangelical leaders stand on policy matters may remind them of where Republicans and conservatives stand and push them in the opposite direction.
Fourth, the growing political importance of religious commitment has created not only new divisions within faith traditions, but also new partnerships across traditions. A key example is the alliance of evangelicals and Catholics on abortion and other cultural issues and its role in reducing the historic tensions between members of the two groups, and especially evangelical anti-Catholicism (Wilcox and Larson Reference Wilcox and Larson2010). Robinson (Reference Robinson2010), in fact, shows that evangelicals now view Catholics as fellow travelers, responding to cues from Catholic leaders as if they were part of the evangelical in-group. Thus, when we present committed Catholics and especially committed evangelicals with the evangelical-Catholic policy cues, their response may be one of ambivalence, reacting as if they were receiving cross-cutting cues from different sets of in-group leaders rather than information about the political location of in-groups and out-groups. Thus, our cues may produce particularly limited effects among committed religious adherents.
Finally, political sophistication should operate as a significant moderator of any effects we uncover. On the one hand, previous work has shown that political sophisticates, with their greater store of contextual knowledge, are better able to understand the political implications of source cues and change their policy positions accordingly (Kuklinski and Quirk Reference Kuklinski, Quirk, Lupia, McCubbins and Popkin2000; Zaller Reference Zaller1992). At the same time, however, low-information citizens have been shown to utilize group-centered heuristics to a significant degree when such information is in hand (Lupia Reference Lupia1994; Popkin Reference Popkin1991; Sniderman, Brody, and Tetlock Reference Sniderman, Brody and Tetlock1991). The concern, of course, is that low-information citizens lack the extra stores of information necessary to counter new information once exposed to it (Delli Carpini and Keeter Reference Delli Carpini and Keeter1996). Although these literatures can seem to contradict one another, our experimental approach remedies much of the contradiction by providing all treatment respondents the same cueing information within each policy area.
Hypotheses
This discussion points to three sets of testable hypotheses. First, the effects of cues providing individuals with information about the positions of religious and non-religious leaders or evangelical and Catholic leaders should be conditioned by religious tradition and religious commitment, party identification, and ideological identification.
Some of these conditional effects may be positive, with, for example, committed evangelical Protestants, Republicans, and conservatives being drawn toward the positions associated with evangelical Christian leaders. However, the effects for committed religious adherents may be limited due to their heightened awareness of the policy preferences of religious leaders and groups. Thus, the strongest of the effects should be negative reactions to position-taking by religious leaders and especially evangelical leaders. These reactions should lead non-religious people, Democrats, and liberal identifiers to take more liberal policy positions.
Second, religious group cues should have more influence on attitudes on issues for which religion and religion-based conflict have been most relevant. Their effects should be stronger for racial and cultural issues than for social welfare issues, and strongest for cultural attitudes. Third, the influence of religious group cues on policy preferences should be stronger for individuals with lower levels of political knowledge and sophistication than for individuals with higher levels.
EXPERIMENT AND ANALYSIS
To test these hypotheses, we included a survey experiment within two modules of the 2006 Cooperative Congressional Election Study (CCES).Footnote 2 In the experiment, we asked respondents about issues representing the major policy dimensions that have divided and structured the two major parties’ coalitions over the past century. The literature identifies three such policy domains: the issues of social welfare and economic redistribution that have been a source of party conflict since the 1930s; the racial and civil rights issues that spurred partisan change in the 1960s; and the cultural and moral issues on which the two parties have grown more distinct since the 1980s (Carmines and Stimson Reference Carmines and Stimson1989; Layman and Carsey Reference Layman and Carsey2002). To capture attitudes toward these policy areas, we asked respondents about government-sponsored health care coverage, government promotion of the economic and social conditions of African-Americans, and government protection of homosexuals from job discrimination.
For each issue, we presented respondents with opposing viewpoints and asked them to place themselves between the liberal view (coded 1) and the conservative view (coded 10). For health insurance, the control group question was:
Some people feel there should be a government insurance plan which would cover medical and hospital expenses for those who cannot afford to pay for insurance themselves. Others feel that all medical expenses should be paid by individuals and through private insurance plans like Blue Cross or some other company-paid plans.
For government help for blacks, the question was:
Some people feel that the government in Washington should make every effort to improve the social and economic position of blacks. Others feel that the government should not make any special effort to help blacks because they should help themselves.
Our question about job protection for homosexuals was:
Some people feel that the government in Washington should make a special effort to grant homosexuals access to good jobs. Others feel that the government should not make any special effort to grant homosexuals access to good jobs.
Our experiment randomly varied whether or not respondents received a religious group cue on these issues and which cue they received. To capture the contemporary divide between religious and non-religious people, one of our treatments placed “religious leaders” on the conservative side of the three issues and “non-religious leaders” on the liberal side of the issues. In reality, of course, religious leaders often take liberal policy positions while non-religious leaders stake out conservative ground. However, when there are policy differences between religious and non-religious groups, it is usually the religious groups who are on the conservative side. The homosexual job assistance question for respondents receiving this treatment was:
Most non-religious leaders feel that the government in Washington should make a special effort to grant homosexuals access to good jobs. Most religious leaders feel that the government should not make any special effort to grant homosexuals access to good jobs.
To capture the continued political importance of religious tradition, our other treatment placed “evangelical Christian leaders” on the conservative side of the three issues and “Catholic leaders” on the liberal side. On the help for blacks issue, that treatment read:
Most Catholic leaders feel that the government in Washington should make every effort to improve the social and economic position of blacks. Most evangelical Christian leaders feel that the government should not make any special effort to help blacks because they should help themselves.
We included evangelical leaders in this treatment because evangelicalism is the largest and arguably the most politically-polarizing religious tradition in the United States and evangelical clergy tend to take conservative positions across the full spectrum of policy issues (Guth et al. Reference Guth, Green, Smidt, Kellstedt and Poloma1997). We included Catholic leaders because Catholicism is the largest religious denomination in the United States, is a close second to evangelicalism in tradition size, and is quite politically visible itself. Catholicism is not as closely associated with liberalism as evangelicalism is with conservatism, but the Catholic Church does take liberal positions on most social welfare and racial issues. Although it often takes conservative stands on cultural issues, it urges respect and civil rights protection for the individual, including gays and lesbians. Thus, it is plausible that Catholic leaders would be on the liberal side of our homosexual jobs issue.Footnote 3
In our analyses, we assess the effects of religious group cues on policy opinion by regressing positions on the three issues on dummy variables for respondents in our two treatment groups, variables for relevant religious or political groups, and multiplicative interactions between the treatment and group variables.Footnote 4 Rather than focus on the regression coefficients, we concentrate on the substantive effects of the cues by showing the predicted value from the regression model for each religious or political group in each of the experimental groups.Footnote 5 We assess whether the effects of the religious cues are statistically significant by also showing confidence intervals around the predicted values and gauging whether the confidence intervals for the control and treatment groups overlap.Footnote 6
THE IMPACT OF RELIGIOUS GROUP CUES ON CITIZEN POLICY ATTITUDES
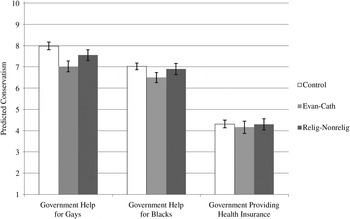
Although we expect the effects of the religious group cues to lie primarily in conditioning the impact of other variables, we begin by assessing their effects on the policy attitudes of all respondents. We estimated those effects by regressing the three policy attitudes on the two treatment variables, and the predicted values and confidence intervals are shown in Figure 1. On government help for homosexuals, both religious group treatments have statistically significant effects, increasing support for aiding homosexuals. The contrast between evangelical and Catholic leaders has the largest effect, moving respondents nearly a full scale point in the liberal direction.Footnote 7 The evangelical-Catholic treatment also has a significant effect on government assistance for blacks, again increasing liberalism. Neither treatment effect is significant on health insurance.
The impact of the religious group treatments on policy attitudes, all respondents (source: 2006 Cooperative Congressional Election Study. Note: The bars are predicted values from regressions of policy attitudes on the religious group treatments. The solid lines represent the 85% confidence interval around the predicted value. Please refer to note 6 for a discussion of our decision to employ an 85% confidence interval).

Thus, as we anticipated, the strongest effects of our religious group treatments are on cultural issues and the weakest are on social welfare issues.Footnote 8 Moreover, in keeping with evangelical and fundamentalist Christians being noticeably less popular than Catholics in the general public (Bolce and De Maio Reference Bolce and De Maio1999a),Footnote 9 pitting evangelical conservatism against Catholic liberalism moves citizens on average toward the liberal position, especially on gay rights, but also on racial policy.
Although the general effects models among all respondents appear strong, they likely obscure how other variables are conditioning the impact of our religious cues on policy preferences among respondents. In order to tease out which intervening variables are the most significant moderators of cueing effects, we next discuss several interactive models with such moderators in mind.
The Conditional Effects of Citizens’ Religious Orientations
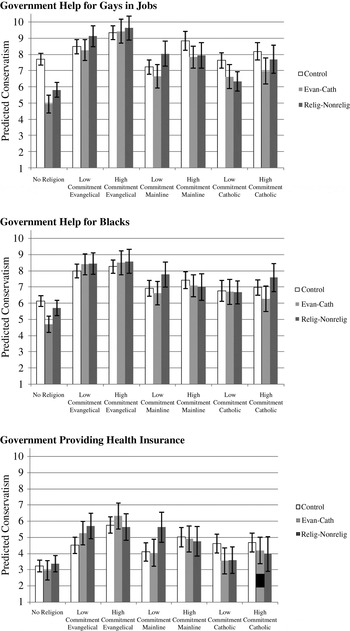
We turn next to assessing how the impact of religious group cues is conditioned by membership in a religious tradition and level of religious commitment. We focus on members of the three largest religious traditions — evangelical Protestants, mainline Protestants, and Catholics — and the increasingly large group of Americans with no religious affiliation.Footnote 10 To capture the effect of religious commitment within religious traditions, we divided each of the three faith traditions into low and high commitment groups.Footnote 11 We included dummy variables for these six resulting groups in our regression models, leaving the religiously unaffiliated as the comparison group. We regressed our three policy attitudes on the six dummies, our two treatment variables and interactions between the tradition-commitment variables, and the treatment variables. In Figure 2, we show the predicted values for members of all seven religious groups in each of our three experimental groups.
The impact of the religious group treatments on policy attitudes by religious tradition and religious commitment (source: 2006 Cooperative Congressional Election Study. Note: The bars are predicted values from regression models with dummy variables for religious groups, the religious group treatments, and their interactions. The solid lines represent the 85% confidence interval around the predicted value. Please refer to note 6 for a discussion of our decision to employ an 85% confidence interval).

As we expected, the effects of the religious group cues are most evident for respondents with no religious affiliation.Footnote 12 In fact, except for the religious-nonreligious treatment prodding Catholics with low levels of religious commitment toward significantly more liberal views on government job assistance for homosexuals, the only statistically significant effects of our treatments are for the unaffiliated. It may be surprising that we do not see more movement among evangelical Protestants, mainline Protestants, or Catholics — especially among the more-committed evangelicals and Catholics, who might be expected to respond favorably to cues from their traditions’ leaders. However, as we noted above, it may be that many devoted adherents already have internalized the norms and perspectives of their traditions, thus limiting the impact of the cues in our experiment.
Meanwhile, the impact of our cues on the cultural and racial policy opinions of non-religious individuals is strong. Both the treatment pitting evangelical leaders against Catholic leaders and the treatment contrasting the views of religious and non-religious leaders have statistically significant effects on homosexual job assistance attitudes. Both treatments push the religiously unaffiliated markedly in the liberal direction, with the evangelical-Catholic cue moving them nearly three scale points and the religious-nonreligious cue moving them two scale points. The evangelical-Catholic treatment also encouraged significantly more liberal attitudes on government assistance for African-Americans among these individuals.Footnote 13 As we hypothesized, the effects of the cues were strongest for views on government help for gays, and were also stronger for that issue and help for blacks than on health insurance.Footnote 14
Importantly, the significant effects of our religious group cues among non-religious people are not accounted for by their political orientations. One explanation for why our cues prompt more-liberal positions among the non-religious is that they are more likely than religious adherents to be Democrats and liberals — groups that may have negative reactions to position-taking by evangelical leaders and religious leaders because they assume that these groups are conservative Republicans. However, when we include controls in our models for party identification, ideological identification, and their interactions with our treatment variables, the negative effects of the religious group cues for non-religious people remain significant.Footnote 15 Thus, most of the reaction of the religiously unaffiliated to our treatments appears to result from the negative views that they hold toward politically-active religious groups, especially evangelicals. While these negative views are well-established in the literature (Bolce and De Maio Reference Bolce and De Maio1999a; Reference Bolce and De Maio2008), it is worth remembering that our cue pits evangelical leaders not against secular or non-religious leaders, but against leaders of the Catholic Church, a relatively unpopular institution among the non-religious.Footnote 16 That our cues still spurred non-religious respondents toward significantly more liberal issue positions speaks to the power of evangelicals as a negative referent for such people.
The Conditional Effects of Political Identifications
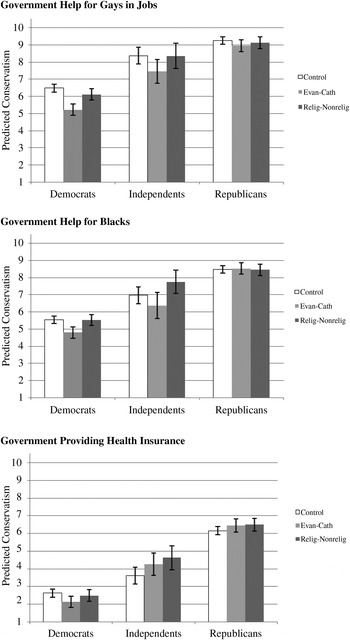
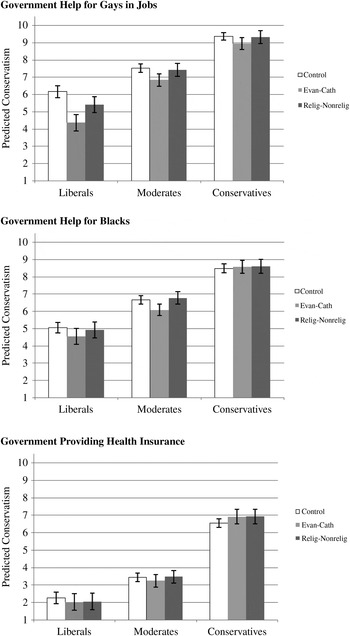
To assess whether the effects of our religious group cues on policy attitudes are conditioned by party identification and ideological identification, we estimated separate regression models for partisanship and ideology. In the party identification models, the independent variables were dummy variables for independent and Republican identifiers, dummy variables for our treatment groups, and interactions between the partisan dummies and the treatment dummies.Footnote 17 In the ideology models, the independent variables were dummy variables for moderate and conservative identifiers, our treatment variables, and interactions between the ideological group variables and the treatments. In Figures 3 and 4, we show the predicted values for members of each of the partisan and ideological groups in each of our three experimental groups.
The impact of the religious group treatments on policy attitudes by party identification (Source: 2006 Cooperative Congressional Election Study. Note: The bars are predicted values from regression models with dummy variables for partisan groups, the religious group treatments, and their interactions. The solid lines represent the 85% confidence interval around the predicted value. Please refer to note 6 for a discussion of our decision to employ an 85% confidence interval).

The impact of the religious group treatments on policy attitudes by ideological identification (source: 2006 Cooperative Congressional Election Study. Note: The bars are predicted values from regression models with dummy variables for ideological groups, the religious group treatments, and their interactions. The solid lines represent the 85% confidence interval around the predicted value. Please refer to note 6 for a discussion of our decision to employ an 85% confidence interval).

In keeping with other evidence that Democratic identifiers tend to associate evangelicals with the Republican Party and have negative feelings about them (Campbell, Green, and Layman Reference Campbell, Green and Layman2011; Bolce and De Maio Reference Bolce and De Maio1999b), the cue contrasting the positions of evangelical and Catholic leaders prompted Democrats to take significantly more liberal positions on government job assistance for homosexuals and on government help for blacks. The effect of this cue even comes close to statistical significance (p = 0.10 in the regression model) for Democrats’ attitudes on government providing health insurance.Footnote 18 On all three issues, the treatment moves Democratic identifiers at least one-half of a scale point in the liberal direction. Of course, it is possible that Democrats are responding positively to Catholic leaders rather than negatively to evangelicals. However, given the growing Republican loyalties of Catholics and the growing perception among citizens that Catholic political leaders are Republicans (McDermott Reference McDermott2007), Democratic antipathy toward politicized evangelicalism seems a more likely explanation for these effects.
The evangelical-Catholic cue has a nearly-significant effect (p < 0.10 in the regression model) on the gay rights views of independents, also spurring them toward more liberal positions.Footnote 19 As past research indicates (Hout and Fischer Reference Hout and Fischer2002; Bolce and De Maio Reference Bolce and De Maio1999b), political independents seem to share Democrats’ negative reactions to evangelical political involvement on cultural issues. However, this cue's effect does not approach significance for independents’ views on aid to blacks or health insurance or Republicans’ opinions on any of the issues.
The cue contrasting the views of religious leaders and non-religious leaders does not have significant effects on policy attitudes for any of the partisan groups.Footnote 20 This may reflect the lower salience of the opposing groups in this cue as compared to evangelicals and Catholics as well as citizens associating evangelical Christians more closely than religious people with the Republican Party.
The results for the ideological groups, in Figure 4, are very similar to the partisan groups. The major effect is that the cue pitting evangelicals against Catholics moves the views of self-identified liberals on job assistance for homosexuals in a more liberal direction. This shift is quite large, increasing liberals’ support for government job assistance for homosexuals by nearly two full scale points.
There are other treatment effects. Moderates shift to a significantly more liberal position on help for homosexuals in response to the evangelical-Catholic cue. The religious-nonreligious cue has a nearly significant (p < 0.06) effect on liberals’ views on the homosexual jobs issue. The evangelical-Catholic cue has liberalizing effects on the attitudes of both liberals and moderates on government help for African-Americans, and those effects approach statistical significance. However, the strongest effects of the cues are for cultural attitudes,Footnote 21 and they appear to stem from liberals’ negative reactions to evangelicals.Footnote 22
The major effects shown in Figures 3 and 4 remain even when we control for ideology (in the party identification model), partisanship (in the ideology model), respondents’ religious orientations (in both models), and their conditional effects on the impact of our treatments. So, the reason why the evangelical-Catholic cue spurs Democrats to greater cultural and racial liberalism is not primarily that they tend to be liberals and be religiously unaffiliated or have low levels of religious commitment. There is something about Democratic identification itself that leads people in a liberal direction in response to this cue.Footnote 23 And, the reason why liberal identifiers grow more supportive of homosexual job assistance is not principally that they tend to be Democrats and are less likely than moderates or conservatives to be religiously devout or have a religious affiliation. Liberal identification itself prompts people to move away from the cultural positions of evangelical leaders.Footnote 24
The Conditional Effects of Political Awareness
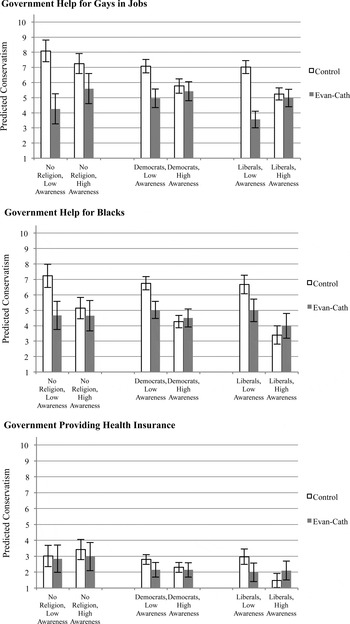
To assess whether the impact of religious group cues on policy attitudes is conditioned by political awareness, we examined the interaction between political awareness and the treatment pitting evangelical against Catholic leaders on the policy attitudes of people with no religious affiliation, Democrats, and liberals. We focus on the evangelical-Catholic treatment because it generally had larger effects than the religious vs. non-religious treatment in our analyses for all respondents. We focus on the unaffiliated, Democrats, and liberals because the main way in which the evangelical-Catholic treatment influenced policy attitudes was by pushing these groups toward more liberal positions.
Our measure of political awareness combines political knowledge and education. The 2006 CCES contained eight knowledge questions, asking respondents to identify the party affiliations of their two U.S. Senators, their House member, and their Governor; whether or not they had heard of the two House candidates running in their district; and to name the majority party in both houses of Congress.Footnote 25 Because the number of knowledge items was limited and knowledge was skewed toward the high end, we combined the number of respondents’ correct answers to the knowledge questions with education level.Footnote 26
We then regressed our policy attitudes on awareness, the evangelical-Catholic treatment dummy (now coded zero only for control group respondents), and their interaction for non-religious people, Democrats, and liberals. In Figure 5, we show the predicted values from these regressions for low awareness and high awareness members of each of the three groups on each of our three policy issues.Footnote 27
Predicted policy attitudes of religiously unaffiliated people, democrats, and liberals by political awareness and the evangelical-catholic treatment (source: 2006 Cooperative Congressional Election Study. Note: The bars are predicted values from regression models with the treatment variables, political awareness, and their interactions. The solid lines represent the 85% confidence interval around the predicted value. Please refer to note 6 for a discussion of our decision to employ an 85% confidence interval).

The patterns are clear and consistent. On homosexual job assistance and help for African-Americans, the effects of the evangelical-Catholic cue are large and statistically significant for respondents with low political awareness. Information about the policy positions of evangelical and Catholic leaders markedly increases the support of the low awareness non-religious people, Democrats, and liberals on both issues. In contrast, the treatment effect is never statistically significant for high awareness members of the three groups. The treatment groups do show more liberal positions than the control groups on homosexual job assistance, but those differences are not significant, and there is not much hint of a treatment effect for political sophisticates on help for blacks. The treatment effects are again much less evident on government providing health insurance.
In sum, religious group cues, like other social group cues, serve as particularly useful heuristics for citizens with low levels of political awareness. Such cues tell citizens where groups they like and dislike stand, and this information helps the politically inattentive make sense of issues and change their own policy positions accordingly. In this case, the effectiveness of the cues seems to stem from the strongly negative reactions that the non-religious, Democrats and liberals have to religious leaders, but especially evangelical leaders.
CONCLUSION
We considered the impact of religious group cues on American policy attitudes by examining the effect of two cues — one pitting religious leaders against non-religious leaders and one contrasting the positions of evangelical leaders and Catholic leaders — on attitudes toward government protection of homosexual rights, government help for African-Americans, and government providing health insurance. Our evidence suggests that the influence of religious group cues on policy attitudes may be fairly deep, but is not very broad. Where our cues mattered, they mattered a good deal — moving policy preferences in substantively and statistically significant ways. Importantly, however, the religious cues mattered only in limited contexts. While we uncovered general effects among all respondents in two of three policy domains, these results obscure the extent that our religious group cues conditioned position-taking by respondents based on other moderating variables. For the most part, they influenced the religiously unaffiliated, Democrats, and liberals. They influenced their views primarily on cultural issues and, to a lesser extent, racial issues, but not on social welfare issues. They mattered only for the politically unaware.
The effects of this experiment and the limitations of the uncovered effects illustrate at least two important things about contemporary religion and politics. First, and most importantly, they point to the powerful role that antipathy toward politically-active evangelical Christians can play in politics. It often is assumed that the “culture wars” in contemporary American politics are asymmetrical, with those on the conservative side feeling more engaged, more aggrieved, and more threatened by their cultural opponents than those on the progressive side (Campbell Reference Campbell2006; Layman Reference Layman, Wolfe and Katznelson2010). Perhaps such antipathy is why our religious group cues have little or no impact for committed evangelicals, Republicans, or conservatives. Perhaps they already have fully adjusted their policy positions in response to the positions of religious in-groups and out-groups.
However, the antipathy that those on the opposite side of the religious, cultural, and political spectrum feel toward evangelical Christians and the power of that antipathy should not be understated. Bolce and De Maio (Reference Bolce and De Maio1999a; Reference Bolce and De Maio1999b; Reference Bolce, De Maio and Wilson2007; Reference Bolce and De Maio2008) have convincingly demonstrated the presence and political importance of “anti-fundamentalism.” We have uncovered a new manifestation of its importance: evangelicals serve as a negative political referent in shaping the policy attitudes of liberals, Democrats, and the religiously unaffiliated. We also have found particularly strong evidence of the power of such a negative reference: these groups move their policy positions away from those of evangelicals even when it means moving them closer to the Catholic Church, an institution that is hardly beloved by the political and cultural left.
Second, the immunity of committed religious adherents to our experimental treatments suggests that religious group cues in general may have a limited impact on the policy opinions of religious devotees. People with high levels of religious commitment experience regular exposure to and reinforcement of the values, norms, and political positions of their faith tradition and its leaders. Thus, there may be little that being reminded of those things or the positions of cultural and political opponents can do to shape the policy opinions of such people. The primary effect of religious group cues for committed adherents may not be to shape their policy positions, but to spur them to connect those positions to voting decisions and political activity.
Our findings also raise important questions about the impact of social group cues more generally. One of those questions is about how effective group cues can be for the least-informed citizens. Our finding that religious group cues are most consequential for the policy attitudes of politically unaware individuals corresponds to the idea of group-centered heuristics as a way for low-information citizens to make sensible political judgments (Popkin Reference Popkin1991; Sniderman, Brody, and Tetlock Reference Sniderman, Brody and Tetlock1991), and also to other studies finding that social and political cues have more influence on the preferences of less-sophisticated people than on those of political sophisticates (Lupia Reference Lupia1994; Boudreau Reference Boudreau2009; Arceneaux and Kolodny Reference Arceneaux and Kolodny2009). However, our results seemingly run counter to work suggesting that more-sophisticated citizens make more effective use of group-based heuristics because they are aware of the political relevance of the group and possess the contextual information to understand the political implications of a group's policy stands (Kuklinski and Quirk Reference Kuklinski, Quirk, Lupia, McCubbins and Popkin2000; Lau and Redlawsk Reference Lau and Redlawsk2001). Converse, for example, contends that group evaluations will structure policy preferences only when citizens possess “some interstitial ‘linking’ information indicating why a given party or policy is relevant to the group” (Converse Reference Converse and Apter1964, 237) and political sophisticates are more likely to have such information.
In fact, our results support such arguments. Citizens do need information about the policy positions of groups and the relevance of those positions for their feelings about the group to shape their policy opinions. That information, however, is provided by our religious group cues. The cues tell them where groups stand on issues, provide them with some explanation of why the groups take those stands, and signify the implications of their positions by juxtaposing them with those of presumed competitors. To some extent, the cues provide the information necessary for less-aware citizens to attach their religious group evaluations to policy opinions, and have more impact for these individuals than for more-sophisticated citizens who already have employed the relevant information to construct more-stable policy preferences. Thus, our results dovetail with those of Arceneaux and Kolodny (Reference Arceneaux and Kolodny2009), who find that group cues are effective for politically unaware citizens when they are given contextual information that helps them understand the political implications of the groups’ positions.
While it might be argued that our experimental setting is too contrived for the findings to be generalizable to real world settings, we counter that our treatments in fact replicate what takes place in today's political arena more often than not. With modern issue and electoral campaigns devoting significant resources to direct voter contact — through direct mail and other approaches — instead of relying on mediated messaging through more traditional means (Hillygus and Shields Reference Hillygus and Shields2007), the persuasive techniques employed in our religious group cueing treatments is precisely how many less aware citizens come to hear and know about politics.
Finally, it is worth noting some of the limitations of our religious group treatments and how those limitations might be overcome in future work. One potential problem with our treatments is that the religious-nonreligious cue may confront respondents with groups that are too amorphous to serve as effective opinion referents. “Religious leaders” might encompass the full spectrum of American faith and “non-religious leaders” could include everyone from proponents of atheism to political elites who represent organizations other than religious groups. In order to more effectively capture the religiosity gap in contemporary politics, future work might invoke groups that more clearly are on opposite sides of that gap — for example, groups advocating larger and smaller roles for religion in the public square.
A second difficulty is that the evangelical-Catholic cue contrasts the positions of groups that increasingly are political allies rather than opponents, thus potentially presenting respondents with two in-group cues or two out-group cues. To more effectively assess the impact of cues based on religious tradition, future work might contrast leaders of traditions that are more often engaged in conflict — perhaps evangelical and mainline Protestant leaders or evangelical and either Jewish or Muslim leaders. Finally, our cues may not capture the reality of how citizens experience position-taking by religious groups. That reality may be characterized more by a particular group taking a position on an issue and being challenged by a variety of non-religious groups and lay organizations, rather than by the leaders of another religious tradition or group. Future work might capture that reality with one-sided cues, simply contrasting the positions of a religious group with those of other participants in political discourse.
Supplementary materials and methods
The supplementary material refered to in this paper can be found online at journals.cambridge.org/rap.