Introduction
The breeding objective for many European Warmblood breeding associations is to produce sport horses internationally competitive in both dressage and show jumping, whereas some societies are specialising in either of the two disciplines (Koenen et al., Reference Koenen, Aldridge and Philipsson2004). As competition results at advanced levels, especially in dressage, are achieved late in a sport horse’s life, and as the heritabilities for competition traits generally are low (Ricard et al., Reference Ricard, Bruns and Cunningham2000), indirect selection from results of specially designed performance tests of young horses is often practiced when the association aims at production of horses for both disciplines. The young horses are evaluated at field performance tests and/or young horse competitions (Thorén Hellsten et al., Reference Thorén Hellsten, Viklund, Koenen, Ricard, Bruns and Philipsson2006). Traits judged at field performance test usually include gaits, jumping ability, rideability and sometimes also conformation. In the review by Thorén Hellsten et al. (Reference Thorén Hellsten, Viklund, Koenen, Ricard, Bruns and Philipsson2006), a comparison of genetic parameters for various tests of young horses was presented in order to assess their efficiency in selection for dressage and show jumping. The conclusions were that the parameters for major horse populations were in good agreement, and that specially designed young horse performance tests showed moderate to high heritabilities and highly positive genetic correlations with later competition results. The authors recommended extensive field testing of young horses of both sexes.
Swedish Warmblood horses are bred for both dressage and show jumping, and horses can participate in Young Horse Tests (YHT) at the ages of 3 and 4 years. The Riding Horse Quality Test (RHQT) for 4-year-old riding horses was introduced in 1973, and annually about one-third of all 4-year-old riding horses participate in the test. Also, 5-year-old Swedish Warmblood mares that have foaled as a 4-year-old may participate. The aims of this 1-day field test are to provide information for genetic evaluations of stallions and mares, and to evaluate the overall quality of young sport horses, especially their talents for dressage and show jumping. Conformation, gaits under rider, jumping and health status are evaluated. Parts of RHQT data have previously been analysed by Árnason (Reference Árnason1987), Gerber Olsson et al. (Reference Gerber Olsson, Árnason, Näsholm and Philipsson2000) and Wallin et al. (Reference Wallin, Strandberg and Philipsson2003). During the 30 years of testing, the horse population has changed. In addition, changes in judging of several traits may have occurred. Genetic analyses of the RHQT data have shown a substantial increase in the rate of genetic progress, coinciding well with the effects of intensified selection of stallions in the beginning of the 1980s (Viklund et al., 2005). Also, the influence of foreign horse populations has increased from the middle of the 1990s. Approximately 80% of the Swedish Warmblood broodmares are covered by stallions born in other countries. The recorded traits have officially been the same throughout the whole period, but it has been unclear whether the evaluation/scoring of the traits have changed over the years and whether this had an effect on the genetic parameters.
In 1999, a YHT for 3-year olds was introduced, taking place in early spring before the start of the breeding season. This test replaced the traditional conformation summer shows, which no longer corresponded to the demands of the market, nor was it a suitable tool in the breeding of modern sport horses as it was only a show of mares at hand and did not include jumping. The aims of the YHT, which is open to both sexes, are to provide an opportunity for earlier genetic evaluations of stallions and mares than the RHQT, early selection of mares, to find talented horses for competition in dressage and jumping and to encourage early handling of young horses. Conformation, gaits at hand and free, and free jumping are scored. Riding presentation of the horse is encouraged, but not mandatory. About 40% (~1000 horses) of all 3-year olds are tested annually.
For many years, the prediction of breeding values of Swedish riding horses has been based on results from RHQT (Árnason, Reference Árnason1987), as these were assumed to indirectly reflect the breeding goal of Swedish Warmblood as sport horses (Darenius et al., Reference Darenius, Philipsson, Fredricson, Thafvelin, Bergsten, Rådberg and Elowson-Anda1982). Inclusion of results from YHT in the genetic evaluations would provide an enhanced opportunity for early genetic evaluations of stallions and mares. Therefore, it is of great interest to investigate the relationships between results from YHT and RHQT.
The aims of the present study were to estimate genetic parameters for results from different time periods of RHQT, and to estimate heritabilities for and genetic correlations between traits scored in YHT and RHQT.
Material and methods
Young Horse Test data
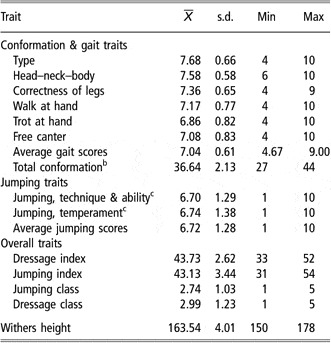
A dataset comprising 4110 horses evaluated as 3-year olds (566 stallions, 1218 geldings and 2326 mares) during 1999 to 2003 was analysed. Horses were judged jointly by teams of two persons – one expert judge for conformation and gaits and one expert judge for jumping. The tests were carried out at 18 to 24 places each year. Conformation evaluations included six subtraits: type, head–neck–body, correctness of legs, walk at hand, trot at hand and free canter. In free jumping, the horses got one score for technique and jumping ability and another for temperament. All traits were scored between 1 (very poor) and 10 (excellent). To classify the horses as dressage and jumping talents, two simple phenotypic indexes were regularly calculated by the organizers of the tests, with the dressage index being the sum of the six conformation subtraits (including movements), and the jumping index being the sum of the scores for four of the conformation subtraits (type, head–neck–body, correctness of legs, canter) and the two jumping scores. The horses were divided into five classes according to these indexes, where a Diploma was the highest class (approximately 15% of the horses), followed by class I to IV, where IV was the lowest class. For the analyses, the classes were numbered from 1 to 5, where 1 was the highest class (Diploma). Means and standard deviations (s.d.) for the different traits scored in YHT are given in Table 1.
Means ( ), standard deviations (s.d.), minimum (Min) and maximum (Max) values for traits evaluated in 3-year-old Swedish Warmblood horses in Young Horse Test (YHT) from 1999 to 2003Footnote a

a Number of horses were 4110 except for withers height where n = 4004.
b The sum of type, head–neck–body, correctness of legs, walk at hand and trot at hand.
c Free jumping.
Riding Horse Quality Test data
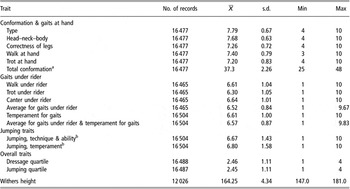
Results from 16 504 horses (729 stallions, 8313 geldings and 7462 mares) that had participated in RHQT during the period from 1973 to 2003 were available. The majority of the horses were 4 years old, but 726 five-year-old mares that had foaled as 4-year olds were also included. The number of test places per year varied between 1 (the first 3 years) and 20 (in 1995). During the last 10 years, the test has been carried out at about 18 places annually. Horses were judged independently by four different teams (conformation, gaits under rider, jumping and health). Conformation evaluations included five subtraits: type, head–neck–body, correctness of legs, walk and trot at hand. A total conformation score was calculated as the sum of the five subtraits. Individual gaits were also judged under the rider. The score for jumping consisted of either free jumping or jumping under the rider or an average of both whenever both were registered (changes had been made over the 30-year period of recording). At the evaluations of gaits and jumping the horses received a temperament score. All traits were scored between 1 (very poor) and 10 (excellent). Two total scores, for jumping and dressage, were regularly calculated and the horses were classified based on these scores. Class I included the 25% highest scoring (quartile I) horses at each testing place, and Class II the next 25% highest scoring (quartile II) horses, and so on. This classification was done to avoid the effects of different scoring levels between events. The health examination was not considered in this study. Means and s.d. for the different traits scored in RHQT during the period 1973 to 2003 are given in Table 2.
Means ( ), standard deviations (s.d.), minimum (Min) and maximum (Max) values for traits evaluated in 4- and 5-year-old Swedish Warmblood horses in Riding Horse Quality Test (RHQT) 1973 to 2003

aThe sum of type, head–neck–body, correctness of legs, walk at hand and trot at hand.
bA mix of free jumping and jumping under rider.
Division of Riding Horse Quality Test data into shorter time periods
To investigate whether the evaluation of traits at RHQT had changed over the 30-year-long period of testing, the data were divided into shorter time periods. The choice of time periods was based on important breaking points in Swedish Warmblood history, and the desire to have a reasonably equal number of horses in each group. The first period included 4238 horses judged between 1973 and 1987, the second period included 6477 horses judged between 1988 and 1995, and the last period included 5789 horses judged between 1996 and 2003. Until 1987, the genetic progress, measured by the trends in the BLUP-index of tested horses, was quite modest. After that, the annual progress has been substantial for all traits (Viklund et al., 2005). The second breaking point was based on the influence of foreign horse populations, which began to increase markedly in the middle of the 1990s. Each horse was only represented in one period since the horses can only participate in RHQT once. The horses were sired by stallions that had offspring in different periods. There were 70 stallions that had offspring in all three periods, ensuring connectedness across the periods, 182 stallions had offspring in two periods and 498 stallions had offspring in only one period. In Table 3 the numbers of stallions with RHQT offspring in each time period are presented.
Number of sires and number of offspring judged in Riding Horse Quality Test (RHQT) in different time periods (P1, P2, P3)Footnote a

a Period 1: 1973 to 1987, Period 2: 1988 to 1995, Period 3: 1996 to 2003.
b Each sire is only represented once.
c Offspring with results in RHQT. Of the judged horses, 131 had no information of sire and were not included.
Young Horse Test and Riding Horse Quality Test data
To estimate the genetic correlations between traits tested at YHT and RHQT, only the two last periods (1988 to 2003) of RHQT data were used, together with the entire YHT data. The first period, as defined above, was excluded as it is least representative of the present population of horses. The dataset included 15 451 horses (7960 males and 7491 mares), of which 925 horses (454 males and 471 mares) had participated in both tests.
Statistical analysis
Analysis of variance
An analysis of variance was performed using the GLM procedure of SAS (Statistical Analysis Systems Institute, 2007). The effects of event (place/year), sex and age were tested. The effect of rider was not tested since the rider and the horse were confounded as most riders had only shown one horse. The analyses showed that the effect of event was highly significant for all traits (P < 0.001), except for dressage and jumping quartiles at RHQT, which were calculated within event. The effect of sex was significant for all traits (P < 0.001 to P < 0.05), except for walk at hand in RHQT. For RHQT traits, the effect of age had a significant effect (P < 0.001 to P < 0.05) on correctness of legs, total conformation, canter under rider, dressage quartile and withers height.
The coefficients of determination (R 2) for the analyses of variance of traits in RHQT showed that generally 9% to 17% of the variation could be ascribed to the model including all tested fixed effects. Corresponding values for YHT data were 5% to 9%. The effect of event had the greatest influence for all traits. The highest R 2 values for the effect of sex were as expected for withers height. The R 2 values for the effect of age at RHQT were very low, 0% to 0.3%, with the highest values for withers height and dressage quartile.
Estimation of genetic parameters
In accordance with results from the analyses of variance, the following animal model was used for traits tested in YHT (Model I):

where yijk is the score of each trait for the kth horse, μ is the population mean, eventi is the fixed effect of the ith combination of place and year of test (i = 1,…, 109), sexj is the fixed effect of the jth sex (j = stallion, gelding, mare), animalk is the random effect of the kth horse ~ND(0, Aσ2a) and eijk is the random ~IND(0, σ2e) residual effect.
For traits tested in RHQT, the same animal model, with the addition of the fixed effect of age, was used (Model II). In this case, the fixed effect of event comprised 387 classes, and the fixed effect of age comprised two classes (4 and 5 years).
The models included the additive relationship matrix (A) with sire and dam information. The pedigree of each horse with an observation was traced back to seven generations. In total, the pedigree file comprised 36 641 individuals for RHQT analyses, 19 155 for YHT analyses and 42 821 for the joint analyses of the RHQT and the YHT datasets. Genetic parameters and their standard errors (s.e.) were estimated by using the average information algorithm (Jensen et al., Reference Jensen, Mäntysaari, Madsen and Thompson1997) for restricted maximum likelihood included in the DMU package (Jensen and Madsen, Reference Jensen and Madsen1994; Madsen and Jensen, 2000).
When dividing the RHQT material into three time periods, observations for each time period were analysed as different traits in trivariate analyses, where the residual covariances were set to zero. Heritabilities and correlations within the test were estimated from bivariate analyses. Correlations between traits in RHQT and YHT were estimated from bivariate analyses. All animals with observations for at least one of the traits were included in the bivariate analyses.
Results and discussion
Means and standard deviations
For conformation traits, the mean scores were slightly higher, and the s.d. were lower, than for jumping traits and gaits under the rider (Tables 1 and 2). No horse had received a score less than 3 for conformation and gaits at hand. For these traits, a score below 5 indicates that the horse is severely incorrect in its conformation and/or movements. For jumping traits and gaits under the rider, the whole scale had been used. This had been done to a much larger extent for jumping traits, which showed about 50% larger s.d. than the gait scores. Again, a gait score of less than 5 means that the gait shows some irregularities.
Effects of event, sex and age
In both sets of data, the fixed effect of event was shown to have the greatest importance, as previously also found by Árnason (Reference Árnason1987). Despite that the judges should have had equivalent training and that the arrangement regulations for the organizers have been detailed, the judgement of the horses may not have been the same throughout the country and over time. This problem has been noticed earlier and courses for judges have been given throughout the whole period at annual or biennial occasions in order to harmonize the evaluations. Differences in means of scores between events may also have been due to a number of other environmental factors such as indoor or outdoor arena, surface of the arena, weather conditions, etc. The possible differences between events explain why the classification system in RHQT has been based on quartiles within each event instead of actual scoring points.
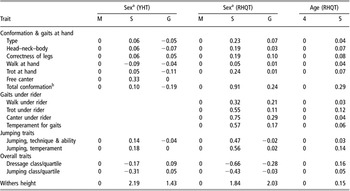
Results for effects of sex in the genetic analyses of RHQT data (1973 to 2003) showed that stallions received better scores than geldings and mares (Table 4). For YHT data, the sex differences were not as large as for RHQT data but stallions scored higher than mares except for the trait walk at hand. As for RHQT data, the largest difference between stallions and mares was found for the trait canter. A possible explanation for the larger sex differences in RHQT may be that at 4 years of age, only the most promising stallions are still kept as stallions; in RHQT, only 4.4% of the judged horses were stallions, compared to 13.8% in YHT. The 4-year-old stallions are probably both more talented and better trained than the average mare or gelding. Regarding withers height, males were on average 1.8 to 2.0 cm taller than the mares. The differences between stallions and geldings were in general small and inconsistent.
Solutions for the fixed effects of sex and age estimated in genetic analyses of traits evaluated at Young Horse Test (YHT) from 1999 to 2003 and Riding Horse Quality Test (RHQT) 1973 to 2003

aM = mare; S = stallion; G = gelding.
bThe sum of type, head−neck–body, correctness of legs, walk at hand and trot at hand.
The effect of age had a small impact on test results in RHQT, with the 5-year-old broodmares scoring only slightly higher than the 4-year-old horses, probably due to a somewhat longer training period and maturation of the horse. However, the rather small difference can be explained by the fact that the 5-year olds had a foal the previous year, so they had a training state not much different from that of the younger horses not used for breeding.
Analyses of RQHT data in different time periods
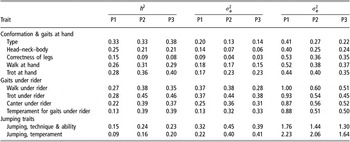
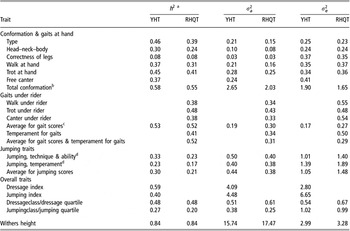
In Table 5, the heritabilities and variances for conformation, dressage and jumping traits judged during different time periods in RHQT are presented. All heritabilities were moderately high except for correctness of legs and temperament for jumping. For sport traits, gaits judged under rider and jumping traits, considerably higher heritabilities were estimated for the last two periods, which implies that these periods are of most interest. Conformation traits did not follow the same pattern as sport traits, and the heritabilities were approximately in the same range for all periods. The residual variances were consistently lower in the two later periods for all traits, whereas the additive genetic variances were larger in these periods for some traits, especially jumping traits. One explanation might be that judging in the first period was not as harmonized as in later periods. An explanation for the larger genetic variance in the later periods may be the importation of superior jumping stallions to be included in the Swedish Warmblood breeding. The heritabilities in the first period were slightly lower, and heritabilities in the second period were slightly higher than earlier estimates presented by Gerber Olsson et al. (Reference Gerber Olsson, Árnason, Näsholm and Philipsson2000). A reasonable explanation could be that the earlier study was based on data including results from 1983 to 1993, hence overlapping time periods one and two in this study.
Heritabilities (h 2) and additive genetic ( ) and residual (
 ) variances for conformation, dressage and jumping traits judged during three different time periods (P1, P2, P3)Footnote a in Riding Horse Quality Test (RHQT)

a Period 1: 1973 to 1987, Period 2: 1988 to 1995, Period 3: 1996 to 2003.
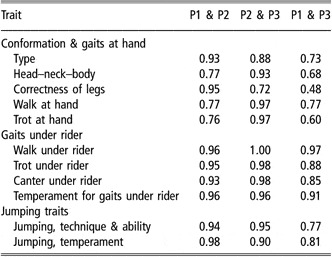
For conformation traits, genetic correlations between the first and last period were 0.48 to 0.77 compared to 0.72 to 0.97 between the last two periods (Table 6). Thus, the first period would be less informative for use in the present genetic evaluation. In the early period, the judges were probably relatively conservative and used to the old cavalry type of horses. During the later periods, however, more of the judges had experience from the equestrian sports, and consequently they were favouring a modern sport horse type. For sport traits, the correlations between different time periods were higher than for conformation traits, 0.77 to 0.97 between the first and last periods, and 0.90 to 1.00 between the last two ones. Apparently, the judgement of traits was not the same throughout the 30 years of testing. The large number of stallions with offspring in more than one time period supports the conclusion that the judgement of traits has actually changed, and that lack of genetic connectedness was not the reason for correlations deviating from unity. Changes in genetic parameters over time have also been reported for Icelandic horses (Árnason et al., 2006). The reason given was redefinition and standardization of the traits in 1990. In the genetic evaluations for Icelandic horses, the traits were defined as two different traits if they were scored before 1990 or later. The differences in heritabilities and variances between the different time periods in RHQT need to be investigated further as regards their impact on the genetic evaluations. Due to the homogeneity of data from the last two periods, and that these represent the more recent population of horses, the following analyses only considered data from these periods.
Genetic correlations between corresponding traits judged in Riding Horse Quality Test (RHQT) during three time periods (P1, P2, P3)Footnote a

a Period 1: 1973 to 1987, Period 2: 1988 to 1995, Period 3: 1996 to 2003.
Heritabilities and variances for traits in YHT and RHQT
Including traits recorded at YHT in the breeding values makes an earlier genetic evaluation of Swedish riding horses possible. For such a decision, it is important that the results at 3 years of age show reasonably high heritabilities and highly positive genetic correlations with results at older age. Table 7 contains the heritabilities and variances for traits in the YHT and RHQT (1988 to 2003). For both tests the highest heritabilities were estimated for withers height (0.84), type, trot at hand, total conformation, dressage index and class/quartile (0.39 to 0.59). In RHQT, gaits under the rider also showed moderately high heritabilities (0.38 to 0.48). The heritabilities estimated for dressage-related traits in this study are in the same range as in other studies based on data from field performance tests of young horses (Huizinga et al., Reference Huizinga, Boukamp and Smolders1990; Brockmann, 1998; Bösch et al., Reference Bösch, Reinecke, Röhe and Kalm2000; Lührs-Behnke et al., Reference Lührs-Behnke, Röhe and Kalm2006; Ducro et al., Reference Ducro, Koenen, van Tartwijk and Bovenhuis2007; Stock and Distl, Reference Stock and Distl2007). For jumping traits, the current study showed similar (YHT) or somewhat lower (RHQT) heritabilities.
Heritabilities (h 2) and additive genetic ( ) and residual (
 ) variances for traits evaluated in Young Horse Test (YHT) 1999 to 2003 and Riding Horse Quality Test (RHQT) 1988 to 2003

aStandard errors for heritabilities were 0.03 to 0.05 for traits in YHT and 0.01 to 0.03 for traits in RHQT.
bThe sum of type, head–neck–body, correctness of legs, walk at hand and trot at hand.
cGaits (walk, trot and canter) judged at hand and free in YHT and gaits judged under rider in RHQT.
dFree jumping in YHT, and a mix of free jumping and jumping under rider in RHQT.
The heritabilities for traits judged in YHT were slightly higher than the corresponding heritabilities for traits scored in RHQT. Horses judged at YHT are probably less influenced by the training and the rider. This assumption is supported by the fact that the residual variances were higher for traits scored in RHQT.
The ridden tests for gaits revealed a considerably higher genetic variation among horses than the tests at hand, and also larger residual variances possibly reflecting variable qualities of riders (Table 7). Another reason was that for gaits at hand the scale was not fully used by the judges, which it was for the ridden test. However, the resulting heritabilities were only slightly higher.
Jumping traits showed higher genetic and error variances than conformation and gait traits. An important reason is probably the traditional difference in use of scales by the judges representing different disciplines. Furthermore, the horses may have been more influenced by the rider or handler and the environment during the jumping test.
For both YHT and RHQT, correctness of legs was the trait with the lowest heritability (0.08). Other studies confirm that estimates concerning subjective scores of limbs have relatively low heritabilities (Bösch et al., Reference Bösch, Reinecke, Röhe and Kalm2000; Dietl et al., Reference Dietl, Hoffmann and Albrecht2004; Stock and Distl, Reference Stock and Distl2006). However, it is important to breed for correctness of legs. Stock and Distl (Reference Stock and Distl2006) studied genetic correlations between prevalent radiographic findings in the limbs of young Warmblood riding horses and conformation traits judged at studbook inspection. The results indicated that judgement of limbs can be useful for selection against osseous fragments in fetlock and distinct radiographic findings in the navicular bones. Wallin et al. (Reference Wallin, Strandberg and Philipsson2001) showed that variation in the trait correctness of legs in RHQT had a significant effect on longevity. Horses that scored 7 or more had a significantly greater chance of living longer than horses scored 6 or less. Today, a low score can depend on many different, and sometimes opposite, reasons. Division of the trait into several specified subtraits with linear descriptions of various deviations from correctness of the legs may lead to higher heritability estimates.
Genetic correlations within YHT and RHQT
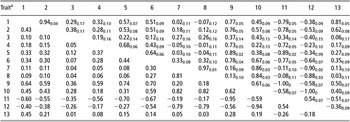
The genetic and phenotypic correlations between traits within test are presented in Tables 8 and 9 (YHT and RHQT, respectively). In general, it could be concluded that similar correlations between traits within type of test were found for both YHT and RHQT. For conformation traits the genetic correlations were moderately to highly positive with low s.e., except for correlations with correctness of legs that had rather high s.e. The highest correlation was between type and head–neck–body. Type was also strongly correlated with withers height.
Genetic correlations with their standard errors (above the diagonal; standard errors shown as subscripts) and phenotypic correlations with their standard errors (below the diagonal; standard errors shown as subscripts) for Young Horse Test data (YHT) from 1999 to 2003

a1. Type; 2. Head–neck–body; 3. Correctness of legs; 4. Walk at hand; 5. Trot at hand; 6. Free canter; 7. Jumping, technique and ability; 8. Jumping, temperament; 9. Dressage index; 10. Jumping index; 11. Dressage class; 12. Jumping class; 13. Withers height.
Genetic correlations with their standard errors (above the diagonal; standard errors shown as subscripts) and phenotypic correlations with their standard errors (below the diagonal; standard errors shown as subscripts) for Riding Horse Quality Test data (RHQT) from 1988 to 2003

a1. Type; 2. Head–neck–body; 3. Correctness of legs; 4. Walk at hand; 5. Trot at hand; 6. Total conformation; 7. Walk under rider; 8. Trot under rider; 9. Canter under rider; 10. Temperament for gaits; 11. Jumping, technique and ability; 12. Jumping, temperament; 13. Withers height.
The highly positive genetic correlations between the different gaits (0.43 to 0.68 and 0.58 to 0.75, respectively) showed good agreement with other studies (Huizinga et al., Reference Huizinga, Boukamp and Smolders1990; Schade, 1996; Bösch et al., Reference Bösch, Reinecke, Röhe and Kalm2000; Dietl et al., Reference Dietl, Hoffmann and Reinsch2005; Lührs-Behnke et al., Reference Lührs-Behnke, Röhe and Kalm2006; Ducro et al., Reference Ducro, Koenen, van Tartwijk and Bovenhuis2007). Between the two jumping traits, jumping technique and temperament for jumping, the genetic correlation was 0.97 in both YHT and RHQT. Standard errors for the above-mentioned genetic correlations were all low.
The moderately to highly positive genetic correlations between conformation traits (except for correctness of legs) and gaits (0.28 to 0.57 for YHT and 0.20 to 0.62 for RHQT) agree well with other studies (Christmann, 1996; Bösch et al., Reference Bösch, Reinecke, Röhe and Kalm2000; Ducro et al., Reference Ducro, Koenen, van Tartwijk and Bovenhuis2007).
Between conformation and jumping, the reported genetic correlations differed remarkably between various studies. In this study, as well as in the study presented by Ducro et al. (Reference Ducro, Koenen, van Tartwijk and Bovenhuis2007), correlations between conformation and jumping scores in RHQT were low but positive (0.07 to 0.23). Von Bösch et al. (Reference Bösch, Reinecke, Röhe and Kalm2000) estimated moderately positive genetic correlations between conformation and jumping, whilst Christmann (1996) found slightly negative correlations. For YHT data, the corresponding genetic correlations were low but with high s.e. Langlois et al. (Reference Langlois, Froidevaux, Lamarche, Legault, Legault, Tassencourt and Theret1978) and Holmström and Philipsson (Reference Holmström and Philipsson1993) showed that differences in various measures of conformation had a limited impact on jumping performance.
In the present study, canter was the gait with the closest correlations with jumping traits, 0.33 in YHT and 0.40 in RHQT. The same pattern has been reported by other authors (Huizinga et al., Reference Huizinga, Boukamp and Smolders1990; Schade, 1996; Bösch et al., Reference Bösch, Reinecke, Röhe and Kalm2000; Gerber Olsson et al., Reference Gerber Olsson, Árnason, Näsholm and Philipsson2000; Lührs-Behnke et al., Reference Lührs-Behnke, Röhe and Kalm2006; Ducro et al., Reference Ducro, Koenen, van Tartwijk and Bovenhuis2007). Walk and trot seem not to be genetically related to jumping traits (0.07 to 0.25 for RHQT and −0.05 to 0.03 for YHT). As for YHT data, other authors have found negative or very low correlations between those traits (Schade, 1996; Ducro et al., Reference Ducro, Koenen, van Tartwijk and Bovenhuis2007). Despite low correlations between individual gaits and jumping traits, the correlation between the indexes as talented dressage and jumping horse within YHT was at a moderately positive level (0.61), mainly due to the autocorrelation caused by partly the same conformation traits included in both indexes.
Genetic correlations between traits tested in 3- and 4-year olds
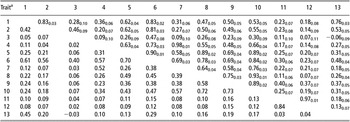
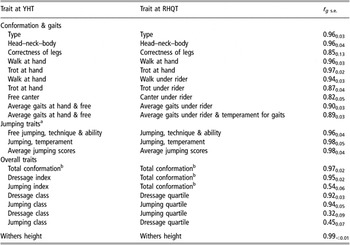
Corresponding traits judged at YHT and RHQT were genetically closely related with low s.e. (Table 10). Even though jumping traits were judged as free jumping at YHT and as a mix of free jumping and jumping under rider at RHQT, the correlations were close to unity. Therefore, it can be assumed that the same gene complex affects the traits in the two different tests, although they are judged differently. Highly positive genetic correlations were also found between gaits judged at hand and free at YHT, and under rider at RHQT (0.82 to 0.94). The horses were not judged under rider at the age of 3, and therefore it was not possible to estimate genetic correlations between gaits under the rider in the different tests. However, the high genetic correlations indicate that it is not necessary to judge 3-year olds under a rider. It is possible that more 3-year olds will participate in YHT if there is no riding obligatory than if they have to be judged under a rider, as many 3-year olds are not yet broken or trained to be judged. Compared to other major sport horse countries in Europe, the northern latitude of Sweden means that horses are usually later developed as 3-year olds. The present set-up of the YHT means that it is technically easier for the owners to show their horses, and they do not need to hire a professional rider. A high participation rate is important as it enables a high selection intensity, and potentially a higher genetic progress, provided that breeders select the best-performing mares for breeding.
Genetic correlations (r g) with their standard errors (shown as subscripts) between traits tested in Young Horse Test (YHT) 1999 to 2003 and Riding Horse Quality Test (RHQT) from 1988 to 2003

aFree jumping in YHT, and a mix of free jumping and jumping under rider in RHQT.
bThe sum of type, head–neck–body, correctness of legs, walk at hand and trot at hand.
The estimated genetic correlation between jumping class/quartile at the two ages was highly positive (0.94). A similar high level was estimated for dressage class/quartile (0.92). This implies that YHT gives a good prediction of the horse’s breeding value based on 4-year olds’ test results under rider for both disciplines.
The genetic correlations between jumping and dressage classes/quartiles were moderately to highly positive (0.32 and 0.45). It means that there is no conflict in breeding horses for the two disciplines within the Swedish Warmblood population.
Conclusions
For both tests of young horses, effects of event were shown to be important and should therefore be included in the statistical models for genetic evaluation. Effects of sex and age were significant but of less importance.
Higher heritabilities were found for RHQT traits recorded in the two later time periods (1988 to 1995 and 1996 to 2003) compared to results of the early period (1973 to 1987) due to lower residual variances and somewhat higher genetic variances. In addition, genetic correlations estimated between results of the different time periods indicate that judgement of RHQT traits has changed during the 30 years of testing. How to best use the early records in the genetic evaluations is a question that has to be further studied.
Both YHT and RHQT showed moderately high and similar heritabilities for most traits (0.2 to 0.5) reflecting the breeding goals of Swedish Warmblood, and highly positive genetic correlations (0.82 to 0.99) between similar traits at the two ages. Inclusion of YHT in the genetic evaluations enables an earlier estimation of breeding values. More test opportunities for young horses will also allow a larger number of horses to be tested, leading to more reliable breeding values and opportunities for higher selection intensity.
There are low but slightly favourable genetic correlations between gaits and jumping traits, indicating good opportunities for selection within the same population for both trait groups.
Acknowledgements
Financial support from Agria Insurance Company and the Foundation for Swedish Horse Research is gratefully acknowledged. The Swedish Warmblood Association and the Swedish Horse Board, especially Gunilla Philipsson, are gratefully acknowledged for providing materials for the study.