

1 Introduction
A detonation consists of a shock wave sustained by rapid energy release due to chemical reaction. The large pressures generated in a detonating condensed-phase high explosive (HE) cause lateral yielding of any confining material, and thus the primary use of HE detonation is to pressure load and drive a surrounding confiner (Sharpe & Braithwaite Reference Sharpe and Braithwaite2005; Bdzil & Stewart Reference Bdzil and Stewart2007). Many problems in detonation physics concern steady flow states in which the detonation is running parallel to the confinement surface (see § 2). In steady flow, the detonation speed is dependent on the flow within a finite-length structure known as the detonation driving zone (DDZ), comprising the subsonic elliptic flow region spatially bounded by the detonation shock, confinement material interface and the sonic flow locus (in a frame attached to the detonation shock). For a fixed HE size and geometry, this DDZ structure is strongly influenced by the confiner material properties, especially the impedance, and the thickness of the surrounding confinement. In addition, the DDZ is influenced by the subsonic or supersonic nature of the induced flow both within the confiner and along the HE–confiner material interface, and by the type of wave reflections off the external confiner boundary (see Short & Quirk (Reference Short and Quirk2018) for further discussion on the DDZ).
The detonation confinement problem has received significant interest, e.g. Bdzil (Reference Bdzil1981), Stewart & Bdzil (Reference Stewart and Bdzil1989), Vidal et al. (Reference Vidal, Cowperthwaite, Presles and Bouton1994), Gamezo & Oran (Reference Gamezo and Oran1997), Sharpe & Braithwaite (Reference Sharpe and Braithwaite2005), Schoch, Nikiforakis & Lee (Reference Schoch, Nikiforakis and Lee2013) and Short & Quirk (Reference Short and Quirk2018). Information about the confinement flow is transmitted to the subsonic DDZ region across the HE–confiner material interface, although Chiquete & Short (Reference Chiquete and Short2019) have recently shown that propagation of information through the supersonic flow region in the HE, originating at the confinement boundary downstream of the DDZ, can also influence the DDZ structure. For higher density metal or alloy confiners, such as tantalum or stainless steel (SS), an oblique inert shock is transmitted into the confiner. The flow behind the oblique confiner shock is supersonic including that along the HE–confiner interface, whereas in the HE the flow is subsonic along the HE–confiner interface within the DDZ extent. Consequently, the DDZ structure will be modified by the confiner flow state. However, with supersonic flow in the confiner, the DDZ structure and thus the detonation speed will be unaffected by variations in the thickness of the confiner, except for sufficiently thin confinement layers. In this case, waves reflecting off the outer surface of the confiner can impinge on the HE–confiner material interface within the DDZ extent (Short & Quirk Reference Short and Quirk2018). In contrast, for lower density metals such as aluminium (Al) or titanium, the confiner shock is not as obliquely turned, and a subsonic flow originates behind the confiner shock. Consequently, variations in the confiner thickness should have a significant effect on the DDZ structure, although the detailed cause and effect mechanisms are not currently widely understood (Short & Quirk Reference Short and Quirk2018).
Much remains unknown about how the complexity of the flow in a finite thickness confiner influences detonation propagation. In the following, we use multi-material numerical simulations to study the basic flow physics of oblique shock-driven flow in SS and Al confiners with varying thickness, examining detonation speed and DDZ structure changes for supersonic confiner flow (as with SS) and subsonic confiner flow (as with Al). The work is supported by a characteristic path analysis that examines the information flow from the HE–Al or HE–SS material boundaries and from the external confiner material boundary through the supersonic flow regions in the HE and confiner.
2 Model
For the high pressures induced by detonation loading, we can model the flow in both the explosive and confiner with the compressible Euler equations,
 $$\begin{eqnarray}\frac{\text{D}\tilde{\unicode[STIX]{x1D70C}}}{\text{D}\tilde{t}}+\tilde{\unicode[STIX]{x1D70C}}\tilde{\unicode[STIX]{x1D735}}\boldsymbol{\cdot }\tilde{\boldsymbol{u}}=0,\quad \frac{\text{D}\tilde{\boldsymbol{u}}}{\text{D}\tilde{t}}=-\frac{1}{\tilde{\unicode[STIX]{x1D70C}}}\tilde{\unicode[STIX]{x1D735}}\tilde{p},\quad \frac{\text{D}\tilde{e}}{\text{D}\tilde{t}}=\frac{\tilde{p}}{\tilde{\unicode[STIX]{x1D70C}}^{2}}\frac{\text{D}\tilde{\unicode[STIX]{x1D70C}}}{\text{D}\tilde{t}},\end{eqnarray}$$
written in dimensional form for density  $\tilde{\unicode[STIX]{x1D70C}}$, pressure
 $\tilde{p}$, particle velocity
 $\tilde{\boldsymbol{u}}$ and specific internal energy
 $\tilde{e}$. The material derivative
 $\text{D}/\text{D}\tilde{t}=\unicode[STIX]{x2202}/\unicode[STIX]{x2202}\tilde{t}+\tilde{\boldsymbol{u}}\boldsymbol{\cdot }\tilde{\unicode[STIX]{x1D735}}$, where
 $\tilde{t}$ is time.
For the HE, we use a stiffened-gas condensed-phase detonation model (Short, Bdzil & Anguelova Reference Short, Bdzil and Anguelova2006; Short et al. Reference Short, Anguelova, Aslam, Bdzil, Henrick and Sharpe2008), whereupon the equation-of-state (EOS) model for the internal energy,  $\tilde{e}$, the specific reaction enthalpy of the HE,
 $\tilde{q}$, and the frozen sound speed,
 $\tilde{c}_{HE}$, are given by
 $$\begin{eqnarray}\tilde{e}=\frac{\tilde{p}+\tilde{A}}{(\unicode[STIX]{x1D6FE}-1)\tilde{\unicode[STIX]{x1D70C}}}-\tilde{q}\unicode[STIX]{x1D706},\quad \tilde{q}=\frac{\tilde{D}_{CJ}^{2}}{2(\unicode[STIX]{x1D6FE}^{2}-1)}\left(1-\frac{\tilde{A}}{\tilde{\unicode[STIX]{x1D70C}}_{0}\tilde{D}_{CJ}^{2}}\right)^{2},\quad \tilde{c}_{HE}=\left[\frac{\unicode[STIX]{x1D6FE}\tilde{p}+\tilde{A}}{\tilde{\unicode[STIX]{x1D70C}}}\right]^{1/2},\end{eqnarray}$$
respectively, where  $\unicode[STIX]{x1D6FE}$ is the adiabatic exponent (see Davis (Reference Davis1998)),
 $\tilde{A}$ is the stiffened-gas constant,
 $\tilde{\unicode[STIX]{x1D70C}}_{0}$ is the initial density of the HE and
 $\tilde{D}_{CJ}$ is the Chapman–Jouguet (CJ) speed. The parameter
 $\tilde{A}$ mimics the effects of molecular attraction in solid- or liquid-state matter (Le Métayer & Saurel Reference Le Métayer and Saurel2016). Also,
 $\unicode[STIX]{x1D706}$ is the reaction progress variable (
 $0\leqslant \unicode[STIX]{x1D706}\leqslant 1$). The associated reaction model is
 $$\begin{eqnarray}\frac{\text{D}\unicode[STIX]{x1D706}}{\text{D}\tilde{t}}=\tilde{k}\tilde{p}^{n}(1-\unicode[STIX]{x1D706})^{\unicode[STIX]{x1D708}},\end{eqnarray}$$
where  $\tilde{k}$ is a rate constant,
 $n$ is the pressure exponent and
 $\unicode[STIX]{x1D708}$ is a reaction order variable. It is convenient to consider a basic flow non-dimensionalisation, where
 $$\begin{eqnarray}\boldsymbol{x}=\frac{\tilde{\boldsymbol{x}}}{\tilde{l}_{1/2}},\quad t=\frac{\tilde{t}}{(\tilde{l}_{1/2}/\tilde{u} _{ref})},\quad \unicode[STIX]{x1D70C}=\frac{\tilde{\unicode[STIX]{x1D70C}}}{\tilde{\unicode[STIX]{x1D70C}}_{ref}},\quad \boldsymbol{u}=\frac{\tilde{\boldsymbol{u}}}{\tilde{u} _{ref}},\quad p=\frac{\tilde{p}}{\tilde{\unicode[STIX]{x1D70C}}_{ref}\tilde{u} _{ref}^{2}},\quad e=\frac{\tilde{e}}{\tilde{u} _{ref}^{2}}.\end{eqnarray}$$
The length scale  $\tilde{l}_{1/2}$ is the length behind the shock in the steady, planar Chapman–Jouguet detonation wave at which half of the reactant has been consumed. For the HE specific region, we also define
 $$\begin{eqnarray}q=\frac{\tilde{q}}{\tilde{u} _{ref}^{2}},\quad D_{CJ}=\frac{\tilde{D}_{CJ}}{\tilde{u} _{ref}},\quad A=\frac{\tilde{A}}{\tilde{\unicode[STIX]{x1D70C}}_{ref}\tilde{u} _{ref}^{2}},\quad c_{HE}=\frac{\tilde{c}_{HE}}{\tilde{u} _{ref}},\quad k=\tilde{k}\tilde{\unicode[STIX]{x1D70C}}_{ref}^{n}\tilde{u} _{ref}^{2n-1}\tilde{l}_{1/2}.\end{eqnarray}$$
With a chosen density scale  $\tilde{\unicode[STIX]{x1D70C}}_{ref}=1~\text{g}~\text{cm}^{-3}$ and velocity scale
 $\tilde{u} _{ref}=1~\text{mm}~\unicode[STIX]{x03BC}\text{s}^{-1}$, we take
 $$\begin{eqnarray}\unicode[STIX]{x1D70C}_{0}=2,\quad A=12.8,\quad D_{CJ}=8,\end{eqnarray}$$
as for previous studies, e.g. Short et al. (Reference Short, Quirk, Chiquete and Meyer2018). We also choose the equation-of-state and weakly state-sensitive rate parameters
 $$\begin{eqnarray}\unicode[STIX]{x1D6FE}=3,\quad n=1,\quad \unicode[STIX]{x1D708}=1/2,\end{eqnarray}$$
for which  $q=3.24$. These choices are consistent with the broad, physically observed, properties of detonation in conventional and insensitive HEs (Short & Quirk Reference Short and Quirk2018). This gives
 $k\approx 0.051359$.
For the confiner, again as in previous studies, e.g. Short et al. (Reference Short, Quirk, Chiquete and Meyer2018) and Short & Quirk (Reference Short and Quirk2018), we use a linearised Mie–Grüneisen form for the EOS, where the internal energy  $\tilde{e}$ is related to pressure
 $\tilde{p}$ and density
 $\tilde{\unicode[STIX]{x1D70C}}$ by
 $$\begin{eqnarray}\tilde{e}-\tilde{e}_{c}(\tilde{\unicode[STIX]{x1D70C}})=(\tilde{p}-\tilde{p}_{c}(\tilde{\unicode[STIX]{x1D70C}}))/(\tilde{\unicode[STIX]{x1D70C}}_{c0}\unicode[STIX]{x1D6E4}_{c0}),\end{eqnarray}$$
and where  $\tilde{e}_{c}(\tilde{\unicode[STIX]{x1D70C}})$ and
 $\tilde{p}_{c}(\tilde{\unicode[STIX]{x1D70C}})$ represent the variation of internal energy and pressure as a function of density along some reference curve (Davis Reference Davis1998; Menikoff Reference Menikoff and Horie2007). Here,
 $\unicode[STIX]{x1D6E4}_{c0}$ is the Grüneisen gamma and
 $\tilde{\unicode[STIX]{x1D70C}}_{c0}$ is the ambient confiner density. For our study, the reference curve is taken to be the Hugoniot shock curve for the confiner material, obtained experimentally by measuring the flow particle speed (
 $\tilde{u} _{p}$) as a function of shock speed (
 $\tilde{U} _{s}$) in a one-dimensional configuration. These data are typically obtained in a gas-gun configuration from the impact of a flyer onto the material under study (Davis Reference Davis1998). For many metals, over a wide range of
 $\tilde{U} _{s}$, the
 $\tilde{U} _{s}$–
 $\tilde{u} _{p}$ relation is observed to be approximately linear, whereupon
 $\tilde{U} _{s}=\tilde{c}_{c}+s\tilde{u} _{p}$ (Davis Reference Davis1998). Here
 $\tilde{c}_{c}$ is the sound speed at the ambient state, while
 $s$ is the slope
 $\text{d}\tilde{U} _{s}/\text{d}\tilde{u} _{p}$. Marsh (Reference Marsh1980) lists experimental data for the linear
 $\tilde{U} _{s}$–
 $\tilde{u} _{p}$ relation for a number of confiner materials. With the
 $\tilde{U} _{s}$–
 $\tilde{u} _{p}$ relation determined experimentally, the reference Hugoniot curve defining
 $\tilde{e}_{c}(\tilde{\unicode[STIX]{x1D70C}})$ and
 $\tilde{p}_{c}(\tilde{\unicode[STIX]{x1D70C}})$ is then constructed via the Rankine–Hugoniot shock-jump conditions. The confiner internal energy (2.8) is then related to
 $\tilde{p}$ and
 $\tilde{\unicode[STIX]{x1D70C}}$ by
 $$\begin{eqnarray}\tilde{e}=\frac{\tilde{c}_{c}^{2}\unicode[STIX]{x1D70E}^{2}}{2(1-s\unicode[STIX]{x1D70E})^{2}}+\frac{1}{\unicode[STIX]{x1D6E4}_{c0}\tilde{\unicode[STIX]{x1D70C}}_{c0}}\left(\tilde{p}-\frac{\tilde{\unicode[STIX]{x1D70C}}_{c0}\tilde{c}_{c}^{2}\unicode[STIX]{x1D70E}}{(1-s\unicode[STIX]{x1D70E})^{2}}\right),\quad \unicode[STIX]{x1D70E}=1-\frac{\tilde{\unicode[STIX]{x1D70C}}_{c0}}{\tilde{\unicode[STIX]{x1D70C}}}.\end{eqnarray}$$
The sound speed in the confiner is
 $$\begin{eqnarray}\tilde{c}_{M}=\left[\frac{\unicode[STIX]{x1D6E4}_{c0}\tilde{\unicode[STIX]{x1D70C}}_{c0}\tilde{p}}{\tilde{\unicode[STIX]{x1D70C}}^{2}}+\frac{\tilde{\unicode[STIX]{x1D70C}}_{c0}^{2}\tilde{c}_{c}^{2}}{\tilde{\unicode[STIX]{x1D70C}}^{2}(1-s\unicode[STIX]{x1D70E})^{2}}(1-\unicode[STIX]{x1D6E4}_{c0}\unicode[STIX]{x1D70E})+\frac{2\tilde{\unicode[STIX]{x1D70C}}_{c0}^{2}\tilde{c}_{c}^{2}s\unicode[STIX]{x1D70E}}{\tilde{\unicode[STIX]{x1D70C}}^{2}(1-s\unicode[STIX]{x1D70E})^{3}}\left(1-\frac{\unicode[STIX]{x1D6E4}_{c0}}{2}\unicode[STIX]{x1D70E}\right)\right]^{1/2}.\end{eqnarray}$$
In addition to the non-dimensionalisation (2.4), we also define
 $$\begin{eqnarray}c_{c}=\frac{\tilde{c}_{c}}{\tilde{u} _{ref}},\quad c_{M}=\frac{\tilde{c}_{M}}{\tilde{u} _{ref}},\quad \unicode[STIX]{x1D70C}_{c0}=\frac{\tilde{\unicode[STIX]{x1D70C}}_{c0}}{\tilde{\unicode[STIX]{x1D70C}}_{ref}}.\end{eqnarray}$$
Here, we consider either aluminium or stainless steel as the confining material. Aluminium has a density of  $2.7~\text{g}~\text{cm}^{-3}$ and a sound speed of
 $5.328~\text{mm}~\unicode[STIX]{x03BC}\text{s}^{-1}$, while stainless steel has a density of
 $7.926~\text{g}~\text{cm}^{-3}$ and a sound speed of
 $4.48~\text{mm}~\unicode[STIX]{x03BC}\text{s}^{-1}$. With the non-dimensionalisation (2.4) and (2.11), the EOS parameters for Al are given by
 $$\begin{eqnarray}c_{c}=5.328,\quad s=1.338,\quad \unicode[STIX]{x1D70C}_{c0}=2.7,\quad \unicode[STIX]{x1D6E4}_{0}=2,\end{eqnarray}$$
while for SS,
 $$\begin{eqnarray}c_{c}=4.48,\quad s=1.51,\quad \unicode[STIX]{x1D70C}_{c0}=7.926,\quad \unicode[STIX]{x1D6E4}_{0}=2.18.\end{eqnarray}$$
A section of the two-dimensional (2-D) planar computational geometry under consideration is shown in figure 1, where HE (light grey region) is confined either by Al or SS (blue region), and where  $\boldsymbol{x}=(x,y)$,
 $\boldsymbol{u}=(u,v)$. Outside of the confiner is an air layer (red region), so that the confiner can expand laterally. This region is modelled with an ideal gas EOS
 $$\begin{eqnarray}\tilde{e}=\frac{\tilde{p}}{(\unicode[STIX]{x1D6FE}_{a}-1)\tilde{\unicode[STIX]{x1D70C}}},\quad \unicode[STIX]{x1D6FE}_{a}=1.4.\end{eqnarray}$$
With (2.4), the initial air density is  $\unicode[STIX]{x1D70C}_{a0}=0.0012$. Symmetry conditions are applied along the bottom boundary of figure 1, so that for a total HE height
 $W_{HE}$, the HE region shown has height
 $W_{HE}/2$. In the following,
 $W_{HE}=46$ for all cases. The confiner thickness
 $W_{C}$ is varied, while the air layer thickness is set in the range
 $W_{a}=40{-}80$, depending on the confiner thickness. The channel length
 $L=600$ in all cases. Outflow conditions are applied along the left, right and top boundaries. The detonation wave in the HE is initiated by placing a quarter-circle region of radius
 $W_{HE}/4$ at the CJ pressure in the left bottom corner of the HE region. The detonation moves radially outward, interacts with the confiner region, and, after propagating axially a distance of a few HE thicknesses, attains a steady axial speed
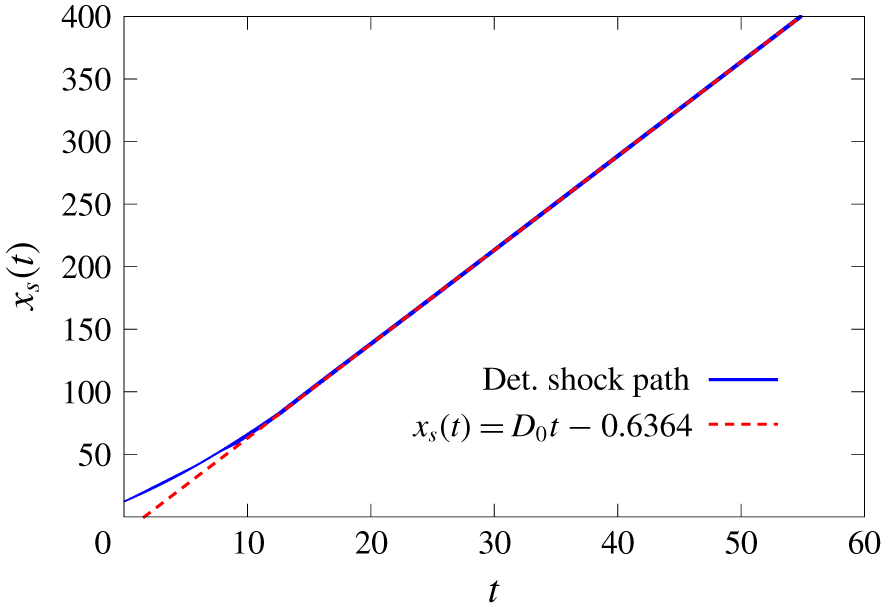
 $D_{0}$ moving from left to right (figure 1). Note that
 $D_{0}$ is obtained via a linear least squares fit through the
 $(t,x)$ shock trajectory on the symmetry line
 $y=0$, after the detonation wave has relaxed to a steady-state propagation mode (figure 2). The marker for tracking the shock location is described by Short et al. (Reference Short, Quirk, Chiquete and Meyer2018).
A section of the 2-D planar computational geometry showing HE (light grey), confiner (blue) and air (red) regions. Also shown is a steady stage of detonation propagation with Al confinement with  $D_{0}=7.521$. Here
 $W_{HE}=46$ and
 $W_{C}=5$, a case further explored in § 3.2 (see figure 7c). The dark lines represent a weighted pressure gradient image representation of the primary flow structures, as described in § 3, while the red, yellow and green lines represent 50 %, 75 % and 99 % reactant depletion contours respectively (figure 7c).

Detonation shock location ( $x_{s}(t)$) along
 $y=0$ as a function of time (
 $t$) corresponding to the simulation shown in figure 1, along with the linear least squares fit through the
 $(t,x_{s}(t))$ shock trajectory once steady state propagation is obtained. There is a transient period after the detonation initiates from the hot-spot, accelerating up to its steady-state speed
 $D_{0}$ (
 $=7.521$). Steady-state propagation is reached at
 $x_{s}\approx 100$.

The flow equations in the HE, confiner and air regions are integrated with a cell-centred finite volume method on a Cartesian mesh within the multi-material simulation framework AMRITA-MultiMat (Quirk Reference Quirk2007). A second-order minmod spatial reconstruction with a Lax–Friedrichs flux is used together with a second-order total variation diminishing Runge–Kutta time integration. Material interfaces are treated with a ghost fluid method (Fedkiw et al. Reference Fedkiw, Aslam, Merriman and Osher1999). As noted by Quirk (Reference Quirk2006), the ghost fluid method is built on the premise that a material interface can be discretised as two distinct materials that communicate, indirectly, via ghost cells. For the computations below, we construct a local linearised Riemann solution based on the real fluid state on either side of the interface to populate the relevant ghost fluid states for each real material. A detailed description of the theory and application of the linearised Riemann solution-based ghost fluid closure is given by Quirk (Reference Quirk2006). The interface position is evolved using a level set strategy. A block structured adaptive-mesh-refinement capability is also employed. For the computations shown in § 3, two levels of refinement are used with a refinement factor of 4 for each level. The resolution of the finest grid is specified by the number of points (Npts) per the unit (half-reaction zone) length defined above. Unless specified otherwise, a resolution of  $\text{Npts}=80$ was used. Resolution studies were conducted for selected cases in § 3, where simulations with
 $\text{Npts}=160$ led to variations in
 $D_{0}$ of only
 ${\approx}2\times 10^{-3}$.
3 Detonation propagation with SS and Al confinements
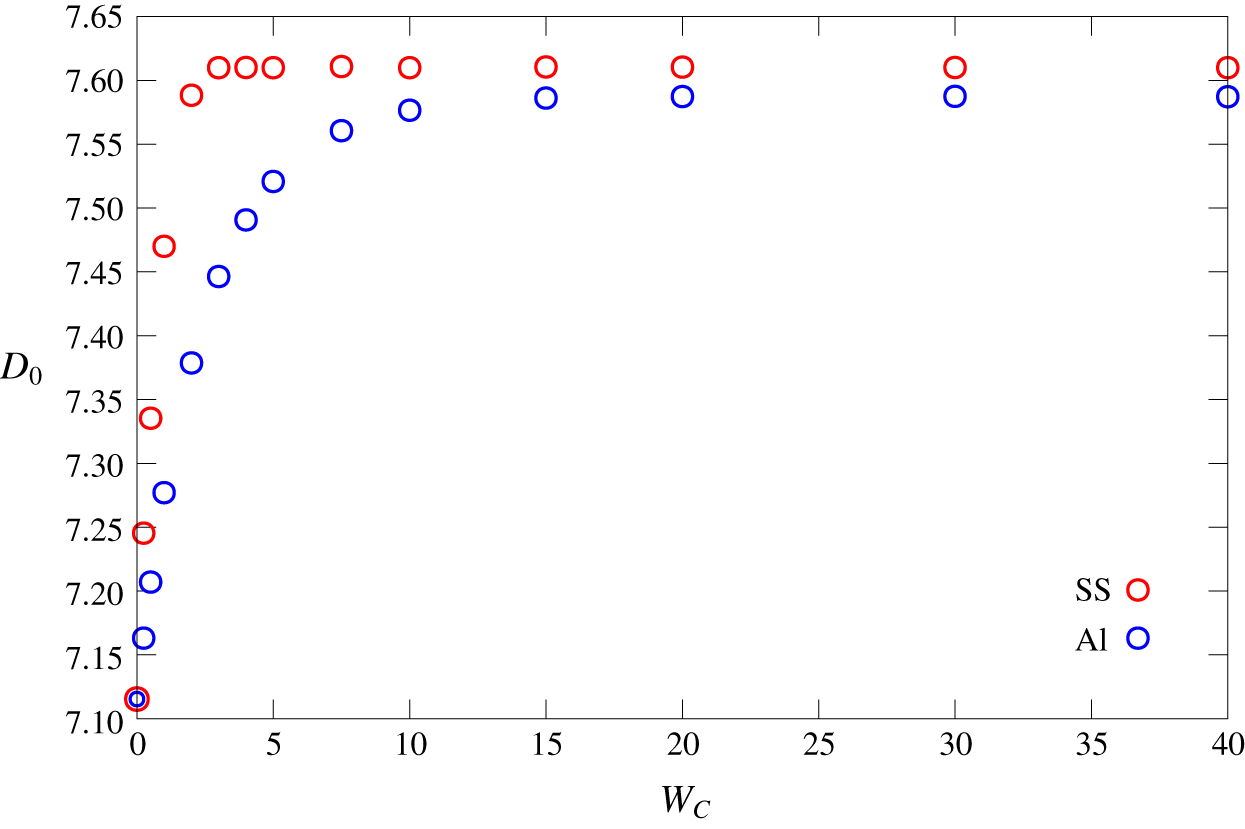
Figure 3 shows the variation of axial detonation speed  $D_{0}$ for
 $W_{HE}=46$ as a function of confiner thickness
 $W_{C}$ for both SS and Al confinements. For reference,
 $D_{0}=7.115$ for
 $W_{C}=0$ with
 $W_{HE}=46$. For SS confinement,
 $D_{0}$ increases rapidly from that for the smallest
 $W_{C}$ calculated (
 $W_{C}=0.25$) and subsequently saturates at
 $D_{0}=7.610$ for
 $W_{C}\geqslant 3$. Recall that
 $W_{C}=3$ corresponds to
 $3\tilde{l}_{1/2}$ in dimensional units, where
 $\tilde{l}_{1/2}$ is the length behind the shock in the steady planar Chapman–Jouguet detonation wave at which half of the reactant has been consumed. In contrast, for Al confinement,
 $D_{0}$ increases more gradually as
 $W_{C}$ increases, with
 $D_{0}$ remaining dependent on
 $W_{C}$ up to large confinement thicknesses. As will be shown below, there is some influence of the Al confiner thickness for
 $W_{C}=20$, but for
 $W_{C}=30$, the dependence of
 $D_{0}$ on
 $W_{C}$ has saturated, limiting to
 $D_{0}=7.587$. The transition to where
 $D_{0}$ saturates occurs within the range
 $20<W_{C}\leqslant 30$. Interestingly, the limiting
 $D_{0}$ speeds for SS and Al confinement are close despite the large material impedance differences between SS and Al.
The variation of  $D_{0}$ with SS and Al confiner thickness (
 $W_{C}$) for
 $W_{HE}=46$.

3.1 Stainless steel confinement
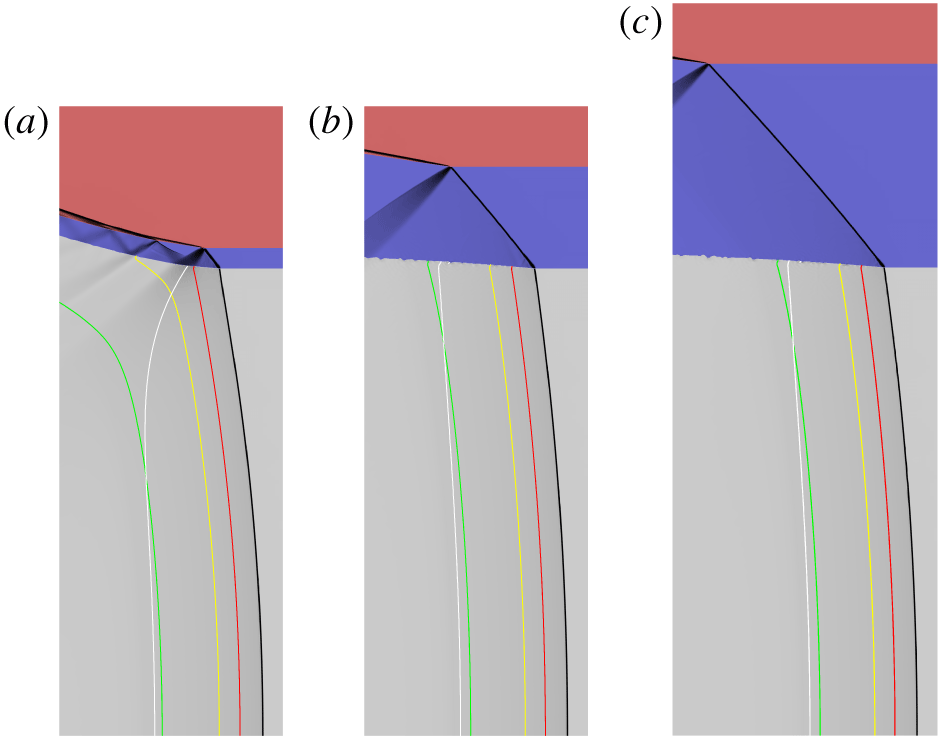
Weighted pressure gradient image representation of the primary flow structures for  $W_{HE}=46$ and for varying SS confinement thickness given by (a)
 $W_{C}=1$ (
 $D_{0}=7.470$), (b)
 $W_{C}=5$ (
 $D_{0}=7.610$) and (c)
 $W_{C}=10$ (
 $D_{0}=7.610$). In cases (a) and (b), the window has computational domain width 11 and height 31, while for (c), the window width is 13 and height 36. Note that (a–c) are shown with the same horizontal and vertical scales. The light grey area is the HE region, blue is the SS confiner and red is air. The white lines are the sonic flow contours in the HE region in a frame travelling with speed
 $D_{0}$. The red, yellow and green lines represent 50 %, 75 % and 99 % reactant depletion contours respectively.

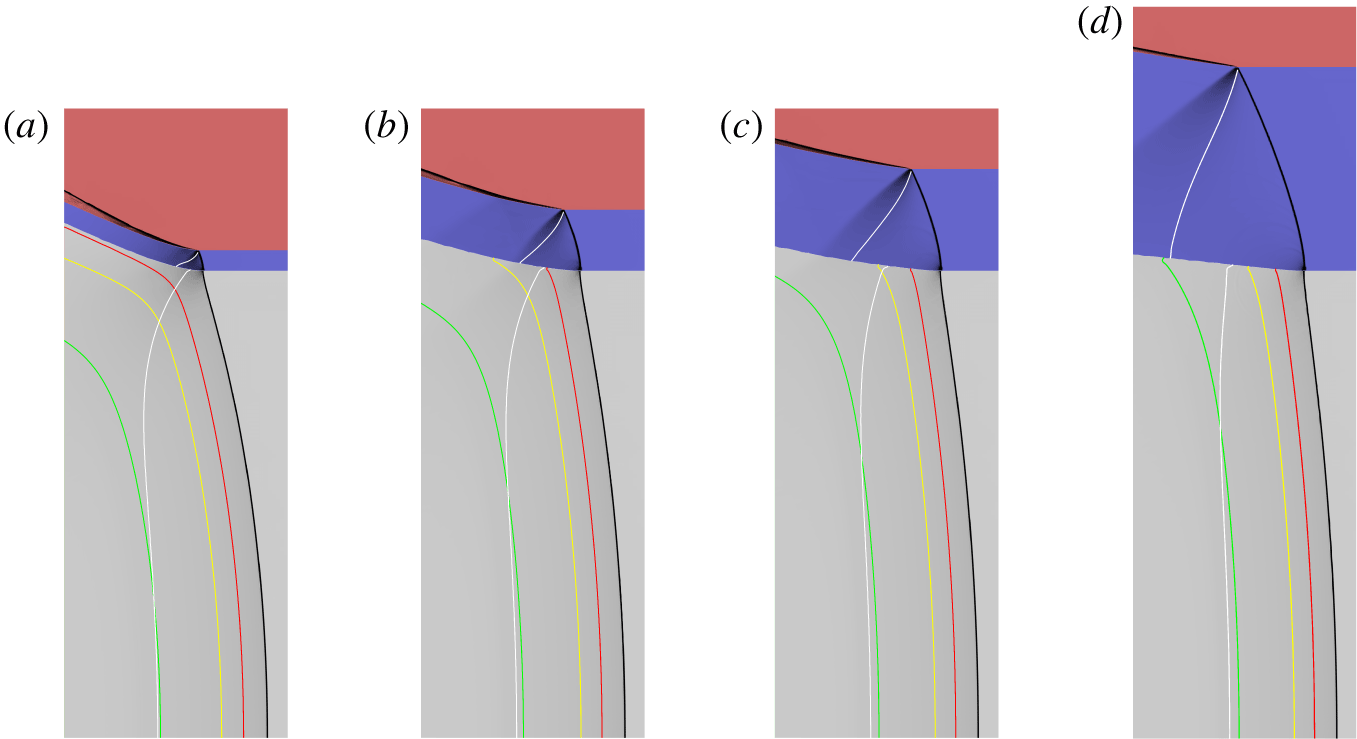
Figure 4 shows weighted pressure gradient images of the HE and confiner flow for SS confinement with  $W_{C}=1$, 5 and 10, along with sonic flow lines (in a steady frame travelling with speed
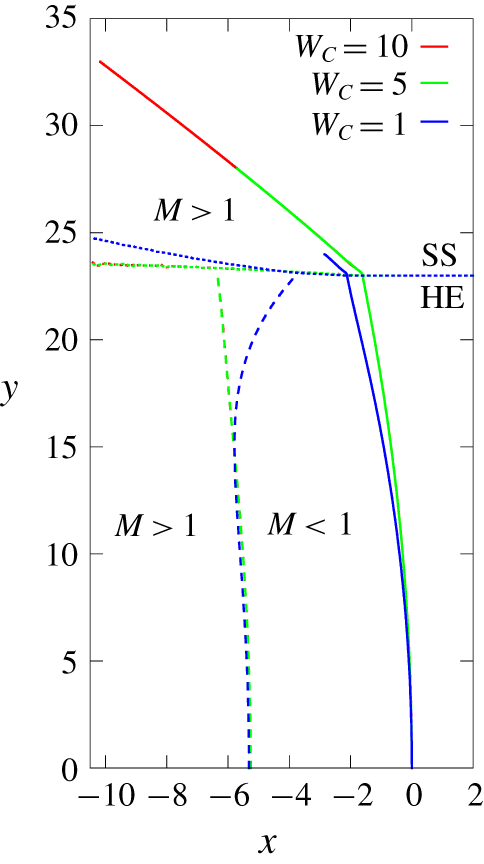
 $D_{0}$) and selected reaction progress variable contours. The weighted pressure gradient images are designed to use a grey shading to highlight regions of the strongest variations in the pressure gradient for the HE and confiner flows, such as shocks and expansion fans. The shading prescription is described in Short et al. (Reference Short, Quirk, Chiquete and Meyer2018), with the darkest regions in figure 4 corresponding to the largest pressure gradients. The weighted pressure gradient images do not contain quantitative data, but rather play a role similar to that of schlieren imaging of compressible flows. Figure 5 shows the trajectories of the HE detonation shocks and the associated sonic flow loci, as well as the SS confiner shocks for
 $W_{C}=1$, 5 and 10. Consequently, figure 5 shows the variation of the HE DDZ structure with varying
 $W_{C}$. In all three cases, an oblique shock is transmitted into the SS confiner by the detonation. In a steady frame traveling axially with speed
 $D_{0}$, the flow behind the SS confiner shock is supersonic. An expansion wave reflects off the SS–air interface due to impingement of the shock. For
 $W_{C}=1$, the head of the confiner expansion wave intersects the HE–SS interface ahead of the sonic flow locus position in the HE (figure 4a), and therefore must influence the DDZ structure and consequently
 $D_{0}$. For
 $W_{C}=5$ and 10, i.e. for SS thicknesses where the dependence of
 $D_{0}$ on
 $W_{C}$ has saturated, the head of the confiner expansion wave at the HE–SS interface lies significantly downstream of the HE DDZ. The DDZ structure for
 $W_{C}=5$ overlays that for
 $W_{C}=10$ (figure 5), while for
 $W_{C}=1$ the largest variation in DDZ structure from that for
 $W_{C}=5$ and 10 is observed near the HE–SS interface. In particular, the HE sonic locus at the HE–SS interface for
 $W_{C}=1$ lies significantly closer to the detonation shock than for
 $W_{C}=5$ and
 $W_{C}=10$, while the reaction progress is markedly smaller near the interface region for
 $W_{C}=1$ (figure 4).
The detonation shock (solid lines) and sonic flow (dashed lines) loci in the HE region, and the shock loci (solid lines) in the SS confiner, along with the HE–SS material interface trajectories (dotted lines), for  $W_{C}=1$, 5 and 10. The symmetry axis is along
 $y=0$, and for each locus, the reference point has been set such that the HE detonation shock location along
 $y=0$ is
 $x=0$. The shock and sonic loci for
 $W_{C}=5$ and 10 overlap in the HE region.

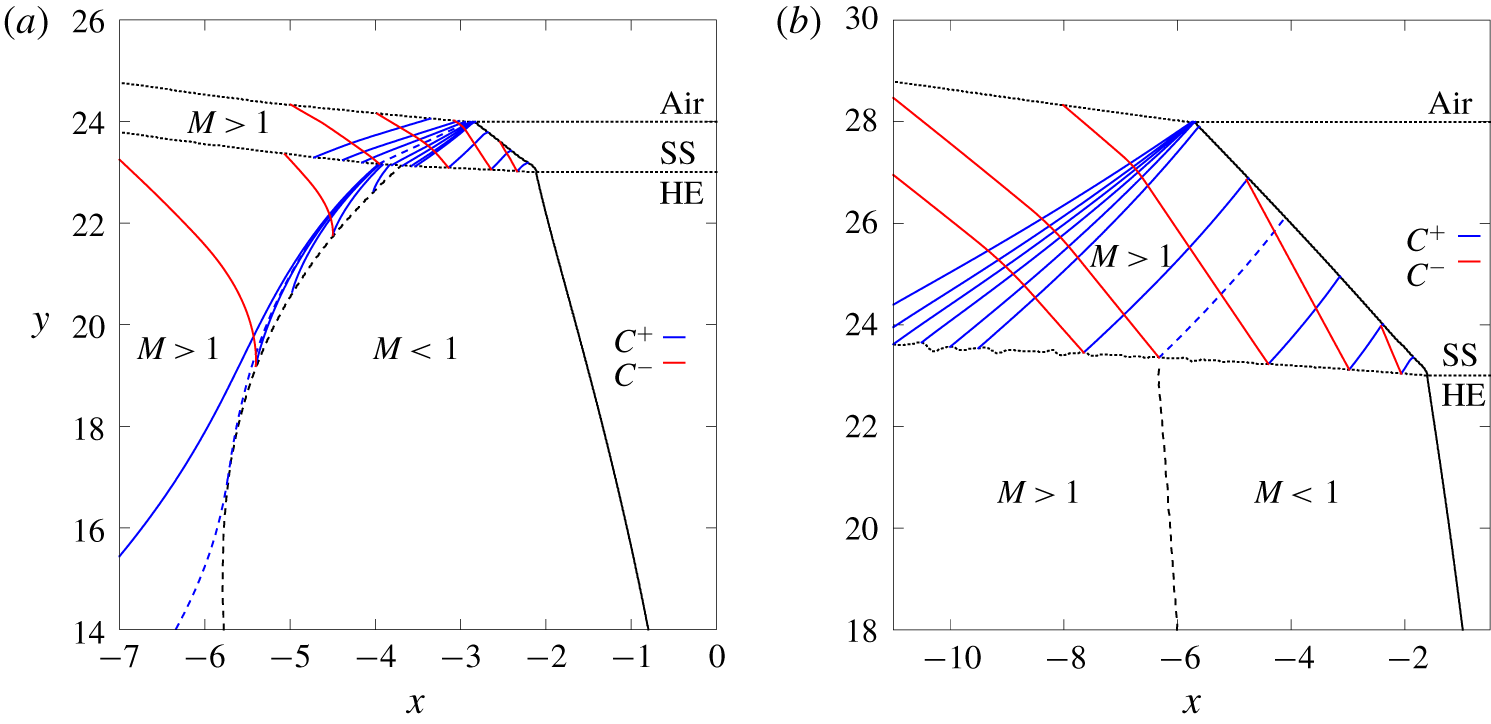
In order to further understand the influence of the SS confiner thickness on  $D_{0}$, we have calculated characteristic paths in the supersonic regions of the steady flow, i.e. behind the sonic locus in the HE and in the SS confiner region. In the
 $(x,y)$ coordinate system (figure 1), these are given by
 $$\begin{eqnarray}\frac{\text{d}x}{\text{d}y}=\frac{(u-D_{0})^{2}-c^{2}}{(u-D_{0})v\pm c\sqrt{(u-D_{0})^{2}+v^{2}-c^{2}}},\end{eqnarray}$$
where  $c=c_{HE}$ (2.2) in the HE and
 $c=c_{M}$ (2.10) in the SS confiner. Figure 6(a) shows selected characteristic paths for
 $W_{C}=1$, where the
 $+$ sign in the denominator of (3.1) is associated with
 $C^{+}$ characteristics that propagate information in the downward direction (decreasing
 $y$), while the
 $-$ sign in (3.1) is associated with
 $C^{-}$ characteristics propagating information in the upward direction (increasing
 $y$). Supersonic and subsonic flow regions are indicated by
 $M>1$ and
 $M<1$ respectively, where the flow Mach number in a frame travelling with speed
 $D_{0}$ is
 $$\begin{eqnarray}M=\frac{\sqrt{(u-D_{0})^{2}+v^{2}}}{c}.\end{eqnarray}$$
The flow along the HE–SS interface on the SS side is supersonic, while on the HE side it is subsonic ahead of the HE sonic locus and supersonic behind.  $C^{+}$ characteristic paths carry information from the SS confiner shock into the HE–SS interface ahead of the HE sonic locus. An expansion wave is observed in the confiner as a result of the intersection of the confiner shock with the SS–air interface. A
 $C^{+}$ characteristic defining the head of the fan carries information from the SS–air interface into the HE–SS interface ahead of the sonic locus in the HE. Since the flow in the HE at the HE–SS interface is subsonic at this point, the DDZ must respond to information propagated from the SS–air interface. Additional
 $C^{+}$ characteristics from the reflected SS–air expansion fan propagate information further along the HE–SS interface, across the HE sonic locus and into the regions of the interface where the flow in the HE is supersonic. Also, in the confiner,
 $C^{-}$ characteristic paths move information from the HE–SS interface into the confiner shock and SS–air interface. The
 $C^{-}$ characteristics intersecting the SS confiner shock originate from the HE–SS interface locations close to the HE shock.
Selected  $C^{+}$ and
 $C^{-}$ characteristics paths in the supersonic flow regions of the SS confiner and HE for (a)
 $W_{C}=1$ and (b)
 $W_{C}=5$. The solid black lines are the HE and SS shocks, the dashed black lines are the sonic flow loci in the HE region and the dotted black lines are the HE–SS and SS–air material interfaces. The dashed blue lines represent limiting
 $C^{+}$ characteristic paths. Supersonic and subsonic flow regions are indicated by
 $M>1$ and
 $M<1$ respectively.

The region of influence of the SS confiner on the HE DDZ structure is further complicated by the flow of information within the supersonic region of the HE. Figure 6(a) shows the path of selected  $C^{+}$ characteristics that carry information from the supersonic region of the HE–SS interface on the HE side into the interior of the HE. Due to the effects of reactivity, a subset of
 $C^{+}$ characteristics, originating from the HE–SS interface at a finite distance behind the HE sonic locus, carry information from the HE–SS interface into the sonic locus of the HE. This information flow from the supersonic regions of the HE must also therefore influence the HE DDZ structure. A limiting HE
 $C^{+}$ characteristic, shown in figure 6(a), bounds the region of HE supersonic flow for which
 $C^{+}$ characteristics from the HE–SS boundary impinge on the sonic locus. This effect was recently identified by Chiquete & Short (Reference Chiquete and Short2019), although they considered a specialised problem consisting only of the HE domain with an imposed HE–confiner interface shape. Here we show that the same behaviour occurs for multi-material flows where the confiner dynamics is accounted for. Returning to the confiner region, we can now identify a limiting
 $C^{+}$ characteristic from the SS–air interface that intersects the HE–SS interface at the origin of the
 $C^{+}$ limiting characteristic in the HE. Consequently, there is an extended region of the HE beyond the HE sonic locus where information from the HE–SS interface, and thus the confiner, can influence the detonation propagation. We refer to this region as the extended DDZ structure.
Figure 6(b) shows selected  $C^{+}$ and
 $C^{-}$ characteristic paths in the confiner for
 $W_{C}=5$. This is for a case where
 $D_{0}$ has increased to its limiting value. Again, an expansion fan is reflected off the SS–air interface as a result of the oblique SS confiner shock impact. In contrast to the
 $W_{C}=1$ behaviour,
 $C^{+}$ characteristics associated with the expansion fan from the SS–air interface now carry information far downstream of the HE sonic locus. Additionally, for the larger
 $D_{0}$ found for
 $W_{C}=5$, we do not detect a region of supersonic flow behind the sonic locus in the HE that carry HE region
 $C^{+}$ characteristics into the HE sonic locus. Either it is absent for
 $W_{C}=5$, or has significantly decreased in size to an extent that it is no longer resolvable within the multi-material calculation. Consequently, the region of the HE–SS interface where
 $C^{+}$ characteristics in the HE carry information downstream of the HE sonic locus starts at, or very close, to the HE sonic locus. The region of subsonic flow along the HE–SS boundary in the HE is now impacted only by SS
 $C^{+}$ characteristics originating at the oblique SS confiner shock boundary. Importantly, the limiting
 $C^{+}$ confiner characteristic bounding information carried into this HE–SS boundary region is shown in figure 6(b) and observed to originate on the SS confiner shock away from the SS–air interface. The path of the limiting SS
 $C^{+}$ confiner characteristic illustrates why the SS–air interface, and thus the SS confiner thickness, has no influence on the HE DDZ structure and therefore the detonation propagation speed
 $D_{0}$. Once the confiner
 $C^{+}$ limiting characteristic detaches from the SS–air interface, information on the confiner thickness is lost to the HE DDZ structure.
Weighted pressure gradient image representation of the primary flow structures within the HE and Al regions for  $W_{HE}=46$ and for varying Al confinement thickness given by (a)
 $W_{C}=1$ (
 $D_{0}=7.277$), (b)
 $W_{C}=3$ (
 $D_{0}=7.446$), (c)
 $W_{C}=5$ (
 $D_{0}=7.521$) and (d)
 $W_{C}=10$ (
 $D_{0}=7.577$). In cases (a–c), the window has width 11 and height 31. For (d), the window width is 11 and height 36. The light grey area is the HE region, blue is the Al confiner and red is air. The white lines are the sonic flow contours in both the HE and Al confiner regions in a frame travelling with speed
 $D_{0}$. The red, yellow and green lines represent 50 %, 75 % and 99 % reactant depletion contours, respectively.

As for figure 7, but with (a)  $W_{C}=20$ (
 $D_{0}=7.587$), (b)
 $W_{C}=30$ (
 $D_{0}=7.587$) and (c)
 $W_{C}=40$ (
 $D_{0}=7.587$). In (a), the window width is 13 and height 46, (b) 18 by 56 and (c) 24 by 66.

3.2 Aluminium confinement
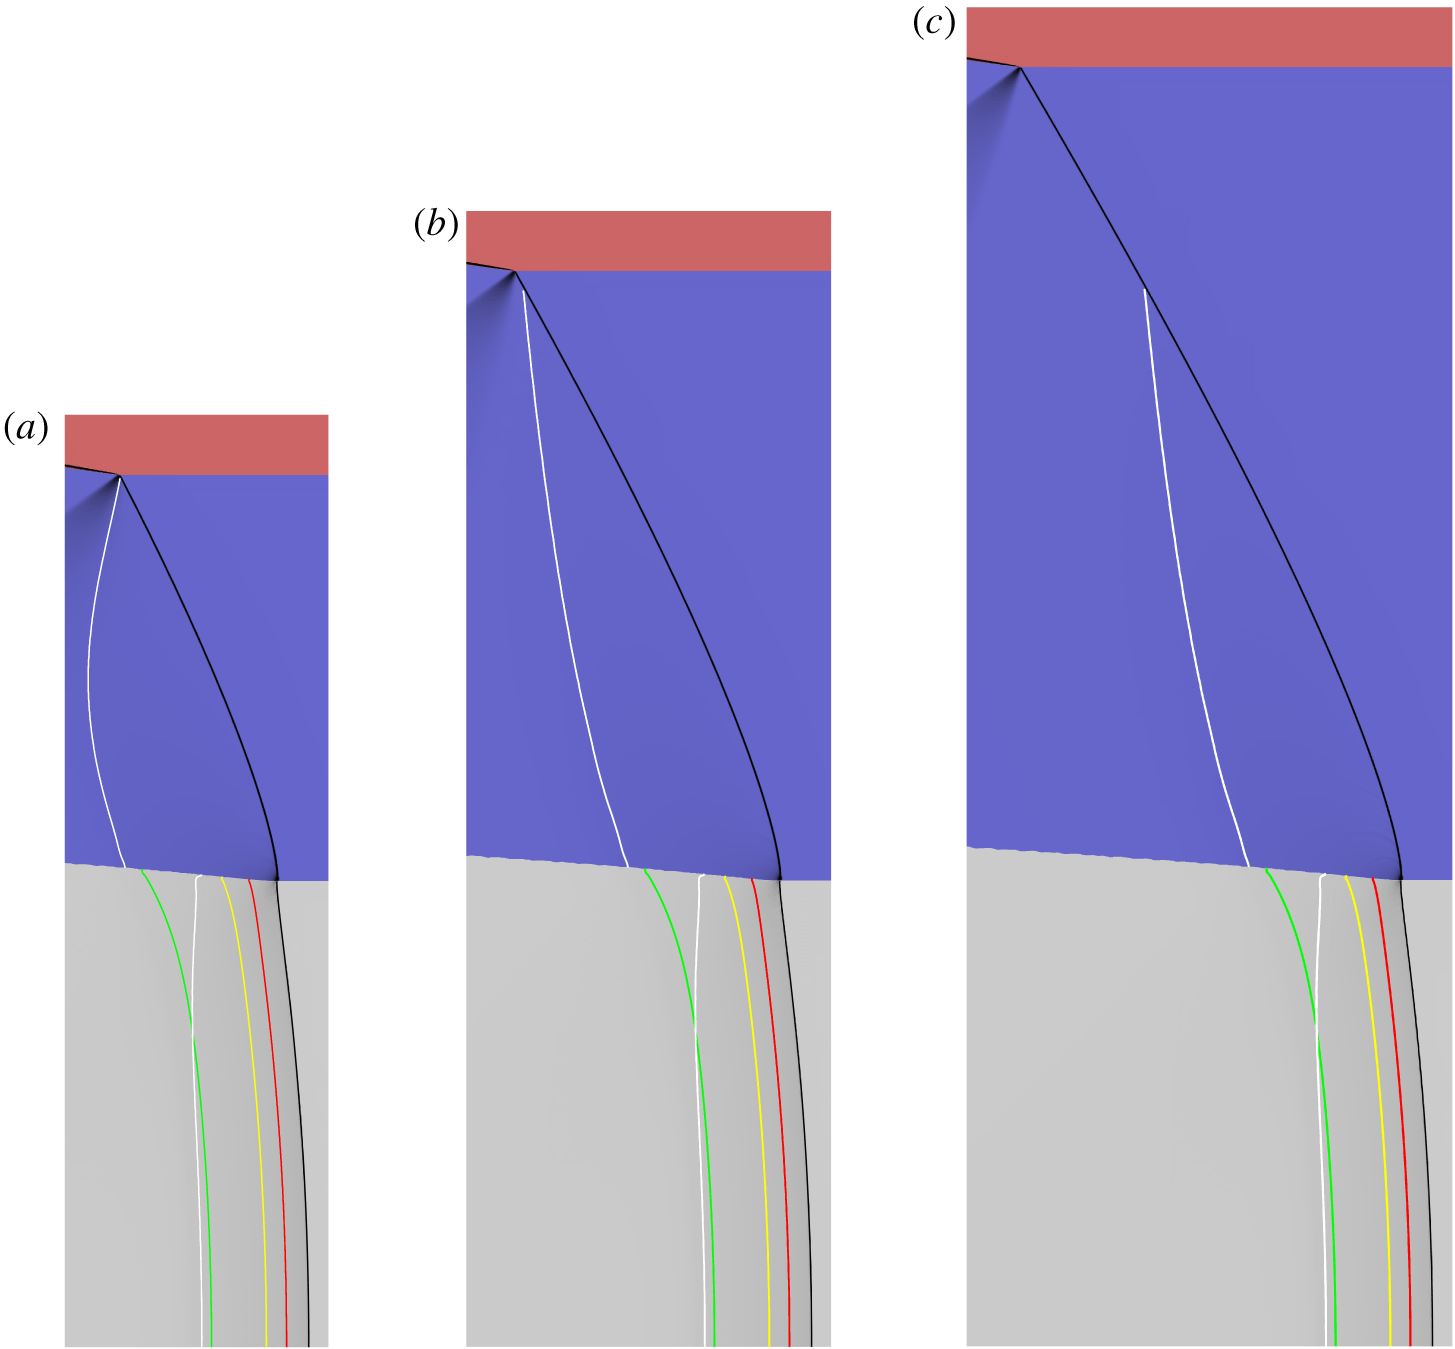
Switching now to Al confinement, figures 7 and 8 show weighted pressure gradient images for  $W_{C}=1$, 3, 5, 10, 20, 30 and 40, along with sonic flow trajectories and selected reaction progress contours. Immediately noticeable is that the Al confiner shocks are not as obliquely inclined as the SS confiner shocks at equivalent confiner thickness. The local HE and Al shock structure at their intersection point with the HE–Al interface is consistent with oblique shock polar theory, which reveals that at the intersection point, the HE and Al shocks orientate themselves so that the Al shock is ahead of the HE shock (Short & Quirk Reference Short and Quirk2018). While this is only a local analysis, it may reflect the difference in obliqueness of the SS and Al confiner shocks at equivalent confiner thicknesses. For every case of Al confinement, we now observe the presence of an elliptic subsonic flow region (in a frame travelling with speed
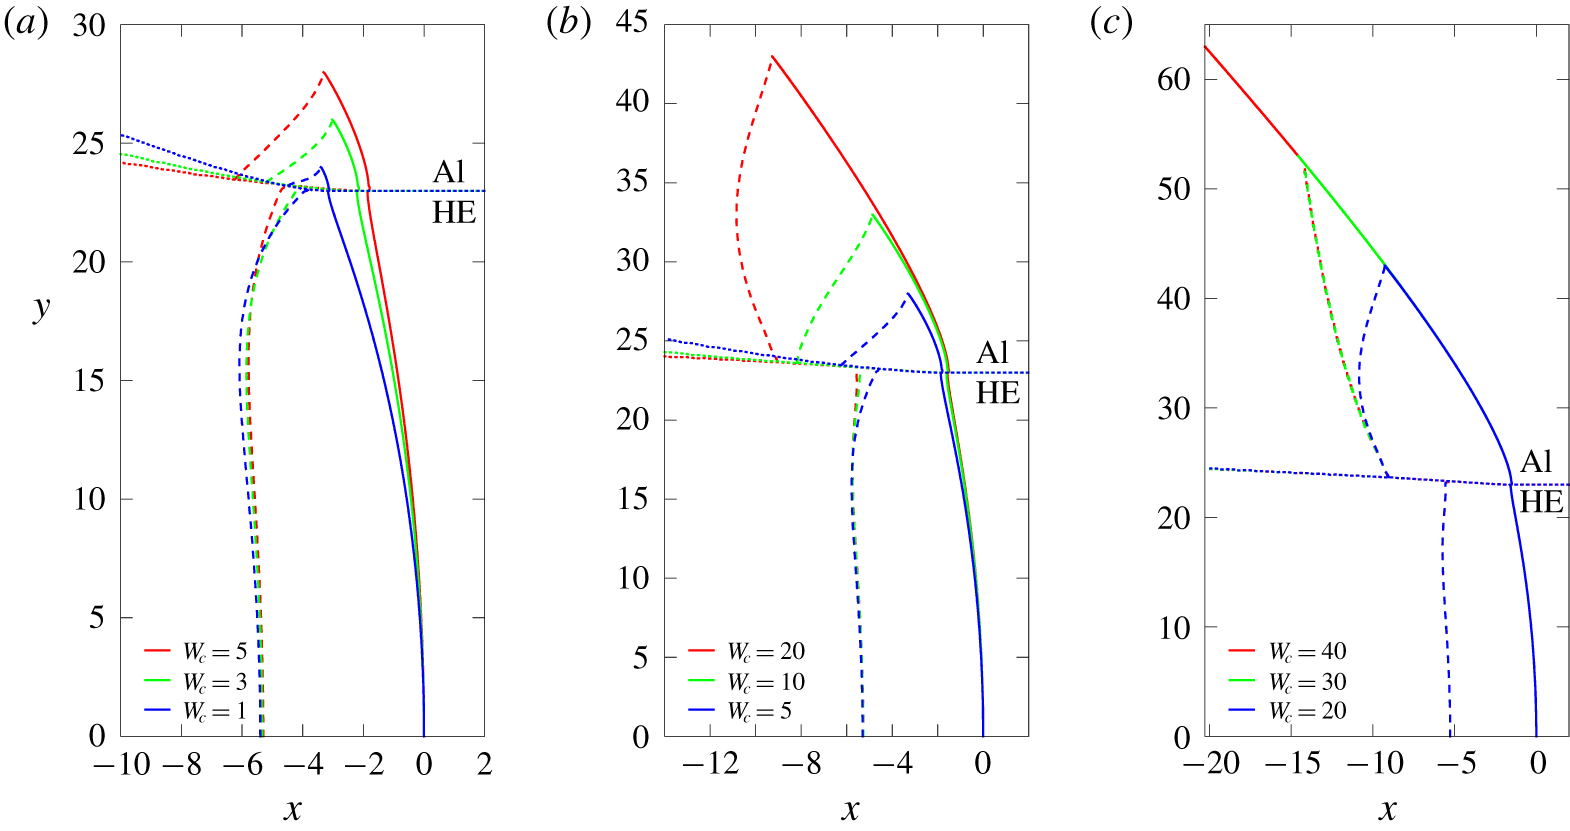
 $D_{0}$) behind the confiner shock in the Al. Figure 9 shows the corresponding DDZ structures in the HE, i.e. the region bounded by the HE detonation shock, HE sonic flow locus and the HE–Al interface, as well as the subsonic flow region in the Al, bounded by the Al confiner shock, Al sonic flow locus and the HE–Al and Al–air interfaces. For
 $W_{C}$ in the range 1–30, the subsonic flow region in the Al changes markedly with increasing Al confiner thickness. In response, the HE DDZ changes, in particular near the HE–Al interface, with more significant changes occurring for
 $W_{C}\leqslant 10$. We also observe that the degree of reaction progress near the HE–Al boundary increases as
 $W_{C}$ increases. Additionally, we note that even though the subsonic flow region in the Al changes significantly between
 $W_{C}=20$ and
 $W_{C}=30$, the effect on the DDZ appears to be small. The presence, shape and extent of the subsonic flow region in the Al explain the
 $D_{0}$ versus
 $W_{C}$ variation observed in figure 3, as we discuss below. From figure 9, the flow along the HE–Al boundary on the Al side is subsonic ahead of the Al sonic locus. Importantly, this region of the HE–Al interface extends beyond the sonic flow locus in the HE, where a transition occurs between subsonic and supersonic flow on the HE–Al interface on the HE side. We also note the change in convexity of the Al sonic locus going from thinner Al confiners to thicker ones. This is caused by the change in flow of information from the HE–Al and Al–air interfaces, again as we discuss below.
The shock (solid lines) and sonic flow (dashed lines) loci in the HE and Al regions, along with the HE–Al material interface trajectories (dotted lines), for (a)  $W_{C}=1$, 3 and 5, (b)
 $W_{C}=5$, 10 and 20 and (c)
 $W_{C}=20$, 30 and 40. The symmetry axis is along
 $y=0$. For each locus, the reference point has been set such that the HE detonation shock location along
 $y=0$ is
 $x=0$. In (c), the shocks and sonic loci for
 $W_{C}=20$, 30 and 40 in the HE region lie close together. The HE and Al regions contained within the shock and sonic flow loci for each Al thickness correspond to subsonic flow
 $M<1$ (relative to a steady frame travelling axially with detonation speed
 $D_{0}$).

Selected  $C^{+}$ and
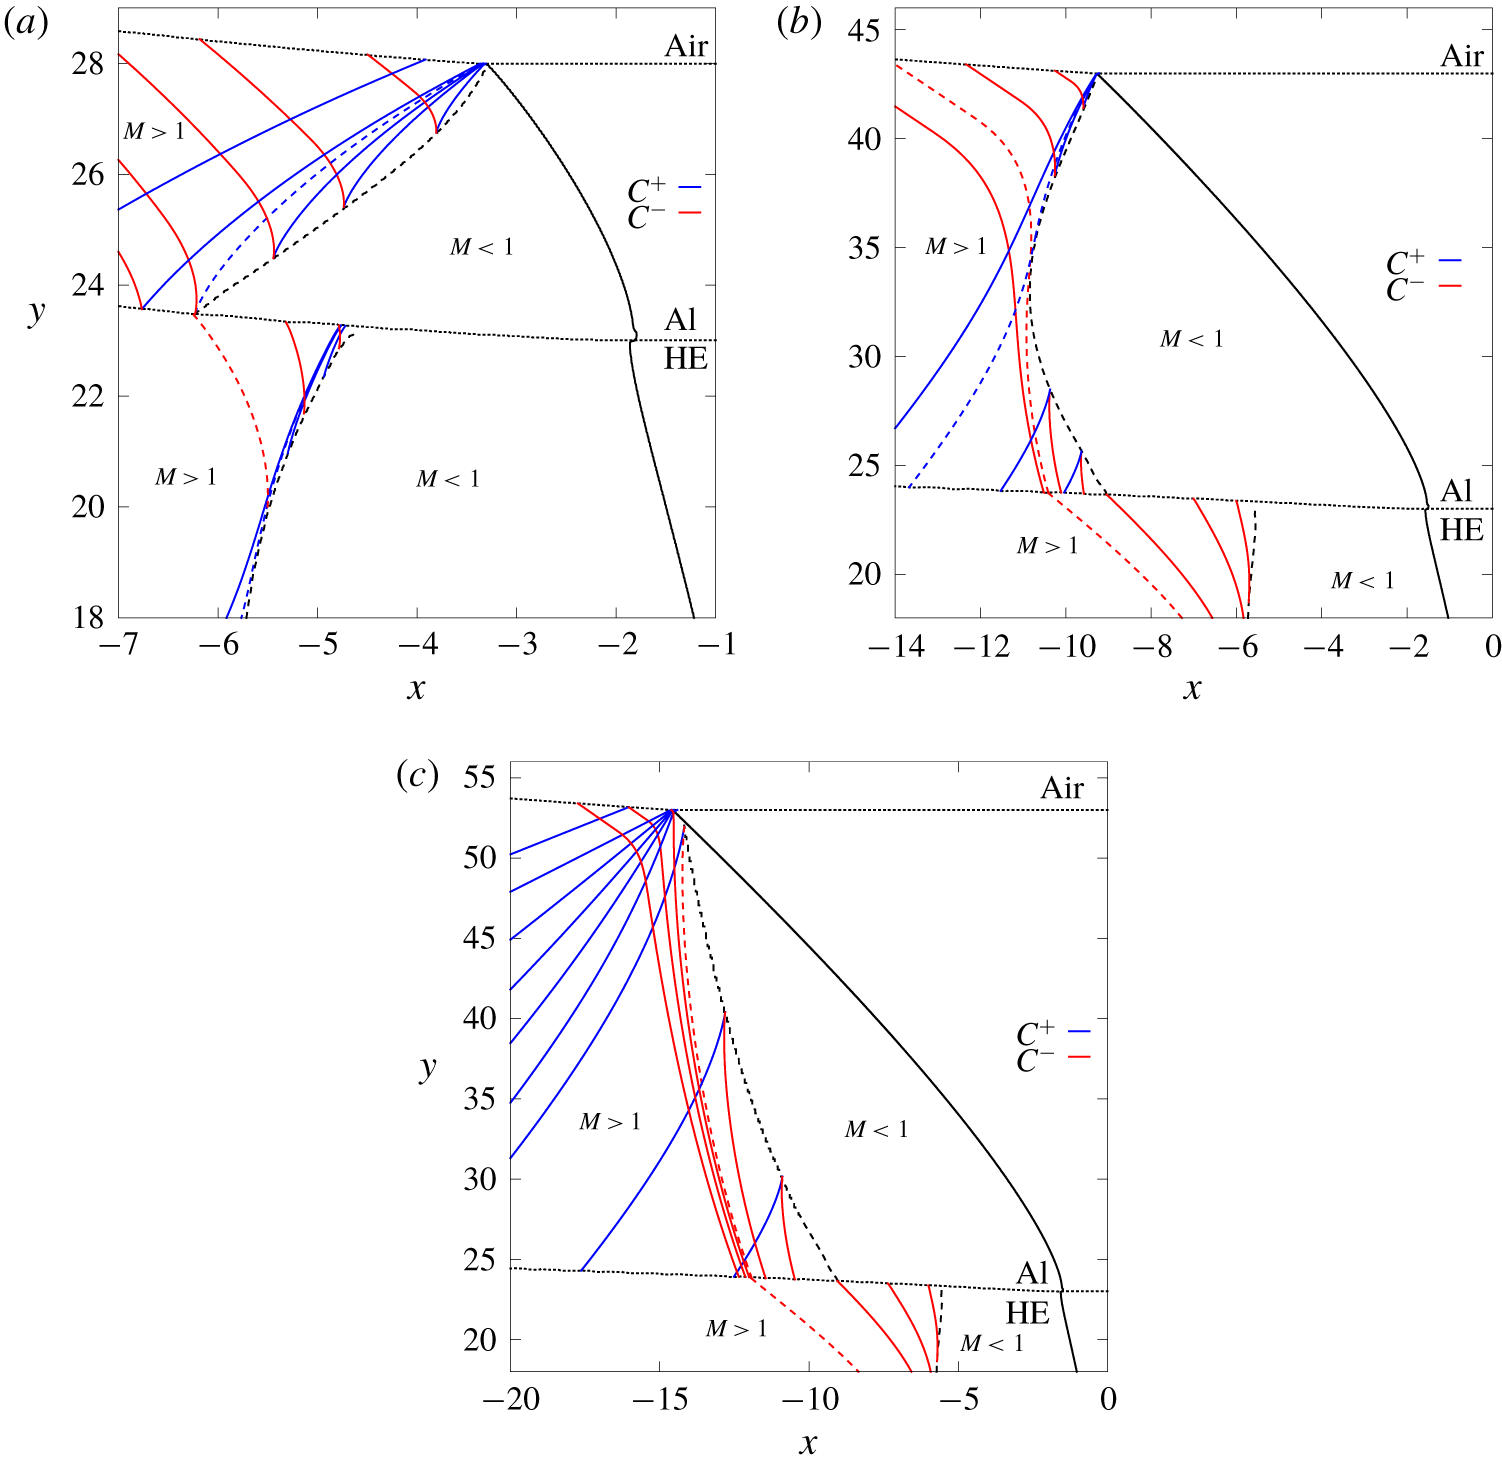
 $C^{-}$ characteristic paths in the supersonic flow regions of the Al confiner and HE (near the HE–Al interface) for (a)
 $W_{C}=5$, (b)
 $W_{C}=20$ and (c)
 $W_{C}=30$. The solid black lines are the HE and Al shocks, the dashed black lines are the sonic flow loci in the HE and Al regions, and the dotted black lines are the HE–Al and Al–air material interfaces. The dashed blue lines represent limiting
 $C^{+}$ characteristic paths, while the dashed red lines represent limiting
 $C^{-}$ characteristics. Supersonic and subsonic flow regions are indicated by
 $M>1$ and
 $M<1$, respectively.

In order to further explore these effects, figure 10(a) shows a selection of  $C^{+}$ and
 $C^{-}$ characteristic paths in the HE and Al confiner regions for
 $W_{C}=5$. Also shown are the shock shapes in the HE and Al regions, the HE–Al and Al–air interface shapes, and the sonic flow loci in the HE and Al regions. As noted above, there is a subsonic flow region in the Al whose structure is akin to the DDZ region in the HE. It is bounded by the Al confiner shock, the Al sonic flow locus, which intersects the Al shock at the Al–air interface, and the HE–Al interface. The position of the sonic locus in the Al at the HE–Al interface extends significantly beyond the position of the HE sonic locus at the HE–Al interface, and therefore the subsonic flow region in the Al is influenced by both the subsonic and supersonic regions of the HE flow state at the HE–Al interface. Significantly, we note in figure 7(c) for
 $W_{C}=5$ the presence of a reflected expansion fan at the intersection of the Al shock and Al–air boundary. From figure 10(a), a band of
 $C^{+}$ characteristics originating from the expansion fan at the Al–air interface propagate information from the Al–air interface into the sonic locus of the Al flow. For
 $W_{C}=5$, only these
 $C^{+}$ characteristics flow into the Al sonic locus. The dashed
 $C^{+}$ characteristic line in the Al shows the limiting characteristic bounding information carried from the Al–air boundary into the sonic locus. This
 $C^{+}$ characteristic intersects the Al sonic locus at the HE–Al boundary. Consequently, the Al–air boundary from which the expansion fan originates must have a significant effect on the subsonic flow structure in the Al. A band of
 $C^{-}$ characteristics carry information away from the Al sonic locus. For the HE, the DDZ receives information from the Al subsonic flow region across the HE–Al boundary where the flow on the HE side of the boundary is subsonic. However, as seen in figure 6(a) for SS confinement, there is also a small region of the HE–Al boundary beyond the HE sonic locus where
 $C^{+}$ characteristic paths propagate information from the supersonic flow region of the boundary into the HE sonic locus. Again, the region of influence of the DDZ structure is extended from the traditional definition based only on the HE sonic locus, and now includes the HE region bounded by the
 $C^{+}$ limiting characteristic up to the point where it intersects the HE sonic locus. There is also a band of
 $C^{-}$ characteristics that leave the HE sonic locus and deposit information on the HE–Al boundary, where the flow on the Al side is subsonic. The dashed
 $C^{-}$ characteristic line shows the limiting characteristic bounding information carried from the HE sonic locus into the HE–Al boundary where the flow on the Al side is subsonic. It intersects the HE–Al boundary at the point of intersection of the Al sonic locus, and consequently also the Al
 $C^{+}$ limiting characteristic, with the HE–Al boundary. Thus, even beyond the position of the HE
 $C^{+}$ limiting characteristic, the supersonic flow on the HE side of the HE–Al interface communicates with the Al subsonic flow region and consequently influences the region of the extended DDZ along the HE–Al interface. In short, for
 $W_{C}=5$, there is a very complex coupling between the subsonic regions in the Al and HE in which the flow at the HE–Al interface is highly influential in setting the flow structures in both regions. Significantly, due to the influence of the Al–air interface on the Al sonic locus, the phase speed
 $D_{0}$ is below the limiting
 $D_{0}$ value observed for larger Al confiners.
Selected  $C^{+}$ and
 $C^{-}$ characteristic paths for
 $W_{C}=20$ are shown in figure 10(b). This is for a case where
 $D_{0}=7.587$, essentially that of the limiting
 $D_{0}$ speed and where the HE DDZ structure for
 $W_{C}=20$ is close to that for
 $W_{C}=30$ and
 $W_{C}=40$. However, as we see from figure 10(b), the detonation cannot be considered fully independent of information propagation from the Al–air interface, although the effect of the Al–air interface is evidently weak. For
 $W_{C}=20$, the sonic locus in the Al confiner has changed convexity, and consequently characteristics flowing into the sonic surface now come from both the HE–Al and Al–air interfaces. There is a finite region of the HE–Al interface downstream of the Al sonic locus where Al
 $C^{-}$ characteristics carry information from the supersonic state at the interface into the Al sonic surface. The
 $C^{-}$ limiting characteristic shows the extent of the region of the HE–Al interface that influences the Al sonic flow structure. This
 $C^{-}$ characteristic is tangent to the Al sonic surface at the intersection point, before leaving the sonic surface and moving into the Al–air interface. Similarly, there are a subset of
 $C^{+}$ characteristics that are part of the expansion fan reflected off the Al–air interface that reach the Al sonic locus in a manner similar to that seen in figure 10(a). However, the region of supersonic flow originating at the Al–air interface from which Al
 $C^{+}$ characteristics impinge on the Al sonic locus is narrow, as observed by the path of the limiting
 $C^{+}$ characteristic. Consequently, we can infer from the effect on
 $D_{0}$ and the HE DDZ structure that the Al–air boundary effect is weak. The limiting
 $C^{+}$ characteristic is tangent to the sonic locus at the same point as the limiting
 $C^{-}$ characteristic. The domain of influence of the information propagation from the HE–Al and Al–air boundaries is formed by the combination of
 $C^{+}$ and
 $C^{-}$ limiting characteristics. For
 $W_{C}=20$, the subsonic flow along the HE–Al interface on the Al side extends far beyond the position of the HE sonic locus, and thus, as for
 $W_{C}=5$, the subsonic flow region in the Al is influenced by the subsonic and supersonic flow regions along the HE–Al interface on the HE side. In the HE, we again cannot detect, or it is sufficiently thin to be resolvable, a region of supersonic flow downstream of the sonic locus in the HE that carry
 $C^{+}$ characteristics into the HE sonic locus. Thus the effective DDZ is close to that defined by the traditional sonic locus flow in the HE. However, we again observe a finite band of
 $C^{-}$ characteristics that leave the HE sonic locus and deposit information on the HE–Al boundary, whereby information is then either fed into, or directly influences, the Al subsonic flow region. The
 $C^{-}$ characteristic closest to the HE sonic line originates from the HE sonic locus at a non-zero value of
 $y$. The remaining three
 $C^{-}$ characteristics shown all originate from the HE sonic line from within an expansion fan that exists on the HE symmetry line (
 $y=0$). The dashed HE
 $C^{-}$ characteristic line shows the limiting characteristic bounding information that can influence the Al subsonic flow region. In this case, it intersects the HE–Al boundary at the point of intersection of the Al
 $C^{-}$ limiting characteristic, i.e. with the last Al
 $C^{-}$ characteristic propagating information from the HE–Al boundary into the Al sonic locus.
The final case we show is for  $W_{C}=30$. In this case, the subsonic flow region in the Al has detached from the Al–air boundary (figure 10c). The detonation phase speed
 $D_{0}$ has reached its saturation point (
 $D_{0}=7.587$), in which there is no longer any influence on the detonation from the Al–air interface. From figure 10c, the Al sonic flow position increases monotonically in
 $x$ from the point of its intersection with the Al shock to its intersection with the HE–Al boundary. The only Al characteristic paths impinging on the Al sonic locus are
 $C^{-}$ characteristics originating downstream of the Al sonic locus from the HE–Al boundary. The
 $C^{-}$ limiting characteristic is shown, marking the extent of the supersonic region of the HE–Al boundary that influences the Al sonic locus. All
 $C^{+}$ characteristics on the Al sonic locus carry information away from the sonic locus into the HE–Al boundary. Likewise,
 $C^{+}$ characteristics originating from the fan region at the intersection point of the Al shock and Al–air boundary carry information away from the Al sonic locus. Consequently, there is no longer any influence of the Al–air boundary on the subsonic flow regions in the HE and Al materials. This explains why, even though there is subsonic flow in the Al, the effect of the Al confiner thickness on the detonation flow has saturated. Nevertheless, the interaction between the Al and HE subsonic regions remains highly complex. As before, the subsonic flow region in the Al is affected by the HE flow state at the HE–Al interface (being subsonic upstream of the HE sonic locus and supersonic downstream of the locus) over the extent from the Al
 $C^{-}$ limiting characteristic to the Al shock. Again, there is a finite band of HE
 $C^{-}$ characteristics similar in properties to that seen for
 $\text{Al}=20$ that leave the HE sonic locus and deposit information on this HE–Al boundary region, whereby information is then either fed into, or directly influences, the Al subsonic flow region. The Al subsonic region then communicates with the HE region across the HE–Al interface where the HE state at the HE–Al interface is subsonic (again, for
 $W_{C}=30$, we do not detect a region of supersonic flow behind the HE sonic locus that carries
 $C^{+}$ characteristics into the HE sonic locus). For further increases in the Al confiner thickness, the region of influence of the characteristic impingement on the Al sonic locus remains unaltered, and thus the HE DDZ and Al subsonic flow regions are not affected by further Al confiner thickness increases (see figures 8c and 9c for
 $W_{C}=40$). Although significantly more complicated than the supersonic confiner flow seen for SS, the influence of the Al confinement can be adequately explained by the above characteristic path analysis.
4 Summary
We have conducted the first detailed study of detonation confinement for steady 2-D flow involving both shock-driven, subsonic and supersonic confiner flow for varying confinement thickness  $W_{C}$. Confinement of the high explosive detonation by stainless steel results in supersonic flow behind the confiner shock. The axial detonation phase speed
 $D_{0}$ increases rapidly with increasing SS confiner thickness, but saturates for confinement thicknesses comparable to a detonation reaction zone size. A characteristic path analysis reveals that even for supersonic confiner flow, the confinement dynamics is complex, due to the influence of information flow from the supersonic regions of the HE–SS boundary on the HE side into the sonic locus of the detonation driving zone. The saturation of the detonation phase speed results from the change in reflection dynamics of the expansion fan from the SS–air interface as the SS confiner thickness increases.
For aluminium confiners,  $D_{0}$ increases more slowly with increasing Al confiner thickness and even for moderately thick confiners,
 $D_{0}$ remains dependent on
 $W_{C}$. In contrast to SS confinement, the flow behind the oblique Al shock is now shown to be subsonic. The communication of information between the subsonic flow regions in the HE and Al is highly complex due to the longer length of the Al subsonic flow region along the HE–Al interface than the HE subsonic flow region. For thinner Al confiners, the propagation of information from the Al–air boundary strongly influences the Al subsonic flow structure, underlying the dependence of
 $D_{0}$ on Al thickness, while for thicker Al confiners the propagation of information from the HE–Al boundary strongly influences the Al subsonic flow structure. For sufficiently thick Al confiners, the Al subsonic flow region detaches from the Al–air boundary, the influence of the Al–air boundary is lost, and
 $D_{0}$ saturates. To the authors’ knowledge, this is the first time a characteristic path analysis has been used to examine confiner flow influence on the propagation of a finite-length detonation. The present analysis leads to several new insights into the physics of how confinement affects detonation propagation.
Although the above results have been presented for one HE thickness, we have verified that the same qualitative behaviour is observed for other HE thicknesses, with the most relevant feature being whether supersonic or subsonic flow is induced in the confinement region. In addition to Al, there are likely several other moderate density, detonation confinement materials, such as titanium (Short & Quirk Reference Short and Quirk2018), that can support subsonic, shock-driven flow. In addition to the confinement material properties, the occurrence of subsonic flow regimes will depend on the HE thickness, the HE detonation performance properties (ideal versus non-ideal), and both the confinement geometry and thickness. We therefore intend to conduct a follow-up study, exploring the subsonic flow confiner effect for other materials, although we do not expect to uncover any additional insights into the physics of how subsonic confinement flow affects detonation propagation beyond those captured in the present study. In addition, due to the results revealed in this paper, experiments are currently being formulated to confirm the role played by both subsonic and supersonic confiner flow as a function of varying confinement thickness  $W_{C}$.
Finally, our work has shown that for oblique shock-driven flow in the confiner, the complexity of the information flow from the material boundaries as a function of the confiner thickness has a significant impact on the detonation-driving-zone structure properties, and thus on the detonation propagation speed. The nature of these non-local influences therefore has significant implications for the use of detonation surface wave propagation models, such as detonation shock dynamics (Bdzil & Stewart Reference Bdzil and Stewart2007; Stewart & Bdzil Reference Stewart and Bdzil1989), where often only a local flow–structure analysis near the detonation shock intersection point with the material interface is used to set the confinement boundary conditions. Theories on how to set appropriate boundary conditions for such models that account for confiner thickness, particularly for subsonic, oblique shock-driven flow, will require further analysis in light of the present results (see also Short & Quirk (Reference Short and Quirk2018)).
Declaration of interests
The authors report no conflict of interest.