Introduction
The hierarchical processing theory for the visual system suggests that visual information progresses serially through several synaptic stations by way of rostrally directed (feed-forward) projections (Hubel & Wiesel, Reference Hubel and Wiesel1968). At each station, horizontal connections reinforce the interplay between groups of neurons with similar properties (McGuire et al., Reference McGuire, Gilbert, Rivlin and Wiesel1991). Both feed-forward and intrinsic circuits contribute to the extraction of complex attributes of the visual scene at each successive processing stage (Lamme & Roelfsema, Reference Lamme and Roelfsema2000). The feed-forward connections are excitatory and make nonspecific synaptic contacts with different compartments of postsynaptic cells (Johnson & Burkhalter, Reference Johnson and Burkhalter1996). These connections are visuotopically organized, converging in clusters, and they are paramount for the receptive field properties of postsynaptic neurons (Lamme et al., Reference Lamme, Supér and Spekreijse1998; Sincich et al., Reference Sincich, Park, Wohlgemuth and Horton2004). Indirect feed-forward projections to area MT (via V2 and V3) contribute to the response to fast moving stimuli and for binocular disparity tuning (Ponce et al., Reference Ponce, Lomber and Born2008, Reference Ponce, Hunter, Pack, Lomber and Born2011).
The role of caudally directed (feedback) projections is less clear. It has been proposed that these connections are related to perceptual organization, attention, visual consciousness, memory, and sensory integration (Salin & Bullier, Reference Salin and Bullier1995; Payne et al., Reference Payne, Lomber, Villa and Bullier1996). Some studies have demonstrated the influence of feedback circuits on the receptive field properties of target neurons (Mignard & Malpeli, Reference Mignard and Malpeli1991; Alonso et al., Reference Alonso, Cudeiro, Pérez, Gonzalez and Acuña1993; Hupé et al., Reference Hupé, James, Payne, Lomber, Girard and Bullier1998; Wang et al., Reference Wang, Waleszczyk, Burke and Dreher2000; Galuske et al., Reference Galuske, Schmidt, Goebel, Lomber and Payne2002; Huang et al., Reference Huang, Chen and Shou2004), whereas others have not found any influence (Sandell & Schiller, Reference Sandell and Schiller1982; Hupé et al., Reference Hupé, James, Girard and Bullier2001). However, the exuberance of these connections between different cortical areas, the speed of electric signal propagation along these connections, and the latency of visual response all suggest that feedback connections may contribute significantly to receptive field properties (Bullier, Reference Bullier2001; Angelucci et al., Reference Angelucci, Levitt, Walton, Hupe, Bullier and Lund2002; Borra & Rockland, Reference Borra and Rockland2011). The feedback projections are divergent and have a crude topographical organization in the early visual areas (Sousa et al., Reference Sousa, Piñon, Gattass and Rosa1991; Rockland & Knutson, Reference Rockland and Knutson2000; Ungerleider et al., Reference Ungerleider, Galkin, Desimone and Gattass2008). They are excitatory and make synapses almost exclusively with excitatory postsynaptic cells at their dendrite spines (Johnson & Burkhalter, Reference Johnson and Burkhalter1996).
It has been suggested that some receptive field properties of cortical neurons, such as orientation selectivity and direction selectivity, may be attributed to the inhibitory influence of intrinsic circuits on incoming information (Sato et al., Reference Sato, Katsuyama, Tamura, Hata and Tsumoto1996; Crook et al., Reference Crook, Kisvárday and Eysel1998). The inactivation of intrinsic inhibitory processes impairs both orientation and direction selectivity (Sillito, Reference Sillito1975). In primary (V1) and secondary (V2) visual areas of monkeys and cats, the orientation and direction selectivity depend on the inhibitory influence of basket cells projecting to orientation- and direction-selective functional modules (Sato et al., Reference Sato, Katsuyama, Tamura, Hata and Tsumoto1995, Reference Sato, Katsuyama, Tamura, Hata and Tsumoto1996; Crook et al., Reference Crook, Kisvárday and Eysel1996, Reference Crook, Kisvárday and Eysel1997, Reference Crook, Kisvárday and Eysel1998). However, evidence indicates that excitatory intrinsic inputs also contribute to V1 orientation selectivity and direction selectivity (Sato et al., Reference Sato, Katsuyama, Tamura, Hata and Tsumoto1995, Reference Sato, Katsuyama, Tamura, Hata and Tsumoto1996). In the present work, we investigated whether feedback projections from area MT directly interfere with the orientation and direction selectivity of V2 neurons. We studied the receptive field properties of V2 neurons before and after the inactivation of a large topographically corresponding portion of area MT in the capuchin monkey (Cebus apella). Several aspects of the visual system of this New-World monkey, including photoreceptor distribution (Andrade da Costa & Hokoc, Reference Andrade da Costa and Hokoc2000), ganglion cell topography (Silveira et al., Reference Silveira, Picanço-Diniz, Sampaio and Oswaldo-Cruz1989), thalamic organization (Gattass et al., Reference Gattass, Oswaldo-Cruz and Sousa1978a,Reference Gattass, Sousa and Oswaldo-Cruzb, Reference Gattass, Oswaldo-Cruz and Sousa1979), morphology and physiology of the M and P ganglion cells (Silveira et al., Reference Silveira, Yamada, Perry and Picanço-Diniz1994; Yamada et al., Reference Yamada, Silveira and Perry1996; Lee et al., Reference Lee, Silveira, Yamada, Hunt, Kremers, Martin, Troy and da Silva-Filho2000), intrinsic circuitry of V1 (Amorim & Picanço Diniz, Reference Amorim and Picanço-Diniz1996, Reference Amorim and Picanço-Diniz1997), and the topographical characteristics of areas V1, V2, MT, and V4 (Gattass et al., Reference Gattass, Sousa and Rosa1987, Reference Gattass, Nascimento-Silva, Soares, Lima, Jansen, Diogo, Farias, Marcondes, Botelho, Mariani, Azzi and Fiorani2005; Rosa et al., Reference Rosa, Souza and Gattass1988; Fiorani et al., Reference Fiorani, Gattass, Rosa and Sousa1989; Piñon et al., Reference Piñon, Gattass and Sousa1998) have been studied for almost two decades, making this monkey a suitable experimental model for this project. Preliminary results have been published in abstract form Jansen et al. (Reference Jansen, Fiorani and Gattass2000).
Material and methods
Animals
Three adult male C. apella monkeys were used in once-weekly recording sessions for a total of 18 sessions. All experimental protocols were conducted following NIH guidelines for animal research and were approved by the Committee for Animal Care and Use of the Instituto de Biofísica Carlos Chagas Filho, Federal University of Rio de Janeiro (2011).
Preparation
A head bolt and a recording chamber were implanted on the skull under anesthesia and aseptic conditions prior to the recording sessions. We positioned the recording chamber to enable access to areas MT and V2 using stereotaxic coordinates and the position of the cortical sulci. During each recording session, anesthesia was induced with a 5% ketamine hydrochloride solution (Ketalar®; Parke Davis, Rio de Janeiro, RJ, Brazil; 30 mg/kg, i.m.) and maintained with a mixture of 70% nitrous oxide and 30% oxygen combined with a continuous intravenous infusion of fentanyl citrate (0.003 mg/kg/h). Monkeys were also immobilized with pancuronium bromide (0.1 mg/kg/h). The Electrocardiogram, body temperature, and end-tidal CO2 were monitored continuously. Postsurgical analgesia was applied for 3 days with a fentanyl skin patch (Durogesic®; Janssen-Cilag, São Paulo, SP, Brazil).
Recording sessions
To locate the topographically corresponding portions of areas MT and V2, we penetrated the cortex with 1-MΩ impedance tungsten microelectrodes using stereotaxic coordinates and sulcal landmarks (Gattass & Gross, Reference Gattass and Gross1981; Rosa et al., Reference Rosa, Souza and Gattass1988; Fiorani et al., Reference Fiorani, Gattass, Rosa and Sousa1989). The corresponding MT and V2 stereotaxic coordinates were used to allow access to the central lower field representation of areas MT and V2 in subsequent recording sessions.
After the corresponding topographical site was localized in area V2, the single microelectrode was replaced by a two-electrode recording system (800 μm interelectrode distance). The activity was amplified and filtered, and single spikes were sampled by a waveform discriminator system (SPS-8701; Signal Processing System, Malvern, Australia). Extracellular single-unit spike events were stored using CORTEX software (Laboratory of Neuropsychology, NIMH/NIH, Bethesda, MD) for off-line analysis. The receptive fields were initially localized and mapped using a hand-plot mapping procedure.
The receptive field automatic mapping procedure was based on computing the latency-corrected neuronal activity in response to elongated bars moving in one of eight directions of motion. Initially, peristimulus time histograms (PSTHs) were computed based on 15–20 stimulus presentations using a bin width of 10 ms. Fig. 1A illustrates the PSTHs of a single unit in response to bars moving at 0 and 180 degrees direction of motion. Single-trial spike trains used to produce the PSTHs were aligned to stimulus onset. The PSTHs were then smoothed, using a normal convolution filter of 60-ms time window, resulting in the time spike density function (TSDF). The TSDF better characterizes the dynamics of neuronal firing pattern because it is a continuous and derivable function (Fig. 1B—thick lines).
Schematic diagram of the steps used to automatically map visual receptive fields. (A) PSTHs; (B) original TSDF and TSDF corrected for delay; (C) time-corrected TSDF for each direction; (D) SSDF in spatial coordinates (from each direction); (E) sum of the SSDF for the axis of movement and SSDFs for each direction (dashed line, arbitrary threshold = 50%); (F) smeared SSDF for one axis of movement; (G) quantitative receptive field map of a pandirectional cell; (H) quantitative receptive field map of a bidirectional cell (for details, see text).

The TSDF function is expressed by:

where,  is the average number of spike in each bin (ki, number of spikes in the bin; n, number of trials; Δ, bin size).
Sensory transduction and synaptic delay impose latency in V1 neuronal response. In order to enable the transformation of the TSDF into the Space Spike Density Function (SSDF), we were required to estimate the response latency of the neuron and thereby correct the TSDF accordingly. As observed in Fig. 1B and 1C, the TSDFs (thin and dotted lines for the 0 and 180 degrees directions of motion, respectively) were shifted forward in time corresponding to the estimated 70-ms response latency of the neuron:

For the SSDF, this corresponds to a correction in the space domain. Thus, in order to integrate the spike density functions (SPFs) at the space domain, the time-corrected functions obtained for bars moving in opposite directions were flipped along the horizontal axis (Fig. 1D), resulting in the following space function:

The product nΔ corresponds to the duration of the trial, and the factor (nΔ−t) allows the transformation of the time function into a space function.
The averaged TSDFs for one particular axis of movement were thereby converted from time to spatial coordinates (Fig. 1E). Observe that the SSDF obtained for one axis of motion cannot provide information regarding receptive field position for the orthogonal axis. Therefore, the SSDF obtained for the 0–180 degrees axis of motion was smeared (stretched) throughout the 90–270 degrees axis (Fig. 1F). The interpolation of the smeared SSDFs in the space domain for each axis of movement was then used to reveal the location of the peak neuronal firing (Fig. 1G). Averaging was performed pixel by pixel after aligning together all individual backprojections at the proper orientation, resulting in an averaged backprojection of the neuronal response, named here the quantitative receptive field map. The averaged backprojection was then smoothed by a two-dimensional normal convolution with a 60-ms time window. A quantitative receptive field map reveals both the size and the location of a single-unit receptive field. Quantitative maps for a pandirectional cell and a bidirectional cell are shown in Fig. 1G and 1H, respectively.
Spontaneous activity was calculated as the average firing rate during the 700 ms preceding the stimulus motion in each trial. A polargram describing the axis-of-movement and orientation selectivity was also obtained for each neuron.
Visual stimulation
Prior to the recording session, a gas permeable contact lens was used to focus the eyes on a computer monitor placed 57 cm in front of the animal. The positions of the blind spot and fovea were plotted onto the computer screen using a reversible ophthalmoscope. The stimulus consisted of a thin white bar (18 × 0.5 degrees) that appeared in four random orientations (0, 45, 90, or 135 degrees), crossed the screen in a direction perpendicular to its orientation with a velocity of 6 deg/s, and passed through the receptive fields of all the recorded neurons. We continuously tested the direction of motion selectivity before and after GABA injection. Note that we did not segregate orientation selectivity from axis-of-movement selectivity. Therefore, a moving bar in the configuration used to determine both the direction and axis-of-movement selectivity.
A full set of visual stimuli was presented prior to GABA injection. Area MT was then inactivated until virtually all recorded activity at the injection site was silenced. Data collection resumed immediately after the injection, and several blocks of recording protocols were acquired until the recovery of MT cellular activity. The recording sessions typically continued for 24–48 h.
Inactivation devices
After the inactivation site in area MT was located, a single microelectrode was replaced by an inactivation/recording system. Two different GABA injection systems were used. The first system consisted of four stainless steel tubes (external diameter of 200 μm) mounted around a large central tube (external diameter of 800 μm), which served as a guide tube for a tungsten microelectrode. One-microliter Hamilton microsyringes delivered the GABA solution to the four external stainless steel tubes though a polyethylene connection. With this system, it was possible to deliver 0.8 and 2 μl of a 0.25-mol/l GABA solution. The second injection system consisted of only one stainless steel tube (external diameter: 800 μm) attached to a tungsten microelectrode and connected to a microsyringe or a pneumatic picopump (Model PV 820; World Precision Instrument, Sarasota, FL). With this system, we performed 5- and 10-μl injections of a 0.25-mol/l GABA solution. The total external diameter of both injection systems was 1200 μm.
Inactivation paradigm
Recordings from areas MT and V2 were obtained before (control) and during several sequential time blocks at different time points (1–150 min) after GABA inactivation of area MT. The neuronal responses at the injection site and at the topographically corresponding region in area V2 were analyzed by comparing an effective direction-selective polar plot (polargram) with a poststimulus raster in a histogram plotted as the SPFs of the neuronal discharge.
Data analysis
To determine the statistical significance of the effects on V2 neuron direction selectivity before and after GABA injection into area MT, the cell activity under each condition was analyzed using a two-way analysis of variance (ANOVA). We also performed a statistical evaluation of the recovery after GABA injection by evaluating the cell activity in the control condition, before GABA injection and after the GABA-induced effects had vanished, using a two-way ANOVA. Finally, to determine the significance of changes in the directionality of V2 neurons in response to visual stimulation, data from each stimulus direction were submitted to a one-way ANOVA followed by a post hoc least significant difference test. The changes in V2 neuron direction selectivity before and immediately after GABA injection into area MT were also evaluated using a circular ANOVA (MATLAB toolbox; Mathworks Inc., Natick, MA). Probability values mentioned in the text, which were related to the changes in direction selectivity, were evaluated by ANOVA, unless specified otherwise.
Some cells that did not exhibit a statistically significant directional component showed instead a significant bidirectional response. By grouping the conditions with the same stimulus orientation moving in opposite directions, we tested the bidirectional component. The four groups of data generated by this procedure were then submitted to a one-way ANOVA to evaluate changes in the selectivity of the cell for axis of movement.
The selectivity of the neurons was examined using a standard test of circular tuning in order to determine the magnitude of the GABA-induced changes in both direction and orientation selectivity across the population. The orientation selectivity index (OI) was calculated for each neuron according to the following formula proposed by Sato et al. (Reference Sato, Katsuyama, Tamura, Hata and Tsumoto1996):

where Ri represents the magnitude of response to each stimulus orientation, 0i. The rate of spontaneous activity, which was measured for the 700-ms window before stimulus presentation, was subtracted from the stimulus-driven responses. The response to each stimulus orientation is expressed as a vector with direction 20i and length Ri. This index varies between 1 and 0. An OI value of 1 means complete selectivity to a particular orientation, while a value of 0 means equal responsiveness to all orientations.
Direction selectivity indices (DI) were also quantified by the directional index, as described by Wang et al. (Reference Wang, Waleszczyk, Burke and Dreher2000). An index of 1 indicates sharply tuned cells, whereas an index of 0 indicates nontuned cells. We used a paired Student’s t-test to evaluate changes in the mean OI and DI in the cell population. Using this test, we also evaluated the recovery time after the GABA injection by the comparing cell activity in the control condition, before the GABA injection and after the GABA-induced effects had vanished. In addition, we used the individual index values to reveal any bias in the population. We considered a change in the OI or DI of greater than 0.20 to be significant. Population bias was evaluated using the chi-square test.
To estimate the signal-to-noise ratio of the responses, we computed the ratio of the neuronal firing rate when the stimulus crossed the receptive field as compared to the firing rate when no stimulus was present over the receptive field. For this last case, four different situations: 1) before the stimulus crossed the receptive field, 2) after the stimulus crossed the receptive field, 3) before and after the stimulus crossed the receptive field, and 4) during no visual stimulation (spontaneous discharge).
Histological procedures
After a complete set of inactivation sessions, the animals were euthanized for histological processing and localization of the injection and recording sites. At the end of the last recording session, the animals were deeply anesthetized with sodium pentobarbitone (30 mg/kg) and perfused intracardially with saline followed by 2% paraformaldehyde in phosphate-buffered saline (PBS), 2% paraformaldehyde in PBS supplemented with 2.5% glycerol, PBS supplemented with 5% glycerol, and PBS supplemented with 10% glycerol. One animal was not perfused; instead, the brain was removed from the skull postmortem, immersed in a fixative solution for 72 h, and then cryoprotected in increasing concentrations of glycerol (2.5–30%). Frozen sections (70-μm thick) were cut on a cryostat and mounted on glass slides or kept in PBS at 4°C. Alternate sections were stained using Nissl (cresyl violet) or Gallyas. The sections were analyzed on a slide projector to determine the location of the electrode tracks.
Results
In total, 72 V2 neurons were studied during 18 sessions of GABA injection in area MT. GABA inactivation produced early and late effects on neuronal spontaneous activity and on the response properties of the V2 cells. The quantitative analysis of GABA inactivation shown below was based on the activity of a group of 50 neurons.
GABA inactivation of area MT produced an early and short (10–30 min) decrease in both spontaneous activity and responsiveness followed by a transitory change in the V2 neuronal direction selectivity. The difference in the time course of these effects resulted in an intermediate improvement (20–40 min) of the signal-to-noise ratio of the stimulus-driven activity. After a variable time period, this improvement disappeared. GABA inactivation in area MT produced an inhibitory effect, a significant change of direction tuning (chi-square test P = 0.006) and a loss of directional selectivity in most (72%) of the V2 neurons (ANOVA P < 0.05). During the 15 min following GABA inactivation, a clear inhibitory trend in the response pattern was observed. Additionally, 56% of the V2 neurons exhibited a significant change in directional selectivity.
For 6% (3/50) of the V2 neurons, a general suppression of activity was observed after GABA injection into area MT—even though no change in direction selectivity was observed. In three cells, GABA inactivation had no discernable effect on the direction or orientation selectivity.
GABA-induced inactivation
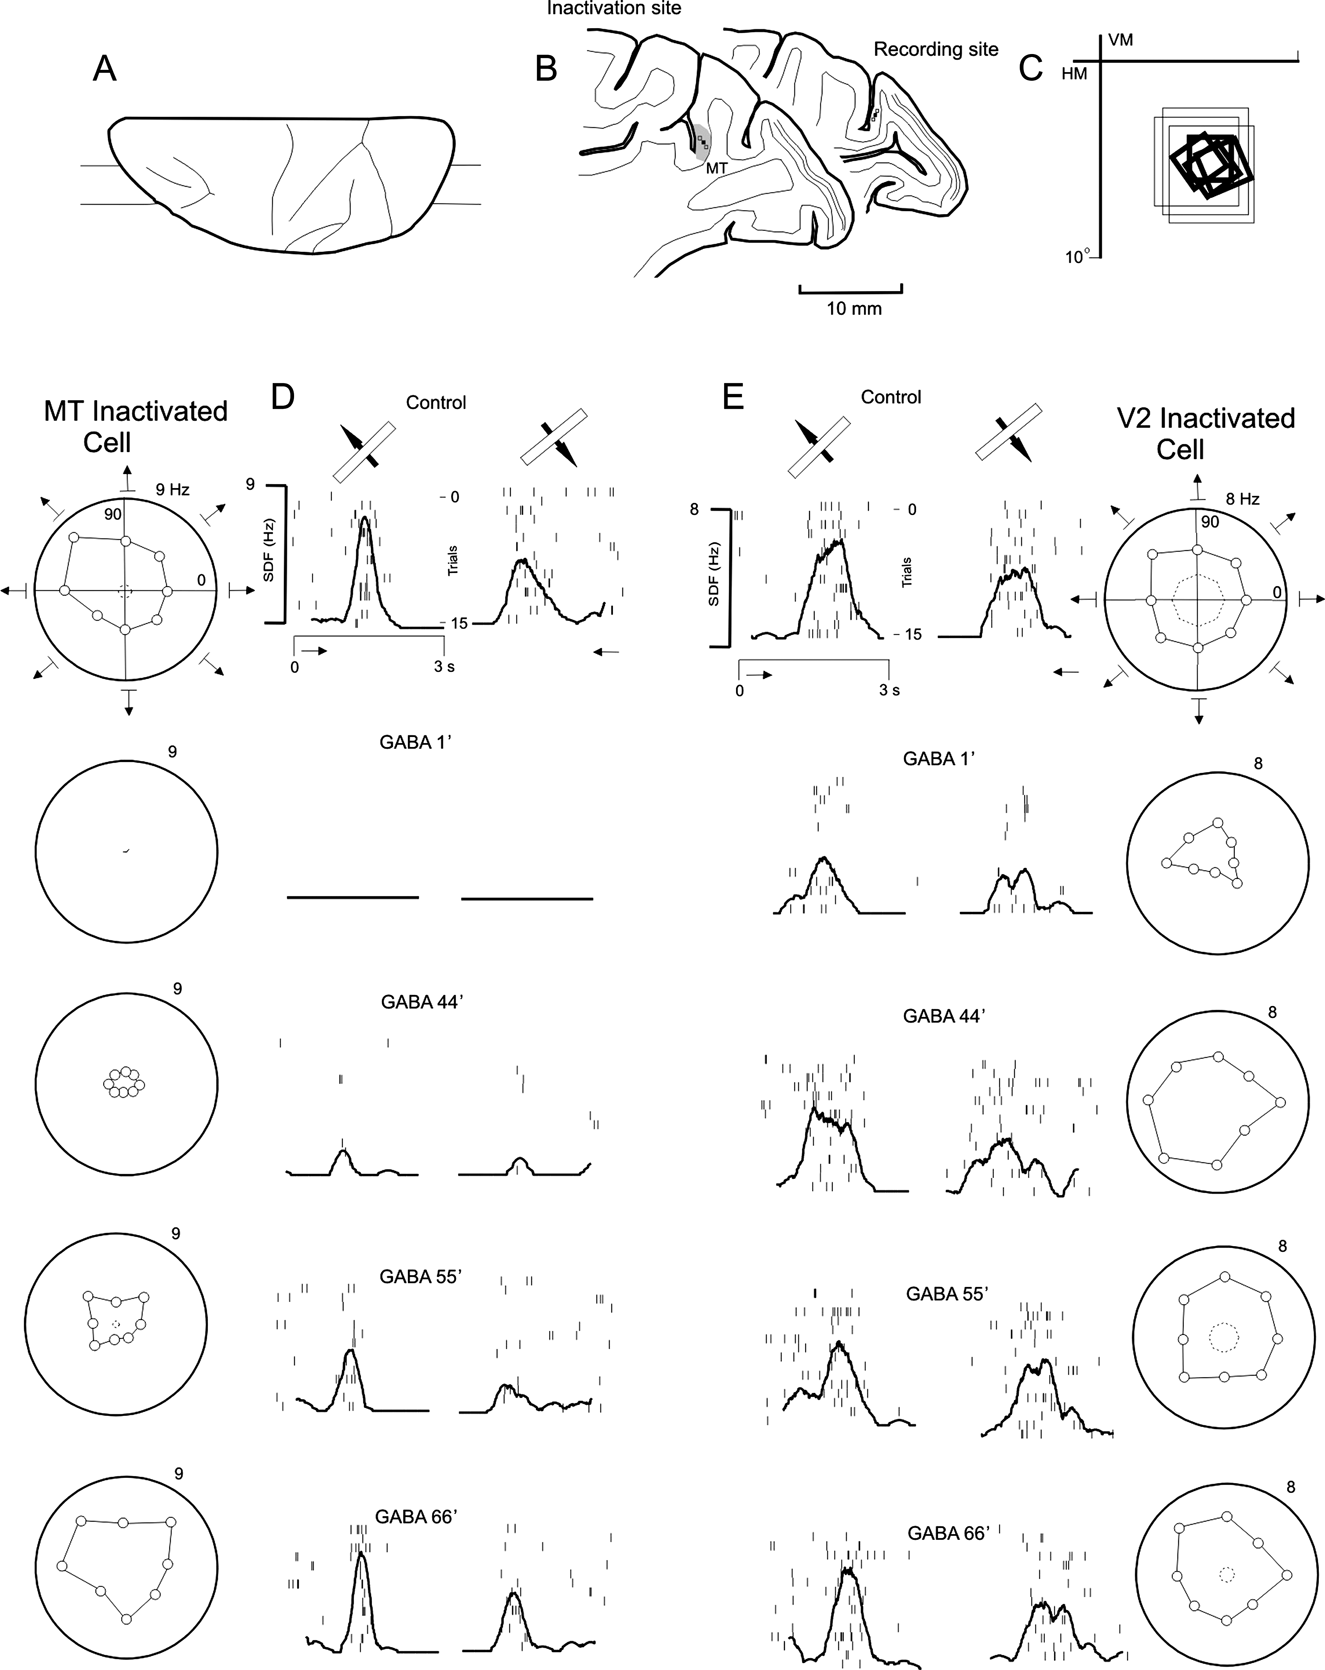
Fig. 2 illustrates typical recordings obtained in areas MT (Fig. 2D) and V2 (Fig. 2E) during GABA-induced inactivation of area MT. The MT and V2 neurons had receptive fields in topographically corresponding locations of the visual field (Fig. 2C; MT: thin rectangles, V2: thick rectangles). The polargrams and the SDFs for the best direction and orientation are presented (Fig. 2D and 2E) at concurrent recording intervals in both areas. Each row in Fig. 2D–2E presents recordings obtained during successive moments after GABA injection into area MT (column D) and at the corresponding time in area V2 (column E). The nondirection-selective MT neuron shown in Fig. 2D was entirely inhibited 1 min after a 2-μl injection of GABA (0.25 m) and the inhibition persisted for 22 min (P = 0.1). After 44 min, the activity began to recover and it returned to baseline 66 min after injection. Fig. 2E illustrates a nondirection-selective unit in a V2 neuron that became direction selective during GABA inactivation (P = 0.1). One minute after GABA injection, a pronounced decrease in the neuronal discharge in response to stimuli moving toward the bottom and toward the right of the visual field was observed and the cell became direction selective (P < 0.05). After 44 min, although the MT neuron was still nonresponsive, the V2 cell increased its spontaneous and stimulus-driven activity. Gradually, this V2 neuron regained the nondirection-selective properties observed during the control period (P = 0.8).
Effects of GABA inactivation of area MT on the visual response of a V2 neuron. Two parasagittal sections (B) at the level indicated in the dorsal reconstruction of a Cebus brain (A) show the approximate location of the recording sites (small squares) in areas MT and V2. The receptive fields of the neurons corresponding to the MT injection site (large rectangles) and the topographically corresponding region in the V2 (small rectangles) are shown in (C). A nondirection-selective cell recorded at the inactivation site in area MT (D) showed a fast inhibition (1 min after an injection of 10 μl of 0.25 mol/l GABA) and a slow recovery, whereas the V2 neuron showed concomitant significant changes in direction selectivity (E). Recordings from area MT (D) and area V2 (E) were obtained before (control) and at 1, 44, 55, and 66 min after the GABA injection. The neuronal responses at the injection site and at a topographically corresponding region in area V2 are illustrated by a direction-selective polar plot (polargram) and a poststimulus raster and histogram plotting the SDFs of the neuronal discharge. The polargrams depicted in the left of (D) (MT) illustrate the mean neuron firing rate elicited by bars moving in eight different directions. The polargrams represent the relative response magnitude to each direction of motion. Pairs of SDFs corresponding to the best and the opposite directions of motion are shown next to each polargram. These SDFs represent cellular activity in the space domain. Vertical ticks represent spikes and each line of spikes corresponds to the total span of visual stimulation during each trial. The thick black line represents the SDF, which was obtained from the Gaussian convolution (product summation) of the action potentials. The scale on the left indicates the spike rate, whereas the scale on the right indicates the number of trials. The right column (E) shows the response of a nonselective V2 cell recorded at the same time as the MT neuron. The V2 neuron had a more immediate inhibition (1 min after GABA injection) and a faster recovery when compared with the MT neuron. During area MT inactivation, the V2 cell became temporarily direction selective.

Time course of the GABA effect
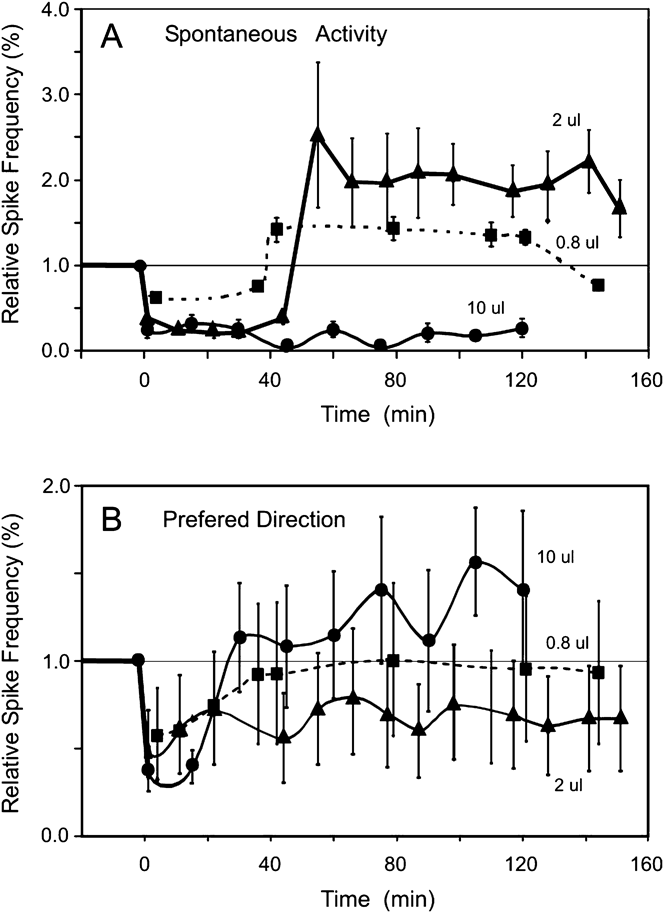
A roughly direct dose-dependent effect could be established between the amount of GABA injected in area MT and the suppression and subsequent recovery of spontaneous activity in the V2 cells. Fig. 3 shows the time course of this effect on the V2 neurons after various amounts (0.8–10 μl) of GABA were injected into area MT. For injections ranging from 0.8 μl (squares) to 2 μl (triangles), the spontaneous activity of V2 neurons decreased approximately 60% in 5 min. After a sustained suppression lasting 40 min, a rebound effect was observed, and the spontaneous activity reached double its original value. This increase persisted for approximately 80 min, and then the activity decreased back the control levels. Injections of 2 μl (triangles) were followed by a stronger and longer-lasting inhibition compared to the 0.8-μl injections (squares). The increase in the spontaneous activity after inhibition was larger for the 2-μl injection. Injections of 0.8 and 2 μl were followed by an immediate 50% decrease in the response to the best orientation or direction. The strength of the response varied over the following 100 min and returned to basal levels at approximately 150 min. The effect on spontaneous activity did not correlate with the strength of the response, and these two aspects had different time courses. We observed a lower signal-to-noise ratio during the 20–40 min following the injection. During this period, only a small increase in the magnitude of the response to the stimulus in the preferred direction was observed; however, a decrease in the spontaneous activity also occurred. The effect on the strength of the preferred direction also varied with the amount of GABA injected. The 2-μl injection induced a stronger and longer-lasting decrease in the strength of the response than the 0.8-μl injection. Injection of more GABA appeared to have a saturating effect, and the degree of inhibition was unpredictable. As shown in Fig. 3, a 10-μl injection was followed by a decrease in spontaneous activity to about 20% of the original level, and this decrease fluctuated without recovery for 120 min. The strength of the response to a stimulus in the preferred direction decreased by 60% during the first 20 min and then increased to 130% over the baseline at about 120 min.
Effects of GABA injected into area MT and the time course of changes in the spontaneous (A) and driven activity (B) of 18 neurons in area V2. On average, the 0.8-μl (squares) and 2-μl (triangles) injections had effects different from those of the 10-μl injection (circles). Injections of 2 μl induced an immediate decrease in the response in the preferred direction (B) as well as a decrease in spontaneous activity (A). After the immediate general decrease in activity, an increase in spontaneous activity was observed, whereas the response strength to the preferred direction returned to baseline (for details, see text). Injections of 10 μl induced a long-lasting decrease in the spontaneous activity.

Population tuning
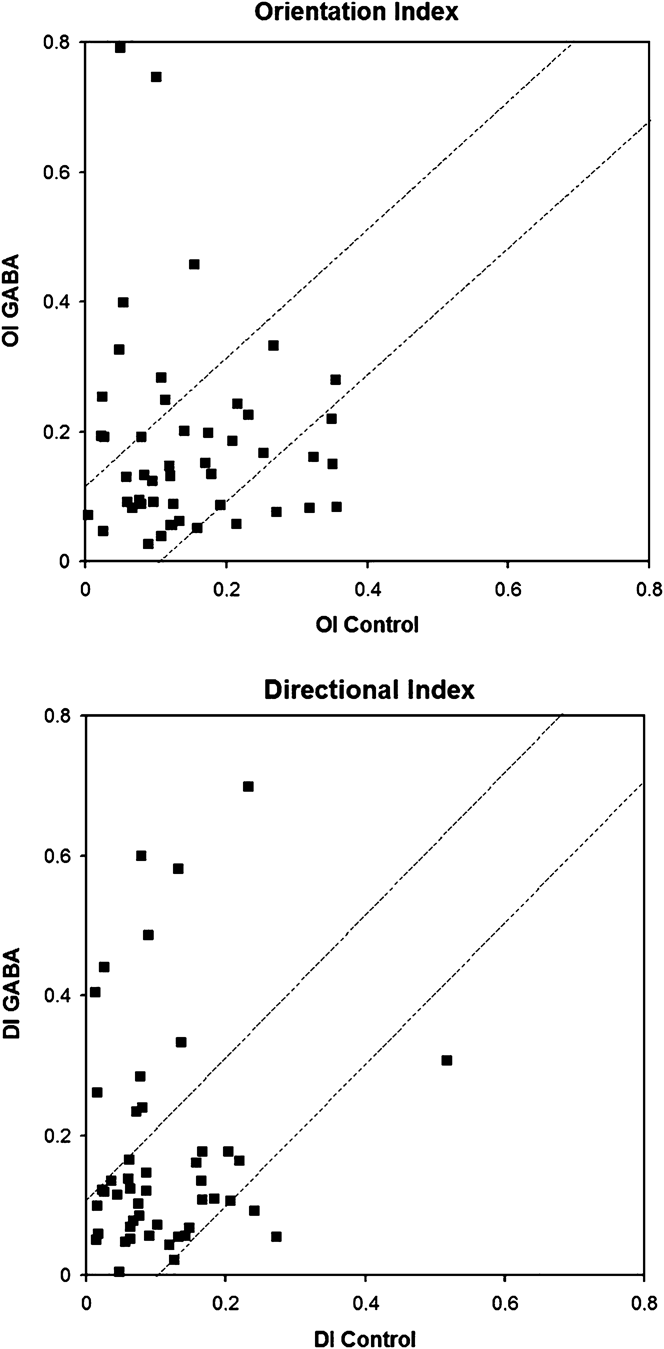
Both increase (31/50) and decrease (19/50) of direction tuning were observed in the V2 neurons. In addition, some cells significantly changed their orientation selectivity. However, a significant change in the mean orientation tuning of the V2 neurons was not observed after GABA inactivation in area MT. When a change greater than 0.2 was used as the criterion, only 19 neurons (38%) altered their direction or orientation circular tuning.
Fig. 4 shows changes in the direction and orientation tuning of 50 V2 cells after GABA-induced inactivation of the topographically corresponding portion of area MT. When changes greater than 0.2 were used as the criterion, only 19 neurons (38%) changed their direction or orientation tuning. Cells also significantly changed their orientation, but a significant change in the mean orientation tuning of the V2 neurons was not observed after GABA-induced inactivation of area MT (chi-square test P = 0.08). V2 cells tended to increase the DI with GABA-induced inactivation of area MT. The mean directional tuning index was also significantly changed (chi-square test P = 0.006).
Changes in the direction and orientation tuning of 50 V2 cells. (A) Correlation between the directional indices before (control DI) and after the GABA injection (GABA DI) into area MT. (B) Correlation between the orientation indices before (control OI) and after GABA injection (GABA OI). Broken lines with a slope of 1 represent the limits of significance for the changes in the indices (>0.2). A significant change in the DI and OI was observed for 38% of the cells. In addition, GABA injection tended to increase the DI.

V2 neurons that became selective with GABA
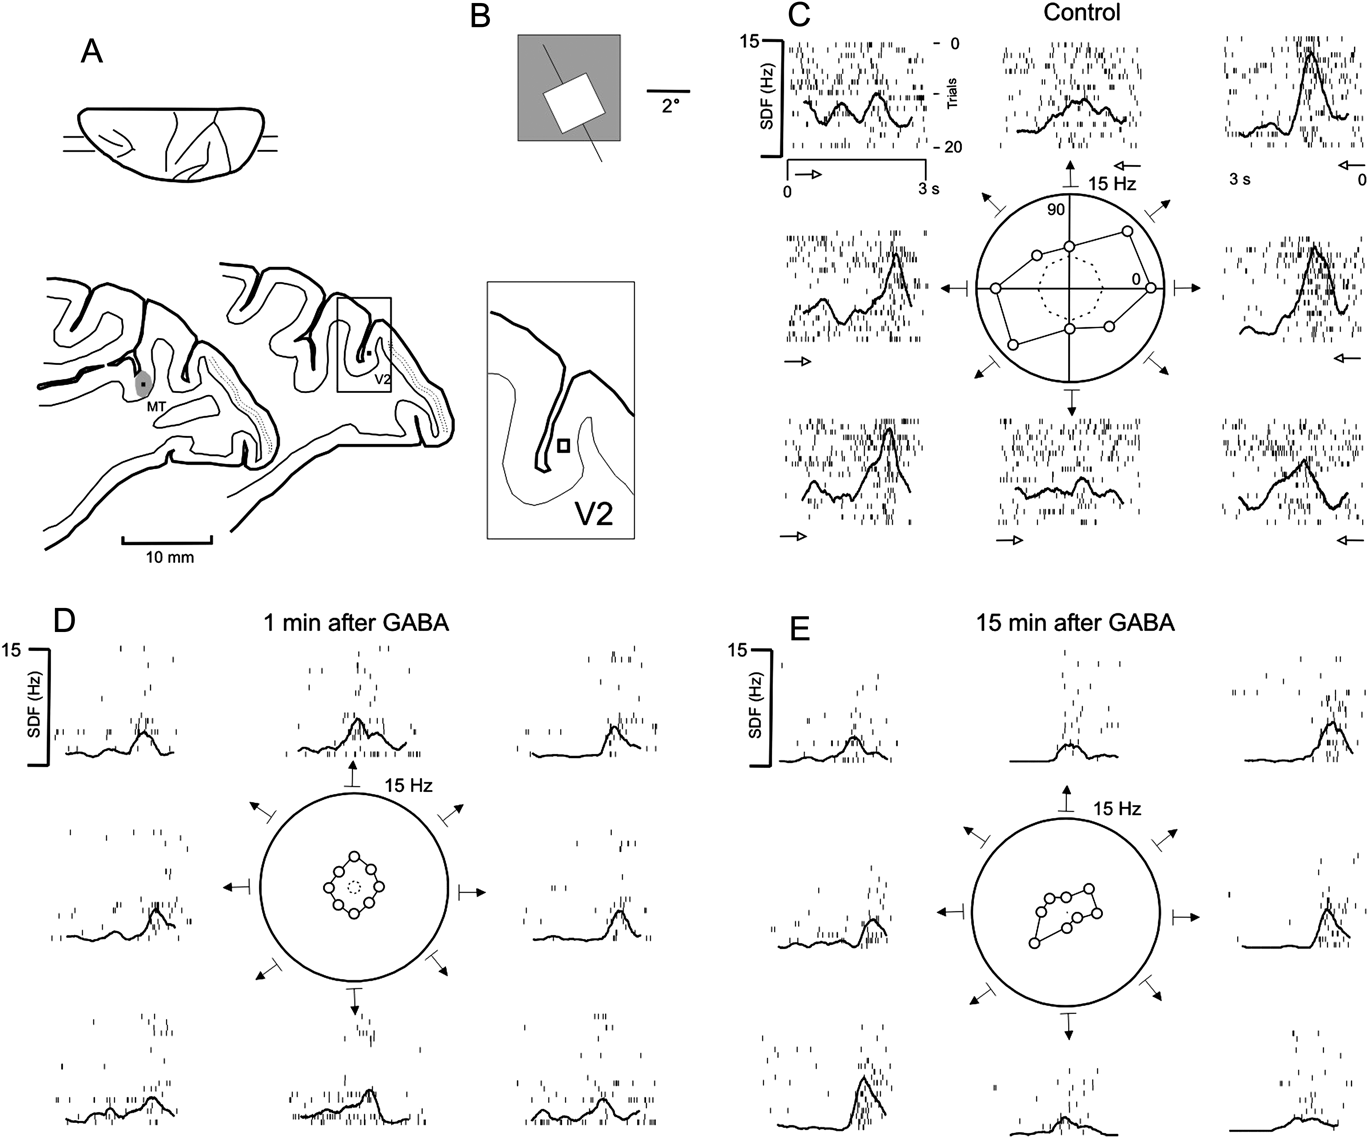
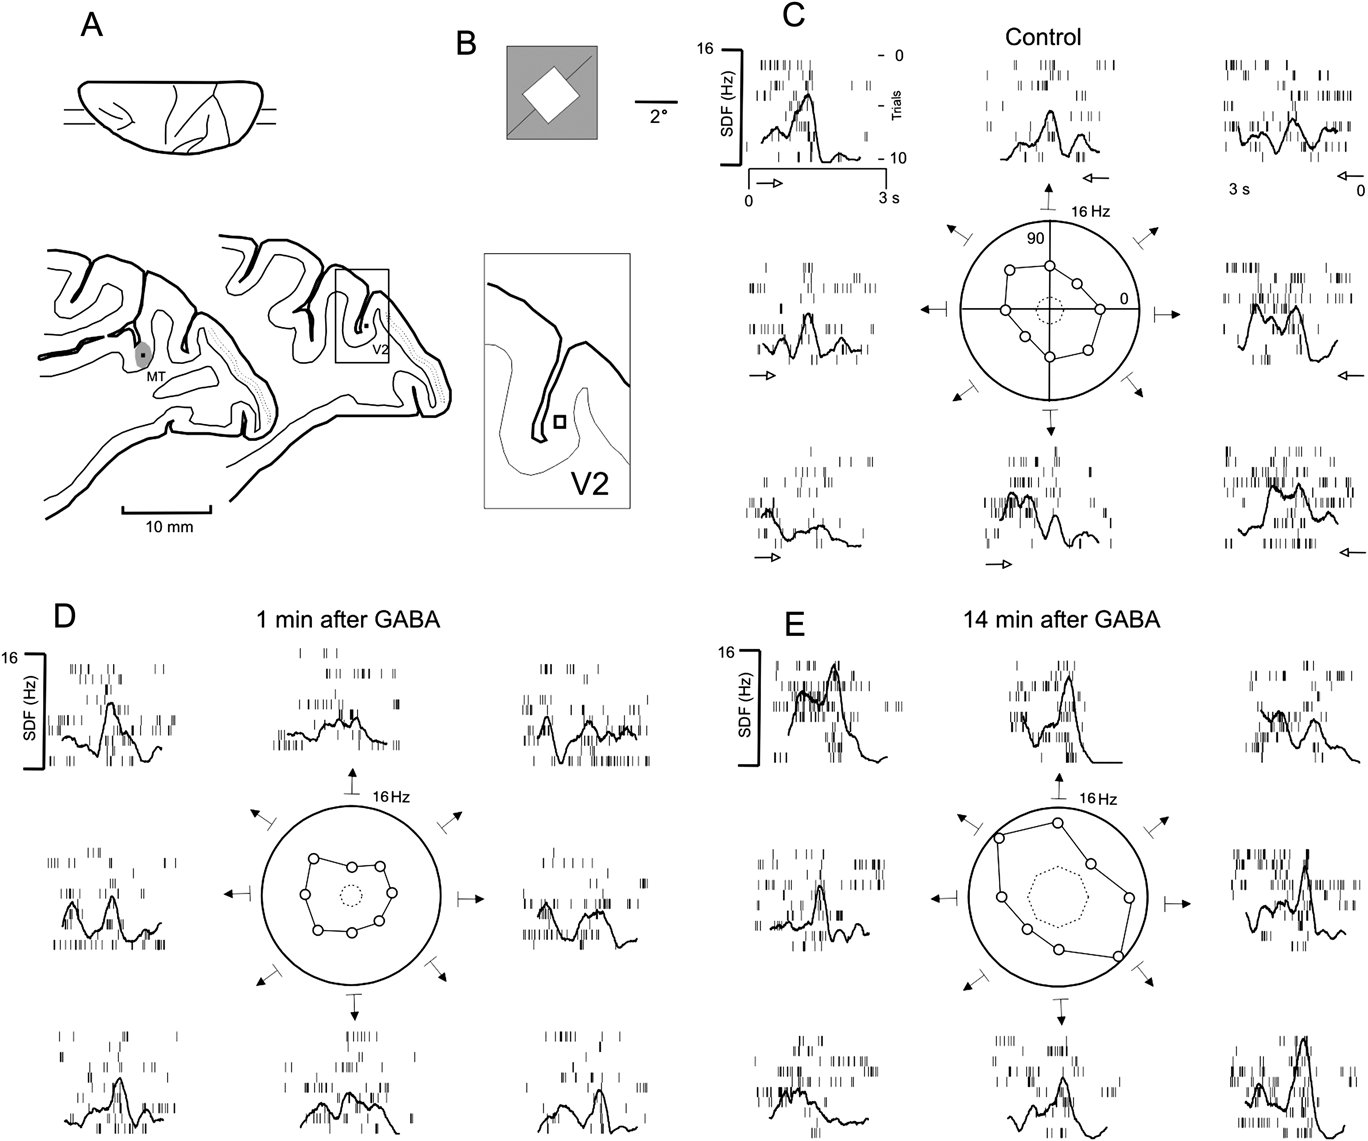
Fig. 5 illustrates the effect of GABA-induced inactivation of area MT on a V2 pandirectional neuron at three different time points: 1) before (Fig. 5C), 2) 1 min after (Fig. 5D), and 3) 50 min after (Fig. 5E) the injection (P = 0.1). Before the injection, the pandirectional V2 neuron had high spontaneous activity. It became directionally selective 1 min after a 10-μl injection of 0.25 mol/l GABA into area MT. Under GABA-induced inactivation, the unit acquired a bidirectional response pattern (P < 0.01), and an inhibitory flank could be observed when a bar moving at 180 deg was presented. This neuron returned to a nondirectional status 50 min after the GABA injection. Similar to the cell illustrated in Fig. 2, this neuron also showed a pronounced increase in the tuning of its response to a stimulus inside the classical receptive field during GABA inactivation. To estimate the signal-to-noise ratio, we computed the ratio between the neuronal firing rate when the stimulus crossed the receptive field and the firing rate when the stimulus was absent or traveling outside the receptive field. Each condition showed a significant increase in the signal-to-noise ratio between the activity before and 50 min after GABA injection into area MT (P < 0.001).
Change in the direction selectivity of a V2 neuron after GABA inactivation in area MT. Parasagittal sections of the site of inactivation in area MT and the recording sites in area V2 are shown in (A). The MT (large square) and V2 (small square) receptive fields are shown in (B). Polargrams and corresponding SDFs for the V2 neuron in the control condition and 1 and 15 min after GABA injection into area MT are shown in subsequent panels (C–E). The V2 neuron was originally pandirectional (P = 0.1) in the control condition (C), and it became direction selective (D) after an injection of 2 μl of 0.25 mol/l GABA into area MT (P < 0.01). Fifty minutes after the GABA injection (E), the cell recovered its directional profile (pandirectional, P = 0.2). Abbreviations and symbols are the same as in Fig. 2.

V2 neurons that lost direction selectivity with GABA
Figs. 6 and 7 illustrate the response of two V2 neurons that lost direction their selectivity as a result of GABA-induced inactivation in area MT (P < 0.01). These cells exhibited directional selectivity during the control condition and became pandirectional 1 min after GABA injection (P = 0.9 and P = 0.7 for the cells in Figs. 6 and 7, respectively). After 14–15 min, the cells recovered their directional selectivity (P < 0.01).
The loss of direction selectivity of a V2 neuron after GABA inactivation of area MT. Parasagittal sections of the site of inactivation in area MT and the recording sites in area V2 are shown in (A). The receptive fields within areas MT (large gray rectangle) and V2 (small white rectangle) are shown in (B). Polargrams and corresponding SDFs for the V2 neuron in the control condition and 1 and 15 min after GABA injection into MT are shown in subsequent panels (C–E). Representative V2 neurons that exhibited directional selectivity in the control condition (P < 0.01) lost selectivity and became pandirectional 1 min after GABA injection (2 μl, 0.25 mol/l) (P = 0.9). This cell partially returned to its previous level 15 min after the GABA injection, recovering its direction selectivity (P < 0.01). Abbreviations and symbols are the same as in Fig. 5.

Loss of direction selectivity of a V2 neuron after GABA inactivation of area MT. A representative V2 neuron that showed direction selectivity in the control condition (P < 0.01) and subsequently lost direction selectivity (P = 0.7) 1 min after GABA injection (2 μl, 0.25 mol/l), becoming a pandirectional neuron, is shown. Fifteen minutes after the GABA injection, the cell recovered its direction selectivity (P < 0.01). Layout, abbreviations, and symbols are the same as in Fig. 5.

In addition, GABA treatment of MT cells, including those referred to above, resulted in an increase in the signal-to-noise ratio of V2 neurons. Fifteen minutes after MT inactivation, V2 neurons regained direction selectivity tuning, albeit with changes in spontaneous and visual stimuli-driven activity. In the electrophysiological activity presented in Fig. 6, the signal-to-noise ratio increased significantly after GABA injection (P < 0.01) concurrently with an increase in spontaneous activity (P < 0.05). A similar effect was observed for the cell illustrated in Fig. 7. In this cell, the signal-to-noise ratio improved 14 min after GABA treatment as compared to the control condition (P < 0.05). This increase appeared more pronounced for the 135 and 315 degrees movement directions.
Spontaneous activity and responsiveness
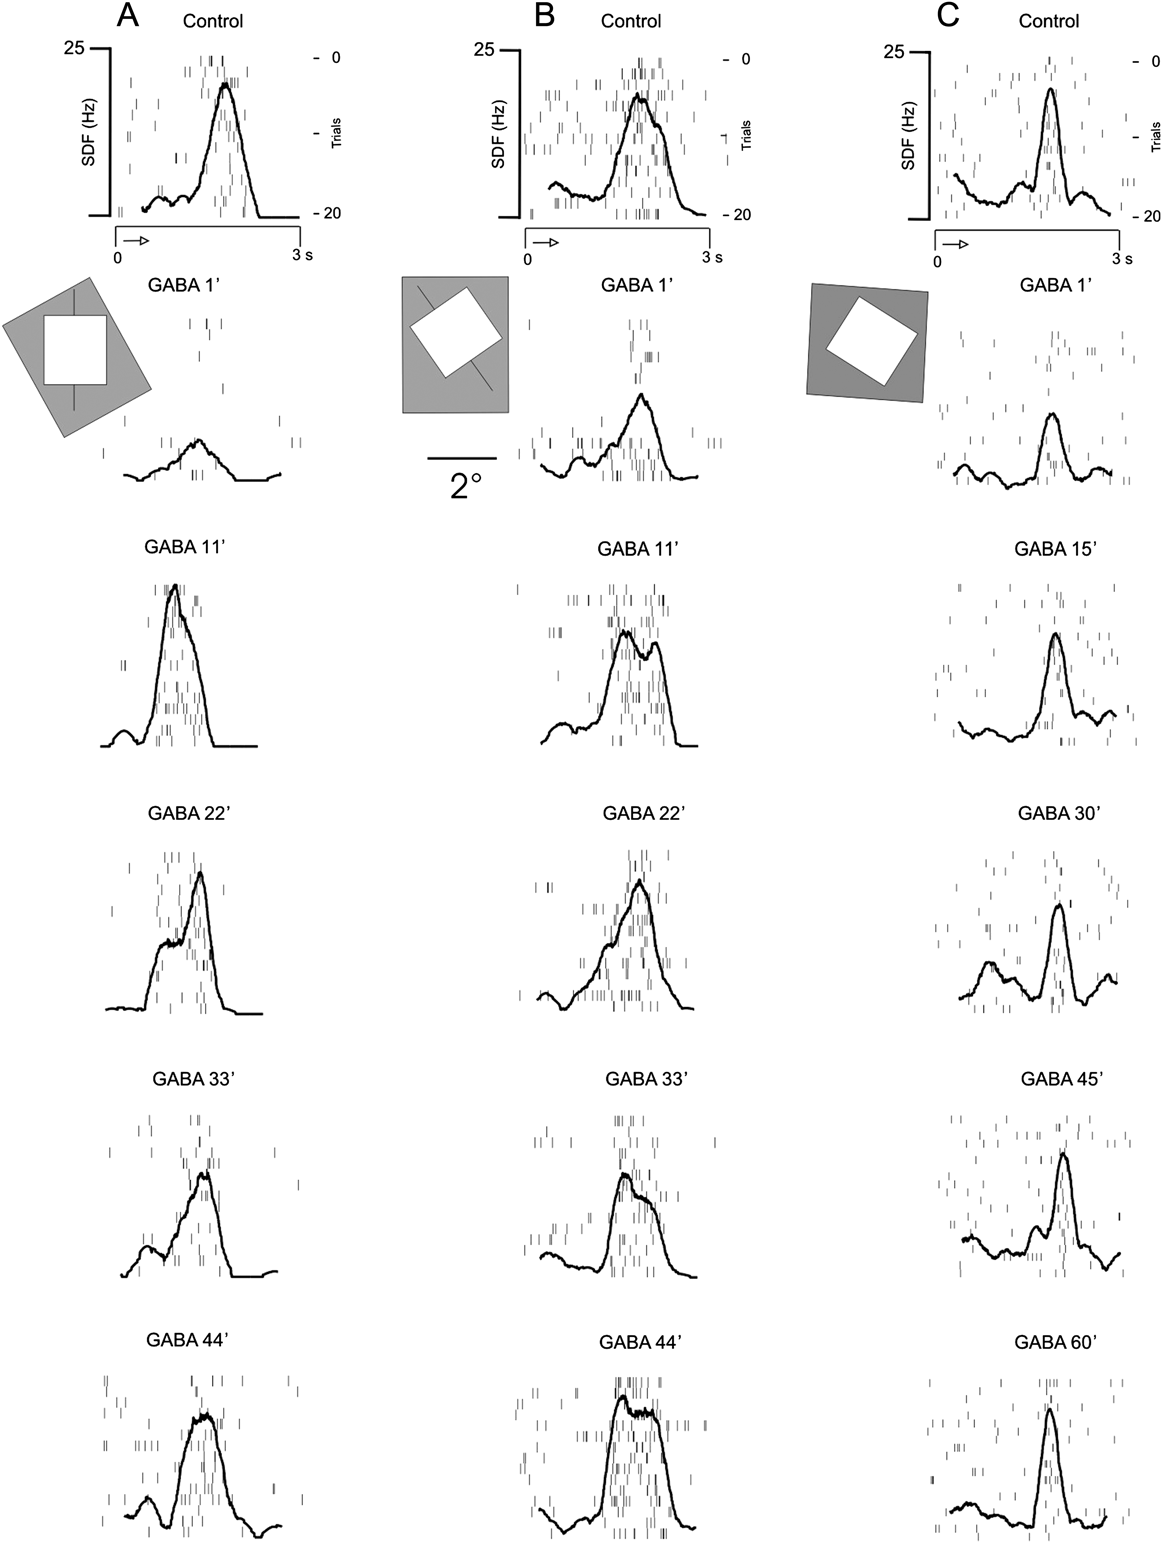
GABA injection into area MT resulted in the loss of orientation selectivity for three neurons located within the V2 cortical area. Specific examples of a GABA-induced decreases in directional selectivity are illustrated in Fig. 8A and 8B. The neuron depicted in Fig. 8A experienced an inhibition of stimulus-driven activity 1 min after the injection of GABA into area MT. Recovery of stimulus-driven responses to control levels occurred 11 min after the GABA application had ceased. Forty-four minutes after the application, the neuronal activity due to stimulation within the receptive field (RF) and surrounding areas was indistinguishable from the control conditions.
Time course of responses to the preferred direction of three V2 neurons after GABA injection (2 μl, 0.25 mol/l) into area MT. For each neuron, the first plot illustrates sequential spike rasters and the SDF for the control condition, whereas the other plots show successive SDFs at different time points after the GABA injection. The square and gray rectangles in each column represent the receptive fields for each neuron recorded simultaneously during the experiment; one was located in area V2 and the other was located in area MT. The response signal-to-noise ratio for the neuron illustrated in (A) improved with time after the GABA injection, whereas the ratio did no improve for the other two neurons (B, C).

A second example of MT-mediated inhibition of V2 neurons can be seen in Fig. 8B. GABA injection into area MT was followed by a decrease in the evoked and spontaneous activity of the illustrated V2 neuron. After 1 min of GABA inactivation, the first eight trials showed decreased spontaneous activity and weak evoked responses. An additional 10 min of recovery was required for this cell to regain responsiveness, and another 33 min were necessary in order to observe responses outside the region of the classically defined receptive field. After 40 min of recovery time, the behavior of this cell returned to control levels.
The neuron in Fig. 8C presented no directional component before or after inactivation, although we observed a general decrease in activity after GABA injection (P < 0.01). One minute after GABA application, we observed a 60% decrease in the firing rate. Gradually, this neuron recovered, and 60 min after the GABA injection, the neuron had a response profile similar to that of the control condition. This unit showed no tuning of driven activity inside the classical receptive field, as described for the other neurons in Fig. 8.
Fig. 9 shows histograms of the mean and standard error for four V2 neurons for each direction of stimulation under different conditions. The change in the direction selectivity before and after the injection is shown for two pandirectional cells (Fig. 9A and 9B) and two selective cells (Fig. 9C and 9D).
Histograms of the response to different directions of motion from four V2 neurons (A–D) before and after GABA inactivation (2 μl, 0.25 mol/l) into area MT. Each column shows histograms before (control), immediately after (1 min), and at a later time after recovery. The mean (bars) and standard error (lines) of the firing rate are shown in light gray for the nondirection-selective conditions (pandirectional) and in dark gray for direction-selective conditions. Asterisks—preferred direction of motion.

Discussion
Previous studies have described the divergent nature of the feedback connections from area MT to the visual area V2 (Salin & Bullier, Reference Salin and Bullier1995; Payne et al., Reference Payne, Lomber, Villa and Bullier1996). Thus, the descending projections on a given V2 neuron represent a larger portion of the visual field than that encompassed by the rostrally directed afferents on the same unit (Salin & Bullier, Reference Salin and Bullier1995). Consequently, to remove all feedback influence of area MT on a given V2 neuron, a large portion of area MT must be inactivated. For this reason, we injected 0.8–2.0 μl (0.25 mol/l) of GABA into MT and studied the topographically corresponding portions of V2.
Hupé et al. (Reference Hupé, Chouvert and Bullier1999) performed a quantitative study on the spread of GABA after pressure injections into the cortex. It was predicted that the injected volume would spread throughout the extracellular space, occupying an ellipsoid shape. An injected volume of 13 nl of GABA (0.1 mol/l) would occupy an extracellular volume of approximately 60 nl. For injected volumes greater than 60 nl, it would theoretically be difficult to predict the shape of the spreading. Hupé et al. also determined that with a greater quantity of GABA injected, the inactivation period and the time needed for the neurons to recover would also be greater. This last result is in agreement with our observations. In Hupé et al. (Reference Hupé, James, Girard and Bullier2001), the neurons required 40 min to recover to baseline after a 0.9-μl injection of GABA (0.1 mol/l). This recovery period coincided with the time required by V2 neurons to regain baseline activity after a 0.8-μl GABA (0.25 mol/l) injection into area MT in the present study. Considering the extent of area MT determined by Fiorani et al. (Reference Fiorani, Gattass, Rosa and Sousa1989), we extended the predictions of Hupé et al. (Reference Hupé, Chouvert and Bullier1999) regarding the relationship of the injected volume and occupied extracellular volume. We predicted that injection volumes between 0.8 and 10 μl would inactivate between 2.3 and 33.3% of area MT.
Evaluation of the early and late effects of GABA inactivation
GABA inactivation of area MT produced early (up to 20 min) and late (from 20 to 140 min after GABA injection) effects on V2 neurons. These effects consisted of an early general decrease in neuronal excitability, which corresponded to a depression in the spontaneous and driven activities, and late effects, which generally reflected changes in the orientation and/or direction selectivity of the V2 neurons. In general, a loss of direction selectivity was observed during the late response, with only 10% of the cells becoming more selective. As an intermediate effect, an improvement in the amount of driven activity inside the classical receptive field relative to that outside the classical receptive field was observed 15–25 min after GABA inactivation. This effect was transient and was followed by a longer-lasting decrease in neuronal excitability.
The V2-driven activity typically fell below 50% of the control level during the first 10 min after the injection. For injections of 0.8 and 2 μl of GABA (0.25 mol/l) into area MT, the driven activity of V2 neurons began to recover to control levels 5 min after inactivation. For the 10-μl (0.25 mol/l) injection, the period until the beginning of recovery was 15 min, and a complete recovery was only achieved after 40 min. Because the stimulus-driven activity recovered faster than the spontaneous activity, we clearly observed an intermediate improvement of the driven activity inside the classical receptive field relative to the spontaneous activity or to the activity outside the classical receptive field. We defined this effect as an improvement of the signal-to-noise ratio of the neuronal response. This phenomenon did not seem to represent a general decrease in cell excitability. The contribution of the surround and the background activity seemed depressed but was still greater than that of the afferents driving the center of the receptive field.
The different effects of GABA inactivation on the spontaneous and stimulus-driven activity were complex, and we attributed them essentially to the properties of the GABAergic channels. For injections of 0.8 and 2 μl, a rebound effect in spontaneous activity was observed, whereas the response in the preferred direction was still below the baseline. For injections of 10 μl, the spontaneous activity did not recover after 120 min of GABA inactivation, and the response to the preferred direction reached 150% of the control level. This dissociation suggests that different and possibly independent mechanisms underlie the changes in the stimulus driven and spontaneous activity in the cortex.
The mechanism underlying the late rebound effects may involve a downregulation of glutamic acid decarboxylase (GAD), the enzyme responsible for GABA biosynthesis. The intermediate to late activity rebound, on the other hand, may be due to the inhibition of GAD by GABA in the circuitry projecting from area MT to area V2. A similar downregulation was demonstrated in the chick retina after a 7-h incubation with GABA (de Mello, Reference de Mello1984).
Duration of inactivation
Prior to the start of these experiments, we could not predict the long-lasting effects of GABA injection in area MT. We believe that inhibitory effects are equivalent to the effects of iontophoretic injections of GABA as described in the literature (Crook et al., Reference Crook, Kisvárday and Eysel1996, Reference Crook, Kisvárday and Eysel1997, Reference Crook, Kisvárday and Eysel1998). With iontophoresis, however, the amount of GABA released is usually much smaller than that released from a pressure injection. It is therefore possible that, in addition to an initial inactivation effect, a pressure injection causes late effects in neuronal activity that are not observed when lower quantities of GABA are injected. Several changes occurred in the V2 neurons, while MT cells were still silent, suggesting that V2 neurons could induced by GABA inactivation. These effects persisted for 40–120 min.
Pharmacological inactivation paradigms are based on the postinjection effects, which disappear over time. The effects are usually reversible and are evaluated in comparison with the preinjection state. A return to the resting or preinjection spontaneous and driven activity is indicative of a nontoxic or nondestructive effect on the central nervous tissue. Therefore, we based our results on a sample of cells, in which a clear trend towards the recovery of the driven activity was observed.
Cortical circuits
Several studies have demonstrated the role of intrinsic circuits in the regulation of receptive field properties (Crook & Eysel, Reference Crook and Eysel1992; Sato et al., Reference Sato, Katsuyama, Tamura, Hata and Tsumoto1995, Reference Sato, Katsuyama, Tamura, Hata and Tsumoto1996; Crook et al., Reference Crook, Kisvárday and Eysel1996, Reference Crook, Kisvárday and Eysel1997, Reference Crook, Kisvárday and Eysel1998; Kisvárday et al., Reference Kisvárday, Crook, Buzás and Eysel2000). In contrast, other studies support that caudally directed projections are capable of altering the basic properties of neuronal receptive fields (Mignard & Malpeli, Reference Mignard and Malpeli1991; Alonso et al., Reference Alonso, Cudeiro, Pérez, Gonzalez and Acuña1993; Hupé et al., Reference Hupé, James, Payne, Lomber, Girard and Bullier1998; Wang et al., Reference Wang, Waleszczyk, Burke and Dreher2000; Galuske et al., Reference Galuske, Schmidt, Goebel, Lomber and Payne2002; Huang et al., Reference Huang, Chen and Shou2004). It has been shown that the inactivation of feedback circuits from V2 to area V1 does not alter the orientation selectivity of V1 neurons (Sandell & Schiller, Reference Sandell and Schiller1982). Attention and mnemonic modulation as well as the integration of visual information are some of the functional roles attributed to these feedback projections. It has also been suggested that the feed-forward projections are the main determinant of the basic receptive field properties (Salin & Bullier, Reference Salin and Bullier1995; Lamme et al., Reference Lamme, Supér and Spekreijse1998). In the present study, we present evidence that feedback projections from area MT are capable of not only modulating the spontaneous and the driven activity of V2 neurons but also modifying V2 receptive field proprieties, such as orientation and direction selectivity.
Model of a circuit that describes the decrease of spontaneous and driven activity of V2 neurons
Direct feedback projections from area MT to area V2 have been described in New-World squirrel monkeys (Rockland & Knutson, Reference Rockland and Knutson2000). Layers II, III, V, and VI of area MT contain mainly pyramidal neurons, which constitute the source of feedback circuits to the hierarchically structured lower areas (Tigges et al., Reference Tigges, Tigges, Anschel, Cross, Letbetter and McBride1981). In area V2, the same layers (II, III, V, and VI) receive projections from the MT feedback circuits. In V2 of the macaque, the GABAergic neurons of the supragranular layers extend laterally 1.5–1.7 mm, while those from the infragranular layers reach 1.0 mm. These GABAergic projections in V2 possess local inhibitory signals in an elongated shape arborization (Kritzer et al., Reference Kritzer, Cowey and Somogyi1992). As a functional consequence, GABAergic neurons may modulate of a greater number of neurons selective orientation/direction in the upper layers of those in lower layers. We propose the following hypothetical model to explain our observations. If the feed-forward projections of the cortical areas are considered to be excitatory (Salin & Bullier, Reference Salin and Bullier1995), the feedback circuits would probably modify the properties of the receptive field through the excitatory and inhibitory neurons present in the intrinsic circuits. The most common effect observed during the 10 min after GABA injection into area MT was a decrease in the spontaneous and the driven activity in the V2 neurons. We propose that pyramidal neurons within direction selectivity modules in area MT containing GABAA receptors (Sato et al., Reference Sato, Katsuyama, Tamura, Hata and Tsumoto1996) are inhibited by the GABA injection. A decrease in neurotransmitter release to the superficial and deep layers of area MT would then ensue. As a result, the excitatory caudally directed synapses become inhibited, causing a decrease in the spontaneous and driven activity of the V2 neurons. The injections affect each direction-selective column, resulting in a decrease in the spontaneous and driven activity of the neurons for all directions.
Model of a circuit involved in the change of V2 neuronal selectivity
A loss of selectivity was the most frequent receptive field alteration in the V2 neurons after GABA inactivation of the topographically corresponding portions of area MT. We hypothesize the existence of a circuit involving a projection of neurons from deep and superficial layers of area MT (probably pyramidal neurons) containing GABAA receptors. The excitability of these neurons would decrease after the activation of GABA receptors. This decrease in excitability would influence the pyramidal neurons in the V2 area that receive these projections and would also influence intrinsic inhibitory neurons. Intrinsic inhibitory interneurons decrease the influence on neuronal afferents to neighboring columns and cause a loss of direction selectivity for the majority of neurons. The directionality of the remaining 10% of the neurons in our population became selective after the GABA injection. Therefore, we propose that the inactivation of area MT has partial and asymmetrical effects, causing some direction columns to remain active, whereas others are suppressed. This asymmetrical inhibition would generate direction selectivity in neurons that were pandirectional before the injection.
Alternative interpretations
The paradigm used in this study does not allow the distinction between an intrinsic change in direction/orientation selectivity and a change in the shape of the receptive fields or their surrounds. For instance, if GABA caused the RFs to become smaller, this would presumably show up as a decrease in responsiveness. Likewise, if they became asymmetrical, this would be evident as a change in orientation selectivity. A superficial analysis of changes in receptive field structure of V2 neurons with GABA injections in MT did not revealed, however, any systematic effect. Future experiments with a selected sample of cells are necessary to further exam the spatial structure of the intersection maps before and after GABA inactivation.
Acknowledgments
Funded by grants from PRONEX, CNPq, FUJB, FAPERJ, FINEP, and CEPG. A.K.J.A. and B.L. received CNPq fellowships for their graduate studies. R.G. is a CNPq Research Fellow.