Introduction
China’s urban population increased from 64 million in 1950 to 780 million in 2015, which is larger than the current European population of 740 million (United Nations, 2014, 2015). During this period, the Total Fertility Rate (TFR) in China’s urban population decreased from around 5 children to approximately 1 child per woman (Yao, Reference Yao1995; Zhao, Reference Zhao2015). These changes have not only profoundly impacted China’s socioeconomic development and its future, but also significantly altered the world demographic map and population trends. Although a few previous studies, including Feeney and Yu (Reference Feeney and Yu1987) and Retherford et al. (Reference Retherford, Choe, Chen, Li and Cui2005), have calculated urban fertility rates and examined urban–rural fertility differentials, the specific patterns and characteristics of China’s urban fertility have not been systematically examined, especially in the international comparative context. This paper fills some of these research gaps.
Most studies tend to look at demographic changes in a population or a region. Concentrating exclusively on urban population issues may be regarded as breaking away from such convention. However, investigating fertility decline in urban China is of great importance in its own right. China is unique in the sense that radically different demographic, economic, social and development policies have often been implemented by the state in urban and rural areas since the founding of the People’s Republic. These policies have exerted different impacts on urban and rural populations, and helped to form many distinctive social and demographic characteristics in urban and rural areas. For example, there was a significant urban–rural differentiation in China’s fertility policies until the Chinese government abolished its ‘one-child’ policy in late 2015 (Zhao, Reference Zhao2015). According to the previous fertility policies and related regulations, Chinese with urban household registration generally could have only one child, while those with rural registration were often allowed to have two, or in some cases more than two children. There were some exceptions: for example the one-child policy was also widely applied to rural residents in Beijing, Tianjin, Shanghai, Chongqing, Jiangsu and Sichuan. However, the majority of rural Chinese were exempted from the one-child policy (Gu et al., Reference Gu, Wang, Guo and Zhang2007; see also Zhang (Reference Zhang1988) and Zhao (Reference Zhao2001) for a description of China’s household registration and its impacts). The urban–rural chasm in birth control policies had a great impact on people’s fertility behaviours, and resulted in very different fertility regimes in the urban and rural areas. The profound consequences of such social engineering are rarely observed in other countries. Investigating the development of these characteristics and their impacts is of considerable theoretical importance and policy implication.
The analyses presented in this paper used mainly urban population data reported by the Chinese government and those estimated by the United Nations. Chinese fertility statistics are released by relevant government departments or computed from the data collected by censuses, inter-censual population sample surveys, national fertility sample surveys and annual population change surveys. These data were compared with those for selected Asian populations, which were obtained from related governments and international organizations or reported by other researchers. During the last six decades, the criteria used to classify China’s urban areas or urban population have changed several times. Different definitions of resident population have also been used by censuses or surveys conducted at different times or for different purposes (Zeng & Vaupel, Reference Zeng and Vaupel1989; Liang & Ma, Reference Liang and Ma2004). These, in addition to the increases in floating population and rural–urban migration, have resulted in some inconsistencies in the collected urban population or fertility data. They in turn affect the compatibility of the used data, and lead to moderate or minor uncertainty in the reported results. These, however, have only negligible or no impact on the major conclusions drawn from this study, which focused on the major trends and main characteristics of fertility in China’s urban population.
The increase in China’s urban population
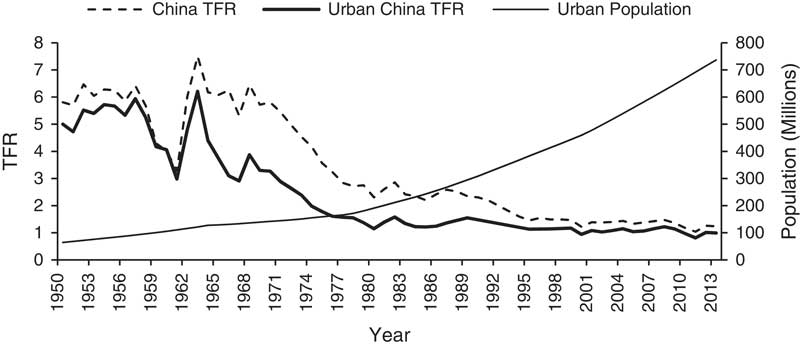
As shown in Fig. 1, the increase in the urban population of China was moderate during the period between 1950 and 1980 but accelerated significantly thereafter. Between 1950 and 1980 the size of the urban population increased from 64 million to 190 million, yet the proportion of urban population remained below 20% of the national population. Over the past three and a half decades China’s urban population witnessed a rapid growth, expanding more than four-fold to 780 million in 2015, and the proportion of the population residing in urban areas increased to 54%. By 2035 the urban population in China is estimated to reach over one billion and account for more than 70% of the county’s total population (United Nations, 2014).
Changes in China’s urban population and Total Fertility Rate (TFR), 1950–2013. Sources: TFRs for China and urban China 1950–90, Yao (Reference Yao1995); 1990–2010, Population Statistical Yearbook, various years; urban population data from United Nations (2014).
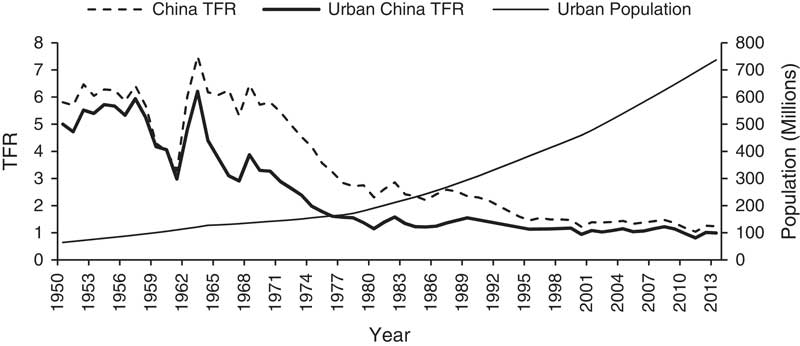
The extraordinary growth of China’s urban population, especially in recent decades, is closely related to rapid urbanization and a significant increase in rural–urban migration. In the late 1970s, China introduced a series of market-oriented economic reforms. The resulting economic development has led to unprecedented urban growth. Large metropolitan regions were formed along China’s eastern coastal areas, and some previously rural areas were replaced by newly formed townships or small cities (Zhu, Reference Zhu2000; Cao et al., Reference Cao, Chen, Pang, Zheng and Nilsson2011). Fuelling this urbanization process was a large increase in rural–urban migration, as hundreds of millions peasants left their villages and worked in towns and cities (Liang & Ma, Reference Liang and Ma2004; Liang et al., Reference Liang, Li and Ma2014). Many of these migrants have been widely regarded as part of the urban population, although they often face great difficulties in becoming permanent urban residents. According to national censuses, the size of China’s so-called ‘floating population’ increased drastically from about 6.6 million to over 221 million between 1982 and 2010 (Liang et al., Reference Liang, Li and Ma2014).
It is worth noting, however, that the urban population growth mapped in Fig. 1 is also attributable to substantial artefactual increase due to administrative changes in the definitions of ‘urban areas’ and ‘urban population’. In the early 1980s, for example, the classification of ‘urban areas’ was significantly relaxed. This resulted in a sudden spike in the number of towns and cities and consequently a rapid increase in urban population (Zeng & Vaupel, Reference Zeng and Vaupel1989). The definition of ‘urban population’, too, has undergone substantial changes over time. Prior to 1982, national statistics on China’s urban population were mainly derived from the household registration data kept by the Ministry of Public Security, and the term ‘urban population’ referred primarily to the population with urban household registration status or hukou. After 1982, data collected by Annual Population Change Surveys, Population Censuses and Inter-Censual Population Sample Surveys were increasingly utilized. In these operations, migrants who have been residing in urban areas for a year or half a year have often been included in the ‘urban population’ (National Bureaus of Statistics, 2015, Note 3). For example, the settlement period required for people with rural registration status to be enumerated as an urban resident was 1 year minimum in the 1982 and 1990 censuses. Subsequent censuses adopted the 6-month criterion (Liang et al., Reference Liang, Li and Ma2014, Note 3).
These issues have led to some inconsistencies in collecting urban population data and in the reported urban population and fertility statistics that are used in this paper. But as mentioned earlier, these inconsistencies have no major influence on the main conclusions drawn from this study, as the study concentrates on major trends and characteristics of fertility in China’s urban population and their underlying causes. Partly for this reason, the other sections of this paper do not further dwell on these data issues and their potential impacts.
Fertility decline in China’s urban population
Figure 1 also shows the changes in TFR in China’s national and urban populations over the period from 1950 to 2013. The fertility rate observed in the urban population was already lower than that for the national average in the early 1950s. According to some studies, a non-trivial fertility reduction had already been recorded in some urban populations in the 1950s (Lavely & Freedman Reference Lavely and Freedman1990). During the great famine of 1958–1961 fertility changes in the urban population were very similar to the national trends, but the fertility surge taking place immediately after the famine was rather moderate in some large cities (for example Shanghai) in comparison to that witnessed in the whole country. Fertility differentials between the national and urban populations further increased after the second half of the 1960s, with the trend of fertility decline becoming more observable in the urban areas. There was a moderate dip in TFR in 1966 and 1967, which was related to social and political upheaval in the early years of the Cultural Revolution. In the 1970s the decline in urban fertility accelerated with the TFR dropping from 3.5 in 1970 to less than 2.0 in 1974, falling to below replacement level for the first time. The TFR further decreased to 1.2 in 1980 in urban China, and then fluctuated between the early 1980s and early 1990s. Since the mid-1990s the TFR for China’s urban population has varied between 0.8 and 1.2, according to the estimates obtained from the censuses, inter-censual population sample surveys and annual population change surveys.
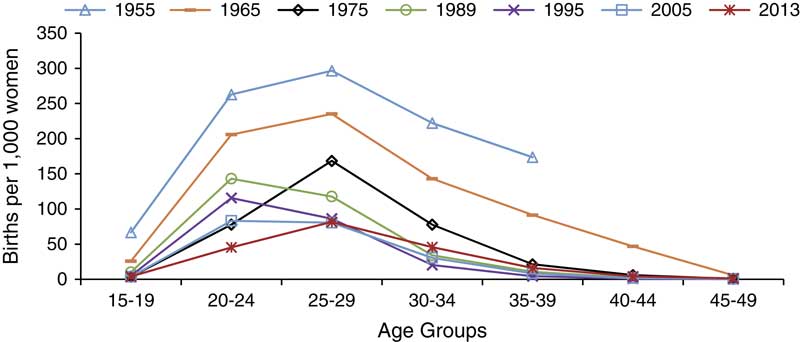
Rapid fertility decline taking place in China’s urban population can also be seen in changes in Age-Specific Fertility Rate (ASFR), as shown in Fig. 2. In 1955, ASFRs for urban women were still high across all age groups where data were available. They had already declined markedly by the mid-1960s, but the age patterns still bore many characteristics similar to those observed a decade before. Fertility was low for women under the age of 20, but increased rapidly and reached a peak when women were aged between 25 and 29. Thereafter, it remained moderately high for five more years, and then fell gradually to a very low level when women approached the end of their reproductive age.
Changes in China’s Age-Specific Fertility Rate in urban population. Sources: fertility rates for 1955, 1965 and 1975 were compiled from China’s One-Per-Thousand Fertility Survey data by Yao (Reference Yao1995). Data for 1989, 1995, 2005 and 2013 were computed using data from China’s Population Statistical Yearbook, various years. Fertility rates for those aged 40 and over were not available for 1955. Data for 1989 were used because data for 1985 were not available.
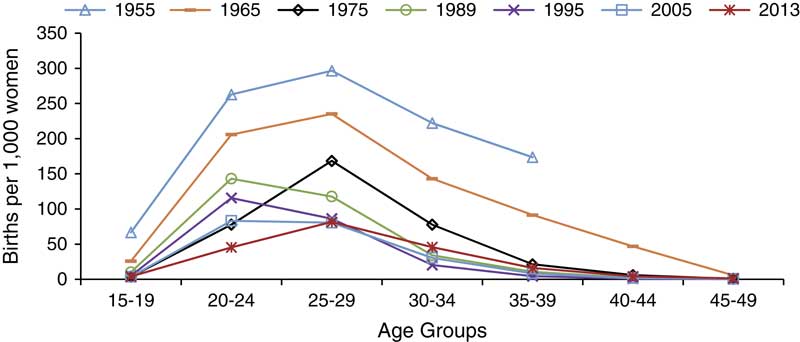
The ASFRs observed in 1975 displayed some irregularities in the sense that in comparison with those recorded in the 1980s and 1990s, the fertility rate for those under the age of 25 was notably lower. This was largely a result of the first major campaign of China’s nationwide family planning programme, which was designed to implement the ‘later, longer, fewer’ policy. As a key aspect of the campaign, ‘later’ marriage, which would effectively postpone age at first birth, was advocated and minimum ages of marriage were enforced by governments at different levels. In urban areas such a minimum age was sometimes set to as high as 25 years for females and 28 years for males (Tien, Reference Tien1983). The substantial delay in marriage and childbearing caused by this campaign was clearly reflected in the ASFR pattern for 1975.
However, the delay in marriage and childbearing taking place in the 1970s was rather short-lived. In 1980, a revision of the Marriage Law stipulated a minimum legal marriage age of 20 for females and 22 for males, and effectively reduced the age requirements for marriage. Mean age at marriage and first birth in China declined notably following the implementation of the new Marriage Law. As a result, fertility at younger ages increased (Zhang & Gu, Reference Zhang and Gu2007; Wang et al., Reference Wang, Cai and Gu2013). As revealed by the ASFRs for 1985 and 1995, a very small proportion of women had children before reaching age 20, but this rose quickly soon after women passed the legal age of marriage. In both years, fertility reached its highest level at age 20–24, followed by that for women aged 25–29, and fell to a very low level thereafter. By age 35–39, the fertility level was almost negligible. This pattern remained largely unchanged over the next decade, although the level of fertility continued to decline in China’s urban population.
In more recent years, China’s urban fertility has fallen to an even lower level. Accompanying this decline, patterns of ASFRs have also changed, as shown by the ASFRs for 2013. The fertility of those aged below age 25 has further declined; the fertility peak has shifted to age 25–29; and the level of fertility for those aged 30–39 has increased slightly. As a result, the age structure of childbearing has become older. Given the ultra-low TFR in China’s urban population, these changes can be ascribed mainly to the considerable delay in age at marriage and age at first birth taking place in the past decade.
Main characteristics of fertility patterns in China’s urban population
In comparison with those observed in many other populations, the fertility patterns in China’s urban population have some marked characteristics that can be summarized as four inter-related ‘lows’.
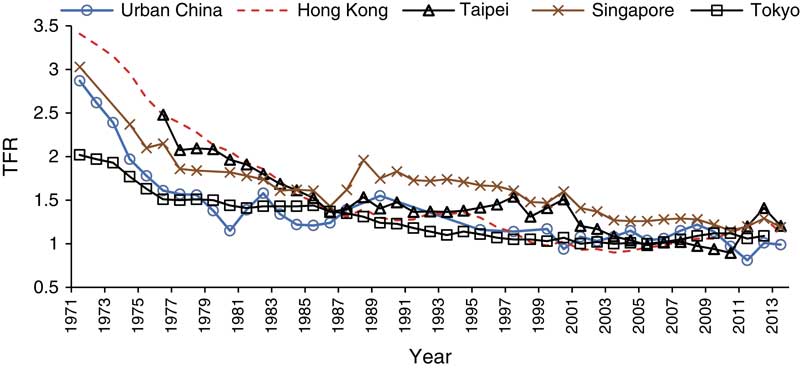
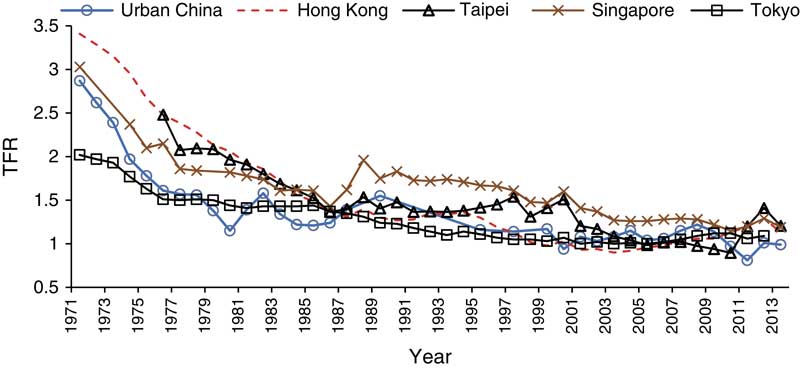
First, the fertility level in China’s urban population is extremely low. After several decades of decline, China’s urban fertility is now far below replacement level. Figure 3 compares the trend in TFR in urban China with that in four Asian cities including Hong Kong, Singapore, Taipei and Tokyo. In the early 1970s, the TFRs in urban China were similar to the levels observed in Singapore but were substantially higher than those for Tokyo and lower than those for Hong Kong. By the end of the 1970s, however, the fertility in urban China had already fallen to the lowest level within the five populations. In the first half of the 1980s, TFRs fluctuated in urban China and were close to those in Tokyo, and both were lower than those in the other three cities. The TFRs in all these populations further declined to 1.5 or lower levels in the early 21st century. According to available records, their fertility levels have been among the lowest ever recorded in the world. In 2013 for example, the TFR was 0.99 for urban China, 1.09 for Tokyo, 1.13 for Hong Kong, 1.19 for Singapore and 1.21 for Taipei. It is worth emphasizing that urban China comprises all large and small cities in mainland China, whereas the other four selected cities are major international metropolitan areas that experienced extraordinary fertility decline during the second half of the 20th century and have been widely seen as the leaders of fertility decline in East Asia and the world (Frejka et al., Reference Frejka, Jones and Sardon2010). Even using them as references, fertility in China’s urban population has been very low.
TFRs in selected urban populations in Asia. Sources: TFRs for Hong Kong from Demographic Statistics Section, Census and Statistics Department of Hong Kong; TFRs for Taipei City, from Department of Budget, Accounting and Statistics, Taipei City Government, Taiwan; TFRs for Singapore from Statistics Bureau, Singapore; TFRs for Tokyo were published in Tokyo Statistical Yearbook, various years. Data for China’s urban population are the same as those for Fig. 1 (see also Zhao, Reference Zhao2015).
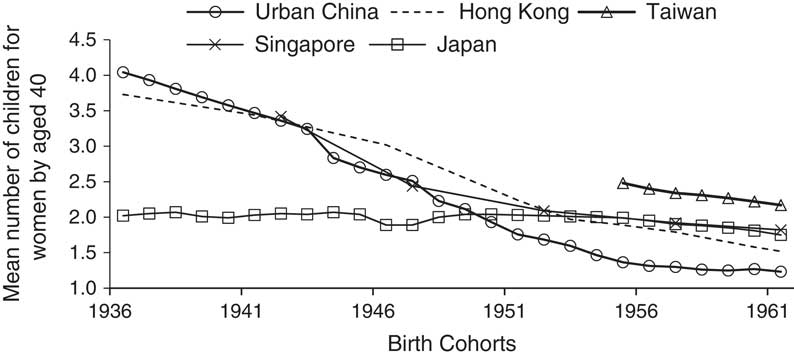
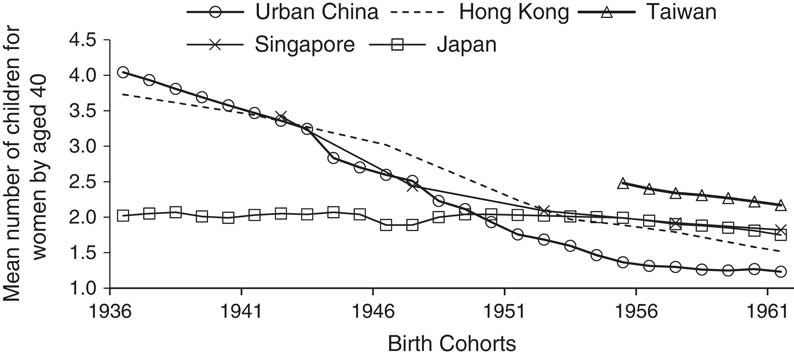
The low fertility of China’s urban population is not only indicated by the very low period fertility rates, but also reflected in its exceptionally low cohort fertility, as measured by mean number of children ever had by women by age 40. These cohort fertility statistics are shown in Fig. 4 and are compared with those for Hong Kong, Japan, Singapore and Taiwan. This study used Japan and Taiwan to replace Tokyo and Taipei because data for the two cities were not available when the analysis was undertaken. The cohort fertility of China’s urban population has experienced an extraordinary decline. According to the 1982 One-Per-Thousand Fertility Survey conducted by the Chinese government, women born in the late 1920s and the early 1930s had an average of 4.5 births by age 40, though the result is not shown in Fig. 4. But the average number of births for women born in the late 1940s dropped to slightly above 2, as shown in the figure. The cohort fertility for China’s urban women who were born before 1950 was considerably higher than that for women in Japan, but was not too different from that recorded in Hong Kong and Singapore. However, the cohort fertility for China’s urban women who were born after 1950 was much lower than that in the other four selected populations. For example, the cohort fertility for China’s urban women who were born in 1961 was only 1.2 children per woman – much lower than that for the other four populations.
Mean number of children for women by aged 40 in selected Asian populations. Sources: data for urban China were computed from National Retrospective Fertility Surveys in 1992, 1997 and 2001; data for Japan, Singapore, Taiwan and Hong Kong from Frejka et al. (Reference Frejka, Jones and Sardon2010).
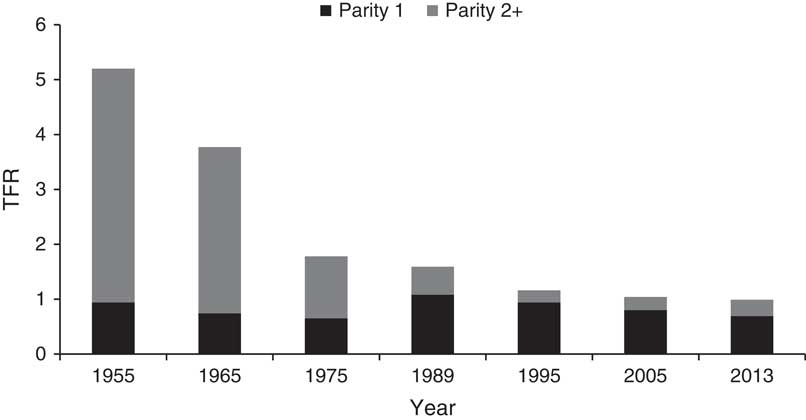
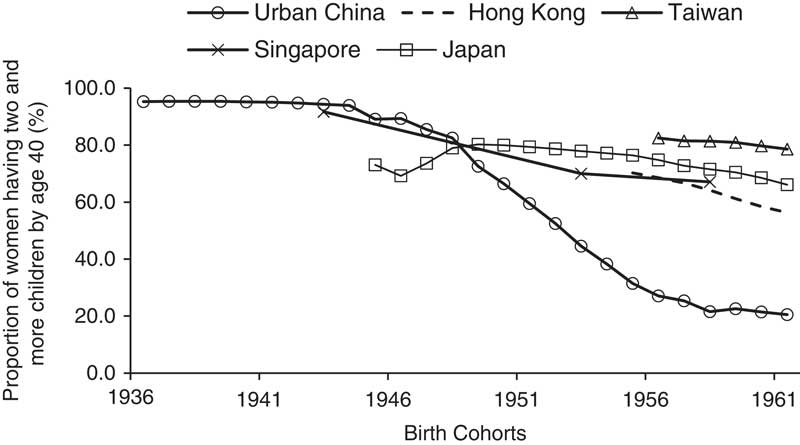
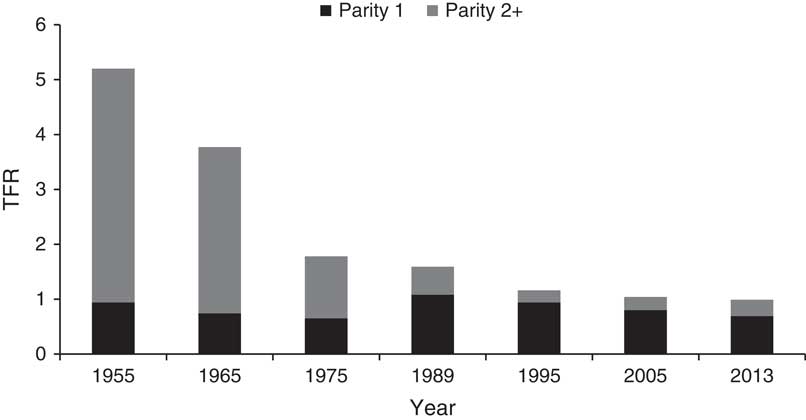
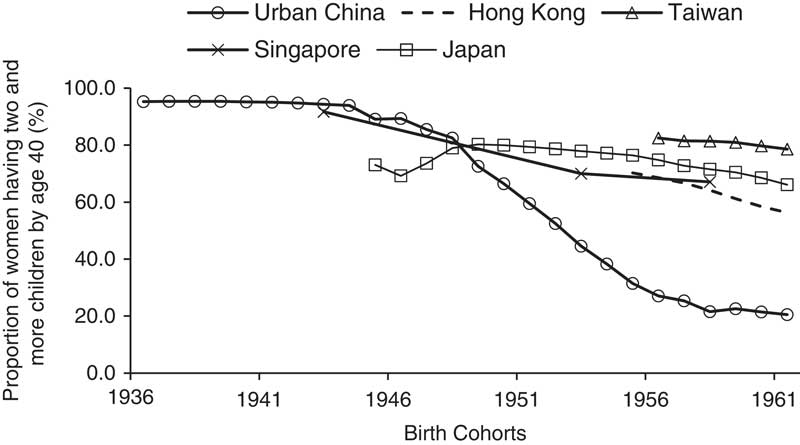
The very low fertility found in China’s urban population is clearly related to the second ‘low’ – the proportion of women having two or more than two children is very low. Because of the implementation of the one-child policy, the number of urban couples having two or more than two children decreased very rapidly in the 1980s. This is reflected in the sharp reduction in the proportion of second and higher order births after the 1980s. As shown in Fig. 5, second or higher parity births accounted for over 80% of the TFR prior to 1965. This proportion fell to just over 30% by the late 1980s and further declined to 23% by 2005. From a cohort perspective, over 90% of China’s urban women born between the mid-1920s and mid-1940s had given birth to two or more children by age 40. Yet for those who were born two decades later, the proportion dropped to just 21%. This sharp decline differs greatly from that in other selected Asian populations, as shown in Fig. 6. In the four selected Asian populations, the proportion having two and more children displays a trend of decline among women born between the mid-1940s and early 1960s. But the proportions were notably higher than that in urban China. This is particularly the case for women born between the early 1950s and early 1960s. For example, over half of women in the 1961 birth cohort had given birth to more than two children by age 40 in Hong Kong, Japan and Singapore. In Taiwan, this proportion was as high as 80%. All of them were significantly higher than that recorded in China’s urban population, where parity distribution is extremely skewed towards the first birth. This pattern has perhaps never been observed in any other population.
TFRs by births order in urban China, 1955–2013. Sources: data for 1955–85: Yao, Reference Yao1995; Reference Yao1995–2013, Population Statistical Yearbook, various years. Data for 1989 were used because data for 1985 were not available.
Proportion of women having two or more children by age 40 in selected Asian populations, by birth cohort. Sources: data for urban China were from National Retrospective Fertility Surveys in 1992, 1997 and 2001; data for Japan, Singapore, Taiwan and Hong Kong were from Frejka et al. (Reference Frejka, Jones and Sardon2010).
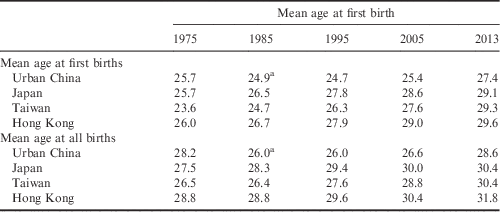
The third ‘low’ is that the mean age of childbearing has been rather low in China’s urban population in recent decades. Table 1 lists the mean age at first birth and at all births for urban China and three other Asian populations in various years since the mid-1970s. When compared with Japan, Taiwan and Hong Kong, it becomes evident that, at least from the second half of the 1980s onwards, women in urban China had their children at comparably younger ages. The relatively high mean ages at first birth in urban China observed in 1975 were closely related to the coercive ‘later, longer, fewer’ campaign discussed earlier. The delay in marriage and childbearing in urban China soon receded after the relaxation of minimum age requirements in the early 1980s, as reflected in the lower mean age at first marriage in 1989 and 1995. In these years, the mean age at first birth for China’s urban women was similar to the level in Taiwan but about two years lower than that in Hong Kong and Japan. Although a detectable upward trend in the mean age at first birth and all births was observed in the 2000s in urban China, such moderate increases were overshadowed by rapidly rising childbearing ages in the other Asian populations, ensuring a widening gap in age at birth between urban China and these populations up until recent years. By 2013, the mean age of having the first child in urban China was 27.4, which was 1.7, 1.9 and 2.2 years younger than in Japan, Taiwan and Hong Kong, respectively. The changes in the difference in the mean age of women at all births between China’s urban population and the other three populations were even more striking. In 1975, the mean age at all births for China’s urban women was close to that in Hong Kong and notably higher than that for Japan and Taiwan. But since the mid-1980s, the mean age of women at all births for China’s urban population was considerably lower than that for the other three populations. This great change largely arises from the fact that the overwhelming majority of Chinese women have only one child and stop their reproduction at younger ages. Chinese women’s reproductive span has been compressed to a rather short period of time. This is another major characteristic of fertility patterns in China’s urban population.
Mean ages at first birth and at all births in selected Asian populations

Data sources for urban China: in 1955–85, Yao (Reference Yao1995); Reference Yao1995–2013, Population Statistical Yearbook, various years. Other data obtained from the Human Fertility Database. aFor urban China, data for 1989 were used because data for 1985 were not available.
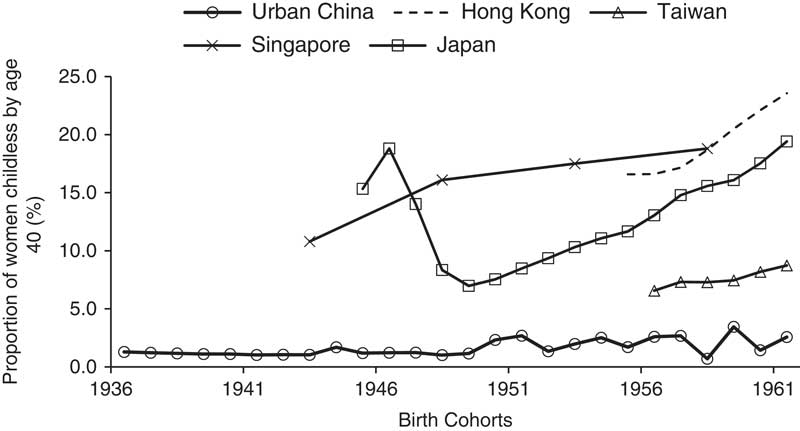
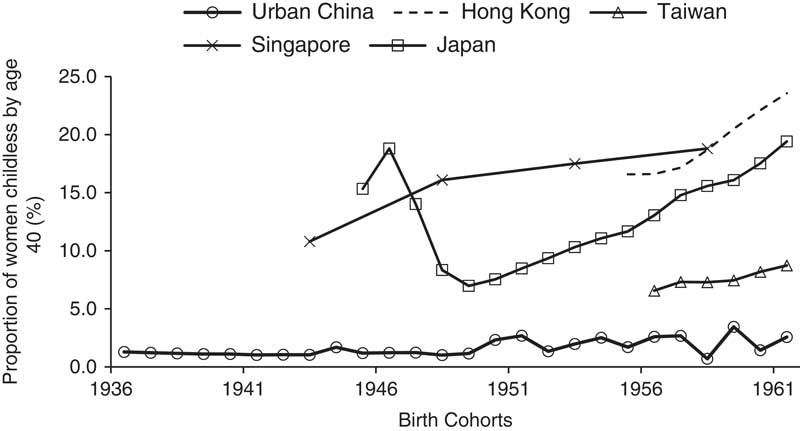
The fourth ‘low’ is the low proportion of women having no children. Differing from the selected Asian populations and many Western countries, where a fairly large proportion of women are not marrying or not having children, the exceptionally low fertility in China’s urban population is accompanied by almost universal childbearing. As far as their reproductive behaviour is concerned, China’s urban women have become more homogeneous than ever before. The population has recorded not only a very low proportion of women having two or more children, but also a very low proportion of women remaining childless. While some countries have recently witnessed noticeable changes in people’s attitude towards marriage and an increase in late marriage or not marrying, marriage remains highly popular in China. In 2010, the proportion of urban women marrying before age 50 still exceeded 99% (United Nations, 2013). The majority of married women would go on to have at least one child. As Fig. 7 shows, for China’s urban women born between the mid-1930s and early 1960s, the proportion having no child by the age of 40 remained below 3%, with the only exception being those born in 1959. In contrast, the proportions of childless women were much higher in the other populations. For example, for women born between the mid-1950s and early 1960s, the proportions never having children by age 40 were 7–9% in Taiwan, 13–24% in Hong Kong, 12–19% in Japan and around 19% in Singapore. These proportions are all significantly higher than those observed in the Chinese urban population (Frejka et al., Reference Frejka, Jones and Sardon2010). Although the fertility level in urban China has fallen to an extremely low level, having at least one child is still regarded as a must by the overwhelming majority of urban Chinese.
Proportion of women never having children by age 40 in selected Asian populations, by birth cohort. Sources: data for urban China were from National Retrospective Fertility Surveys conducted in 1992, 1997 and 2001; data for Japan, Singapore, Taiwan and Hong Kong were from Frejka et al. (Reference Frejka, Jones and Sardon2010).
Major driving forces of fertility decline in China’s urban population
As indicated in the preceding sections, rapid fertility decline in China’s urban population and many of its distinctive characteristics have been strongly influenced by China’s unprecedented family planning programme. Although birth control was already being discussed in public in China in the first half of the 20th century and was further promoted for a period in the 1950s and 1960s, China’s nationwide government-led family planning programme did not begin until the early 1970s. This programme has had a profound impact on the fertility patterns and reproductive behaviours of the Chinese population.
The prominent role of the family planning programmes is clearly reflected in the rapid fertility decline and the patterns of this change in China’s urban population, as shown in Figs 1 and 3. Before the 1970s, China’s urban fertility had already fallen notably, but the TFR was still above 3, reasonably close to that for Hong Kong and Singapore. In the first few years after the family planning programme started, fertility declined markedly in China’s urban population and its gap with that in Singapore and Hong Kong increased. By 1974, fertility in China’s urban population dropped below replacement level for the first time, with a TFR of less than 2. In the same year, the TFRs for Singapore and Hong Kong were 2.7 and 3.0 respectively. By the late 1970s and early 1980s, the Chinese government started to implement the one-child policy in most urban areas. As a result, the TFR fell to an even lower level in the urban population, at around 1.35 in most years of the 1980s. There was a slight increase in period fertility rates during the first half of the 1980s, but this was mainly a result of the falling age at first marriage and first birth, which produced a tempo effect on fertility. After these impacts diminished and the reinforcement of the family planning programme signified by the ‘one-veto rule’ (Whyte et al., Reference Whyte, Wang and Cai2015), China’s urban fertility declined to an even lower level, slightly above 1.0 in the early 1990s, and has stayed around that level since. That the fertility decline in urban China has been closely related to the nationwide family planning programme is more evident from changes in cohort fertility. Starting with women born in the late 1940s, who entered reproductive ages when the nationwide family planning began, cohort fertility in urban China became lower or much lower than that recorded in Hong Kong, Japan and Singapore, as shown in Fig. 4.
The strong impact of the nationwide family planning programme on fertility changes in the urban population is also reflected in the changes in age patterns of marriage and fertility. As already noted, age at first marriage has experienced some irregular changes in China since the early 1970s. It rose notably in the decade and fell in the 1980s, which was especially prominent in China’s urban areas (Tien, Reference Tien1983). For example, female ages at first marriage and first birth were 21.3 and 23.5 years in 1965, rising to 22.5 and 25.7 years in 1975, respectively. As Table 1 shows, in 1975 age at first birth for women living in China’s urban areas was very close to that recorded in Japan and Hong Kong, and two years higher than that observed in Taiwan. This can be attributed to the fact that in the 1970s, coercive birth control regulations designed to postpone the ages at first marriage and first birth were widely implemented in China’s urban as well as rural areas. The increase in ages at first marriage and first birth was altered by the promulgation and implementation of the 1980 Marriage Law, which allowed women to marry and give birth at younger ages than those who married in the late 1970s, as discussed earlier. In the past two decades, age at first birth in urban China has gradually increased, but it was still considerably lower than that in Singapore, Hong Kong and Japan in the early 2010s. China’s family planning programme also played a major part in lowering the mean age at having all births in urban population. Because of the implementation of the one-child policy, most women have only given birth to one child. This ended their reproduction at comparably young ages. For most years in the last three decades, the mean ages at all births have been lower than those recorded between 1955 and 1975. This pattern differed notably from that observed in other selected populations.
The government-led nationwide family planning programme, as an unprecedented and unique social engineering project, has not only greatly lowered fertility and changed fertility patterns among China’s urban women, but also made their reproductive behaviours more homogeneous than ever before. This has been achieved through controlling and discouraging non-conformist fertility behaviours on both ends of the spectrum. On the one hand, the programme, through the use of both incentive and punitive measures, has forcefully limited higher parity births. Consequently, the proportion of China’s urban women who were born after the mid-1950s and having two or more children is far lower than in Hong Kong, Japan and Singapore. On the other hand, through a series of policies that were designed to promote family values, including some traditional family values and to protect marriage and family, and through making children more scarce and precious to both their parents and the extended families, the family planning programme has created a strong one-child-family norm and reinforced the norm through spreading it over more than three decades. It is evident from Fig. 7 that in comparison with that for other selected populations, the proportion of China’s urban women without children has remained significantly low for a very long time. So far as its reproductive behaviours are concerned, China’s urban population is arguably the most homogeneous in the world.
The above discussion, however, by no means suggests that changes in fertility and reproductive behaviour have been caused solely by the nationwide family planning programme, as argued by some researchers (Gu & Wang, Reference Gu and Wang2009; Cai, 20Reference Cai10). As mentioned earlier, in the 1950s and 1960s, fertility decline was already being witnessed in urban China (Lavely & Freedman, Reference Lavely and Freedman1990; Zhao, Reference Zhao1997). Issues related to population control were being discussed and contraceptives were already available in some urban areas (Whyte et al., Reference Whyte, Wang and Cai2015), which clearly played a part in helping couples control their fertility. Furthermore, after the 1958–1961 famine, despite the temporary fertility surge in 1962 and 1963, the trend of fertility decline resumed and accelerated thereafter in the urban population. All this had taken place before China’s nationwide family planning campaign started in the early 1970s. As a matter of fact, when this government-led campaign began, the TFR in urban China was already lower than that in Hong Kong, Singapore and perhaps Taipei. As in many populations, fertility decline in China’s urban population has accompanied, and in many ways been influenced by, a wide range of social, economic, political and cultural changes.
While the impact of China’s family planning programme became more observable in the 1970s and 1980s, it is important to note that in the last two decades, changes in fertility levels and patterns in China, and urban areas in particular, have been driven increasingly by rapid economic development and social changes. This is not only reflected in the close association between level of development and fertility (Guo et al., Reference Guo, Wu, Schimmele and Li2012; Yin et al., Reference Yin, Yao and Li2014); it is also revealed by the slow but steady increase in the ages of first marriage and first birth since the 1990s, and their gaps with those in other selected East and South-east populations have been narrowing. These changes were closely related to the expansion in education and labour force participation, heightened economic uncertainty as well as the increase in urbanization, and have directly contributed to the reduction in period fertility rates (Morgan et al., Reference Morgan, Zhigang and Hayford2009). The impact of economic development and social changes on people’s marriage and reproductive behaviours has been further reflected in the significant upsurge in cohabitation, premarital sex and pregnancy, extramarital relationship, divorce and increase in not marrying in cities, especially large cities (Zeng, Reference Zeng2000; Zhang & Gu, Reference Zhang and Gu2007; Yu & Xie, Reference Yu and Xie2013, Reference Yu and Xie2015), as observed in other countries of the world.
That fertility level and reproductive behaviour in China’s urban population have been influenced increasingly by factors similar to those found in other populations rather than the government-led family planning programme is further indicated by the recent implementation of new government birth control policies and the people’s responses to them. In November 2013, after long discussion, debate and preparation, the Central Committee of the Communist Party of China finally decided to relax the one-child policy. The revised regulations allow married couples to have two children if either the husband or wife is from a one-child family (Mu, Reference Mu2013). Many people and government officials had expected that this major policy change would lead to a fertility surge (Wang et al., Reference Wang, Cai and Gu2013). More than a year after implementation of the new policies, however, people’s response to this change has been far below the expectation of the policymakers. According to some studies and officially released statistics, out of the 11 million couples who were eligible to have a second birth according to the new policies, less than 10% of them (1.07 million couples) had applied to do so by the end of 2014 (Guo, Reference Guo2015). This clearly shows that, like people in many other countries, the fertility desires and behaviours of the Chinese, especially young people, have gone through significant changes. They will not be dictated to or altered easily by government policies, but rather be determined by their careful consideration of their own long-term interests and personal goals. Increasing fertility under the current situation is likely to be more difficult than lowering it in the past, as witnessed in many countries with very low fertility. It is due to this reality and the concern of the long-term socioeconomic impact of the country’s far-below-replacement level fertility, that the Chinese government terminated the one-child policy in late 2015, which closed an important chapter in China’s social demographic history (Zhao, Reference Zhao2015).
Conclusion
Over the period 1950 to 2015, China’s urban population has increased from 64 to 780 million. Accompanying this change, the TFR in China’s urban population decreased from around 5 children to approximately 1 child per woman. While fertility transition in urban China started late in comparison with that in many Western countries, it is clearly one of the most rapid declines ever recorded. The fertility level for China’s current 780 million urban people is also among the lowest in the world. In some of China’s major cities fertility levels have been even lower. For example, according to census results, the recorded TFRs were only 0.67, 0.68 and 0.88 in Beijing, Shanghai and Tianjin in 2000 (China Data Center, 2000a, b, c). They increased slightly in 2010, to 0.71, 0.74 and 0.91, respectively (Bureaus of Statistics of Beijing, 2012; Bureaus of Statistics of Shanghai, 2012; Bureaus of Statistics of Tianjin, 2012). Cohort fertility in the Chinese urban population has also reached an extreme low, and is perhaps the lowest level in the world. This is indicated by the fact that the mean number of children of China’s urban women born after 1950 has been considerably lower than that for Hong Kong, Japan, Singapore and Taiwan, which have been known for their far below replacement level fertility for many years.
In addition to the very low fertility level, the fertility patterns and reproductive behaviours of China’s urban population are also distinguished by the very low proportions of women with two or more children and of women remaining childless, and by the low mean age of childbearing. Because of these four ‘lows’, the reproductive behaviours of China’s 800 million urban residents have become one of the most homogeneous ever recorded in the world. The fertility patterns produced by such highly synchronized behaviours are unique in the world. While this paper has concentrated on some unique features of the fertility patterns of China’s urban population and their homogeneity, the authors do not deny or ignore the fact that considerable variations in fertility behaviours and patterns exist across China’s urban areas and that fertility behaviours and patterns similar to those in cities are also found in certain rural areas. These differences and similarities, like the issues being addressed in this paper, deserve further examination.
The extremely low fertility and unique fertility patterns found in China’s urban population are the result of both the country’s rapid social, economic, political and cultural changes and its unprecedented government-led family planning programme. Without the nationwide family planning programme that began in the early 1970s, the fertility of China’s urban population would have not fallen to below replacement level by 1974 and to below 1.5 during most of the 1980s. The fertility regime in the urban population would have not shown the patterns summarized in this paper. The highly homogeneous reproductive behaviour would have not been formed among hundreds of millions urban women. Changes in people’s ages at first marriage and first birth would have not displayed the unusual trajectories in recent history. The role of China’s family planning programme was particularly prominent between 1970 and the mid-1990s when the government made every effort to implement its aggressive birth control policies while the country’s level of economic development remained relatively low.
China’s fertility decline, including the fertility decline in the urban population, is an important part of world population change. Like in many other countries, this great transition has been related closely to the profound social, economic and cultural changes taking place in the country and the world. These impacts were particularly observable when China’s urban population started its fertility decline in the 1950s and 1960s, and when its fertility had reached and stabilized at an extremely low level after the early or mid-1990s. In the foreseeable future, it is likely that marriage and reproductive behaviours in China will become less homogeneous and closer to those observed in the Asian populations selected in this study. They will be determined increasingly by people’s personal or family choices rather than dictated by government policies or regulations made by others.
The extremely low fertility in China’s 800 million urban people has had, and will continue to have, profound impacts on Chinese society, its micro-social structure, the age composition and the distribution of the population, children’s early year socialization, rural–urban migration, urbanization, the country’s economic growth, future political changes and sustainable development. Examining these impacts and the consequences of China’s nationwide family planning programme, one of the world’s largest and most aggressive social engineering projects, is undoubtedly of great theoretical importance and policy implication.