Clay minerals are ubiquitous on the Earth's surface and are among the finest minerals in nature, with particle sizes of fewer than a few micrometres (Johnston, Reference Johnston2010; Heath et al., Reference Heath, Dewers, McPherson, Petrusak, Chidsey, Rinehart and Mozley2011; Desbois et al., Reference Desbois, Urai, Hemes, Brassinnes, De Craen and Sillen2014; Geng et al., Reference Geng, Jin, Zhao, Wen, Zhang and Wang2017). Clay minerals are widely distributed and have distinctive crystal structures and large specific surface areas, giving them utility in drilling engineering applications and in gas/liquid geological studies (Houben et al., 2014; Hemes et al., Reference Hemes, Desbois, Urai, Schroppel and Schwarz2015; Zhu et al., Reference Zhu, Huang, Ju, Bu, Li and Yang2021). The study of the diagenetic evolution of clay minerals in connection to hydrocarbon generation, transport and production has evolved to become a crucial component of contemporary hydrocarbon diagenetic theory within the area of gas/liquid geology (Richard & O'Brien, Reference Richard, O'Brien, Bennett, Bryant, Hulbert, Chiou, Faas and Kasprowicz1991; Zhang et al., Reference Zhang, Xu, Christidis and Zhou2020a). Mudstones, shales and sandstones have various porosities and reservoir qualities depending on the type, content, morphology and other microstructural aspects of the clay minerals (Loucks et al., Reference Loucks, Reed, Ruppel and Jarvie2009, Reference Loucks, Reed, Ruppel and Hammes2012; Keller et al., Reference Keller, Holzer, Wepf and Gasser2011; Gaboreau et al., Reference Gaboreau, Robinet and Dimitri2016; Ju et al., Reference Ju, Huang, Sun, Wan, Lu and Lu2017). These factors are important indicators for determining the quality of hydrocarbon reservoirs (Chamley, Reference Chamley1989; Bu et al., Reference Bu, Ju, Tan, Wang and Li2015; Cai et al., Reference Cai, Wei, Hu and Wood2017).
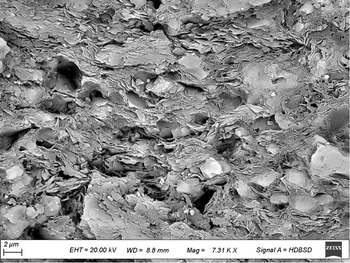
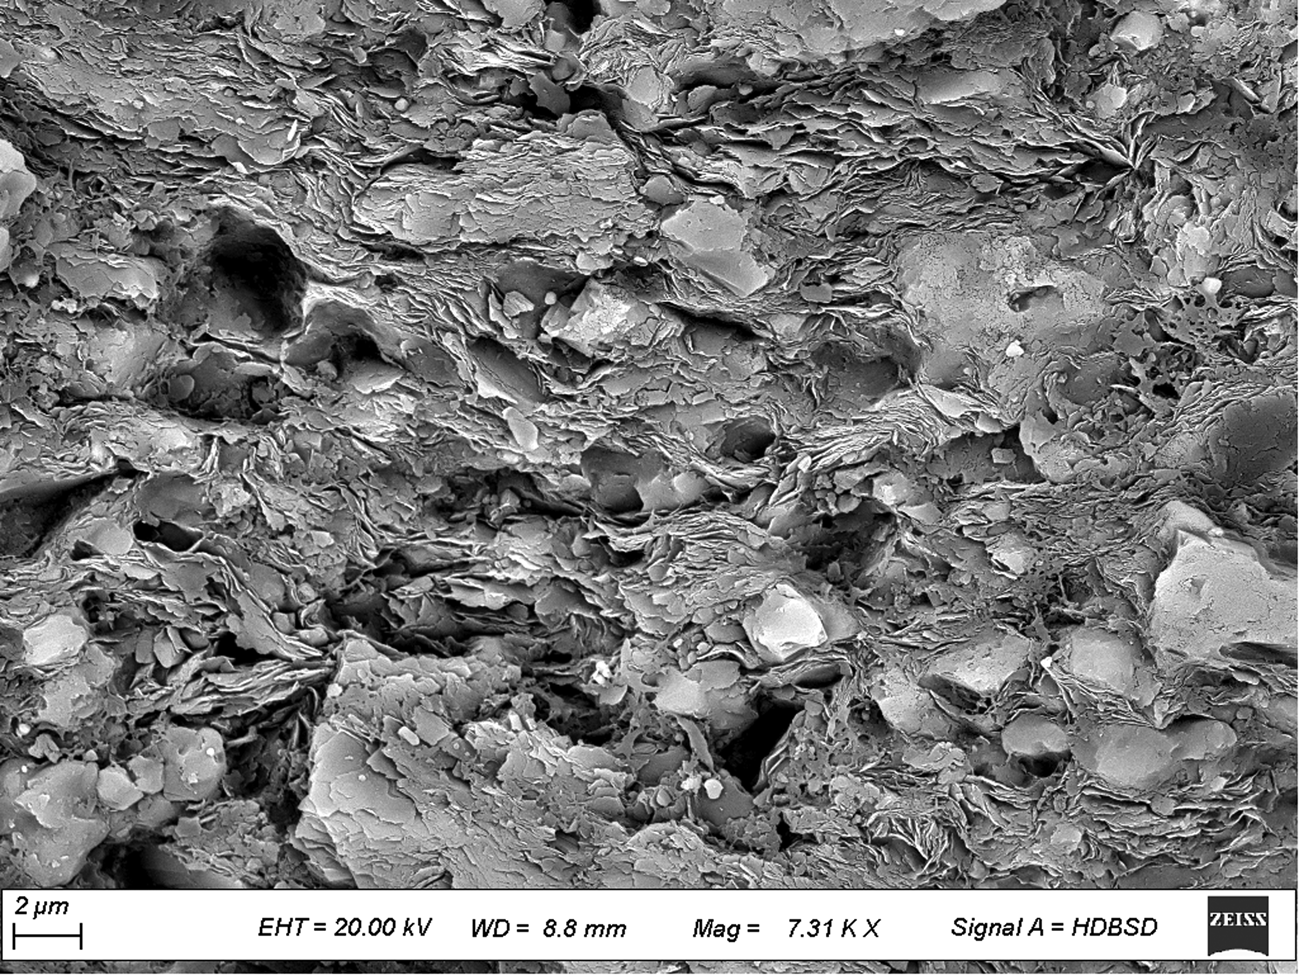
Clay minerals are major components of shales and play an important role in shale oil/gas storage space, adsorption capacity and transport capacity (Boles & Franks, Reference Boles and Franks1979; Chalmers et al., Reference Chalmers, Bustin and Power2012; Chen et al., Reference Chen, Han, Fu, Zhang, Zhu and Zuo2016). The five major shale formations in North America have clay contents of 20–80% (Jarvie et al., Reference Jarvie, Hill, Ruble and Pollastro2007; Nelson, Reference Nelson2009; Slatt & O'Brien, Reference Slatt and O'Brien2011; Curtis et al., Reference Curtis, Sondergeld, Ambrose and Rai2012). Terrestrial shales in northern China have a slightly greater clay content than the marine shales in southern China, with the Lower Palaeozoic marine shales in the Upper Yangzi region having clay contents of 10–60% (Zhu et al., Reference Zhu, Ju, Qi, Huang and Zhang2018, Reference Zhu, Ju, Huang, Han, Qi and Shi2019, Reference Zhu, Huang, Ju, Bu, Li and Yang2021). Figure 1 shows a scanning electron microscopy (SEM) image of a shale sample from the Longmaxi Formation, with a matrix of clay grains containing more or less isolated quartz and calcite grains. The clay particles have strongly layered structures with variable orientations while remaining locally aligned. Significant clay fabric and phyllosilicate framework pores are present.
Low-magnification SEM image showing planar clay fabric and phyllosilicate framework pores caused by compaction and compression around resistant quartz and calcite grains from the Longmaxi Formation, 2651.09 m, Weiyuan Block, south-western Sichuan Basin.
The characteristics of shale oil/gas exploration and development are determined by the following microstructural characteristics of clay minerals: (1) shale oil/gas can be stored in significant quantities in clay minerals because they have a greater specific surface area and a stronger adsorption capacity than other inorganic minerals (Blattmann et al., Reference Blattmann, Liu, Zhang, Zhao, Haghipour and Montlucon2019; Zhang et al., Reference Zhang, Tang, He, Sun and Zou2020b; Zhu et al., Reference Zhu, Huang, Ju, Bu, Li and Yang2021); and (2) the clay content determines the plasticity of shale reservoirs (Xu et al., Reference Xu, Gou, Hao, Zhang, Shu, Lu and Wang2020; Zhang et al., Reference Zhang, Tang, He, Sun and Zou2020b; Wanyan et al., Reference Wanyan, Liu, Li, Zhang, Liu and Xue2023). Greater clay mineral concentrations often make it more difficult to develop shale oil/gas resources by hydraulic fracturing (Li et al., Reference Li, Liu, Jin and Wu2021). Extensive previous work has been carried out investigating the influence of clay microstructures on the storage and transport capacity of shales, and some knowledge of this relation has been obtained. Chen et al. (Reference Chen, Han, Fu, Zhang, Zhu and Zuo2016) identified six pore types related to clays in shale reservoirs according to their formation mechanisms and locations, namely (1) interlayer, (2) intergranular, (3) pore and fracture in contact with organic matter, (4) pore and fracture in contact with other minerals, (5) dissolved and (6) micro-cracks. Zhu et al. (Reference Zhu, Huang, Ju, Bu, Li and Yang2021) used a synergistic multi-scale multi-dimensional workflow employing field-emission/focused ion beam SEM (FESEM/FIBSEM), transmission electron microscopy and X-ray micro-tomography to visualize and quantify the nature of these clay-hosted pore networks. These authors observed three main types of clay-hosted porosities, and these visual results highlight the significance of clay microstructures in shale gas reservoirs because they are the dominant controllers of their petrophysical properties. Together with Ross & Bustin (Reference Ross and Bustin2009), they suggested that clay microstructures and the hosted pore networks play a crucial role in establishing the original hydrocarbon molecules that are in place and in the transport characteristics of the shale gas reservoir, and these are common parameters for reservoir quality evaluation and gas-bearing analysis. Additionally, clayey–silt sediments or clay-rich reservoirs have a significant impact on how natural gas hydrates behave during storage. The two main morphologies of natural gas hydrates in clayey–silt sediments – pore-filling and fracture-filling – are controlled by clay microstructures and fluid movement conditions (Li et al., Reference Li, Liu, Jin and Wu2021).
Four unconventional gas/liquid plays (Qiongzhusi, Wufeng-Longmaxi, Shihezi, Shahejie) of China are being drilled for unconventional gas/liquid reservoirs. This investigation focuses on clay microstructures and their associated pore types and pore networks in these formations. The specific objectives are to: (1) describe the general texture and fabric (e.g. grain morphology, grain size, grain arrangement, etc.) of the dominant clay minerals in the shales and mudstones; (2) define the pore types present for each clay type; and (3) discuss the influence of clay microstructures on porosity preservation and petrophysical variability.
Materials and methods
Sample characterization
The data for this study of clay microstructures and their hosted porosity come from cores, well-exposed outcrops and coal mine samples collected from various shale formations that are important shale gas/liquid reservoirs in China. The Cambrian Qiongzhusi and the Ordovician–Silurian Wufeng–Longmaxi shale samples, obtained from cores and outcrops, represent the classic model for marine source-rock deposition. The Permian Shihezi mudstones obtained from coal mines represent a classic marine–continental transitional source-rock deposition. The Palaeogene Shahejie Formation obtained from cores in the Bohai Bay Basin represents a classic model for lacustrine mudstone deposition. These formations were analysed to characterize clay mineralogy and microstructural development.
Methods
The mineralogical composition was determined using random-powder X-ray diffraction (XRD) with a Rigaku D/Max 2500 diffractometer, using Cu-Kα radiation at 40 kV and 100 mA. The clay fraction (<2 μm) was analysed sequentially under air-dried conditions (N), after solvation with ethylene glycol for 7.5 h (EG) at 60℃ and after heating at 550°C for 2.5 h, following the procedures outlined in El Halim et al. (Reference El Halim, Daoudi, El Ouahabi and Fagel2023). A semi-quantitative analysis was performed according to Cook et al. (Reference Cook, Johnson, Matti, Zemmels, Hayes and Frakes1975) for the total crystalline phases and the clay fraction with an estimated uncertainty of ±5%.
Recently, there has been an increasing interest in the microstructural characterization of mudstone and shale reservoirs, particularly with regards to the type, size, morphology, connectivity, distribution and influencing variables of pore fractures (Loucks et al., Reference Loucks, Reed, Ruppel and Jarvie2009, Reference Loucks, Reed, Ruppel and Hammes2012; Schieber, Reference Schieber2013). Mercury-pressure and gas-adsorption experiments can accurately and quantitatively characterize the pore space, but they cannot accurately determine the pore types and their relationships to grains because the pore structures are invisible; therefore, they do not reflect the true morphology of the pore space (Chen et al., Reference Chen, Lu, Liu, Han, Xu and Xue2018; Cai et al., Reference Cai, Lin, Singh, Zhou, Meng and Zhang2019; Bai et al., Reference Bai, Song, Fu, Shi, Liu and Chen2022). In this study, electron microscopy coupled with energy-dispersive spectrometry (EDS) were used, and some of the images were processed using the public domain software ImageJ to qualitatively and semi-quantitatively characterize the clay microstructure.
FESEM and FIBSEM are the most useful methods for characterizing the microscopic pore structure and mineral distribution of shales (Loucks et al., Reference Loucks, Reed, Ruppel and Jarvie2009; Schieber, Reference Schieber2013; Chen et al., Reference Chen, Han, Fu, Zhang, Zhu and Zuo2016; Zhu et al., Reference Zhu, Huang, Ju, Bu, Li and Yang2021). The FESEM experiments were performed using SUPRA55 SAPPHIRE and FEI Quanta FEG 450 microscopes equipped with an EDS device on surfaces prepared by Ar-ion milling. The steps of the shale FESEM experiment include pre-polishing, Ar-ion milling, carbon (or gold) plating and photography. Appropriately sized shale samples were selected and the scanning surface was polished with 200 grit coarse sandpaper followed by 2000 grit fine sandpaper repeatedly, and then a quantity of diamond suspension polishing solution was dripped onto the tempered glass for the pre-polishing process. The pre-polished sample was then placed on the Ar-ion polisher for ~2 h. The polished sample was fixed to the sample table with a conductive adhesive and the polished surface was carbon or gold sprayed before being placed in the FESEM device for scanning. FIBSEM was performed on samples using the FEI Helios NanoLab™ 600 DualBeam™ FIBSEM device. FIBSEM is a dual-beam system combining FIB cutting and SEM, which allows cutting, processing and real-time imaging of samples at the nanoscale. It enables the observation and analysis of shale pores in 2D and 3D with high stability and quality at nanoscale resolution by continuous cutting with a FIB (Ga-ion beam) and real-time imaging with an electron beam, and it is therefore widely used for the study of nanoscale pores in shale reservoirs. The general procedure for shale pore-structure studies using FIBSEM was, first, to place the sample into the sample chamber of the FIB micromachining system and, after evacuation, to observe the sample using SEM at a working distance of 4 mm. After selecting the appropriate section position, the sample stage was rotated by 52° so that the ion beam was perpendicular to the plane in which the sample was fixed, and the selected position of the sample was then cut using a Ga-ion beam of appropriate energy. After the sample had been cut by the ion beam, the section was parallel to the direction of the ion beam and could then be viewed directly by SEM.
Currently, the primary emphasis of FESEM and FIBSEM investigations is the morphological qualitative analysis of shale pores. In this study, we analysed the FESEM and FIBSEM images of shale samples using the image analysis program ImageJ. We then combined this processing with statistical approaches to provide quantitative data on the number, average diameter and areal porosity of the pores. The following three steps make up the image processing and quantitative data extraction processes in ImageJ software: (1) image reference scale setup; (2) pore identification in FESEM/FIBSEM images; and (3) pore quantitative data extraction. The shale pores were identified by adjusting the image threshold value, which was determined so that it best reflected the morphology of the shale pores. Finally, the shale FESEM and FIBSEM images were converted to black-and-white binary images via binarization to highlight the pore portion of the shale. The binarization of pore images involves two primary processes, which are as follows: (1) removing as much background noise as possible using the Bandpass Filter tool (Process–FFT–Bandpass Filter) to prevent it from being identified as a pore; and (2) choosing the pore region using the Threshold tool (Image–Adjust–Threshold) to first modify the threshold based on the pore's grey value and then adjusting the threshold based on the demands of the research to produce an accurate and comprehensive binary picture of the pore. Finally, granular analysis was used to extract the quantitative information from the shale images, and all detected shale pores were given numbers to create statistical data tables for each parameter. Therefore, these technologies were used to prepare the surfaces in order to image the clay microstructures of shales. These images are not ‘random’ in that we drove selection by the independent control of clay mineralogy and clay-hosted porosity. Each SEM image was taken perpendicular to the bedding plane. Clay-hosted porosity can be observed in the images regarding the size, morphology, quantity and location, which differed among the shale images. Pores can be observed within or between the clays themselves and their related aggregates.
Results and discussion
Clay mineralogy and morphology
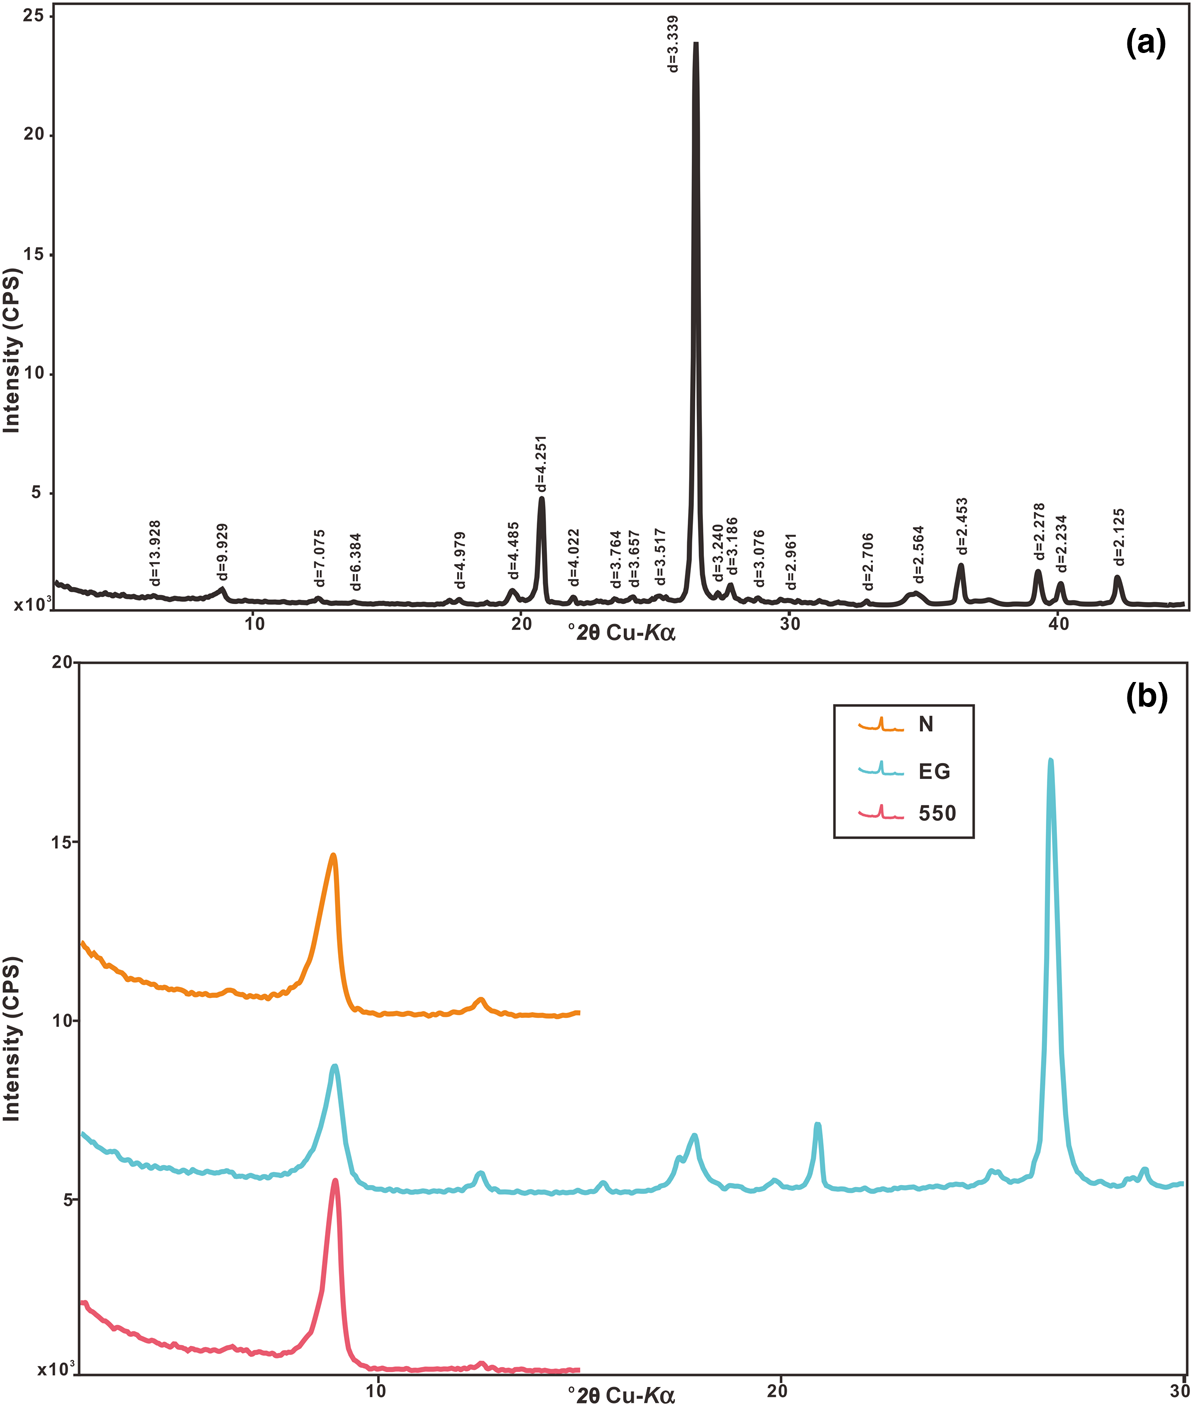
Recent studies have shown that the marine shales from the Sichuan Basin have the following composition: ~50–85% illite, ~15–40% mixed-layer illite–smectite (I-S) and ~0–20% chlorite (Chen et al., Reference Chen, Han, Fu, Zhang, Zhu and Zuo2016; Zhu et al., Reference Zhu, Ju, Qi, Huang and Zhang2018, Reference Zhu, Ju, Huang, Han, Qi and Shi2019, Reference Zhu, Huang, Ju, Bu, Li and Yang2021). A representative XRD trace of a whole shale is shown in Fig. 2a. Figure 2b shows the XRD trace of the clay fraction. The whole shale sample contains 30.2% total clay, of which 28% is mixed-layer I-S, 66% is illite and 6% is chlorite. Smectite is absent, being converted to mixed-layer I-S and illite. In contrast, the Permian Shihezi and Palaeogene Shahejie mudstones have variable contents of kaolinite of 2–71% (Bu et al., Reference Bu, Ju, Tan, Wang and Li2015; Zhang et al., Reference Zhang, Tang, He, Sun and Zou2020b). The content of kaolinite in the Palaeogene Shahejie mudstones is generally <14%. The illite, mixed-layer I-S and chlorite are indicative of diagenesis of the sediments.
(a) Bulk mineralogical composition of a shale sample obtained using XRD. (b) XRD traces of orientated clay fractions (air-dried (N), ethylene glycol-solvated (EG) and heated to 550°C). CPS = counts per second.

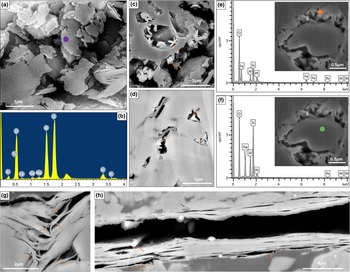
Figure 3a shows the presence of well-developed euhedral kaolinite platelets. The purple circle in Fig. 3a marks the location of the elemental spot analysis using EDS (Fig. 3b). The single crystal is in the shape of a pseudo-hexagonal plate, and the aggregate is mostly in book form and laminated. Chlorite particles are of various forms, with individual crystals being blade-like and acicular (Fig. 3c,d). Most chlorite flakes are scattered on the surface of the felsic or calcareous skeletal grains (Fig. 3c). A small number of chlorite flakes occur in the interiors of larger pores as aggregates such as fluffy spheres, rosettes and rounded cabbages (Fig. 3c,d). Chlorite often coexists with large feldspar crystals and is wrapped around the surface of the particles in the form of acicular monoliths (Fig. 3e,f). Nanoscale pores of ~50–200 nm in width exist between the coniferous chlorite monoliths (Fig. 3e,f). The orange circle in Fig. 3e and the green circle in Fig. 3f mark the locations of the elemental EDS spot analyses of chlorite and feldspar, respectively.
(a) FESEM image illustrating the kaolinite grains, showing the pseudo-hexagonal plate crystal habit, from the Lower Shihezi Formation, LuLing district, Huaibei coalfield, Anhui. (b) Semi-quantitative EDS spectra of O-, Si- and Al-rich minerals. The circle within (a) marks the location of the elemental spot analysis using EDS. Representative spectra at this location are shown and are consistent with a kaolinite mineral. (a) is modified after Zhu et al. (Reference Zhu, Ju, Lu, Han, Qi and Neupane2017). (c) FIBSEM image of chlorite as a grain-coating shale cement of variable morphology, from Wufeng-Longmaxi Formation. (d) FIBSEM image showing chlorite as a filler in the interiors of larger pores, from the Qiongzhusi Formation. (e,f) FESEM images and semi-quantitative EDS spectra illustrating intergrowths of feldspar and chlorite in the Wufeng-Longmaxi shale samples. The orange and green circles mark the analysed areas. In the top picture in (e) there is an area of chlorite, and the high O, Si, Fe and Al peaks in this spectrum are partially due to this chlorite. In the top picture in (f) there is area of feldspar, and the high O, Si, Na and Al peaks in this spectrum are partially due to this feldspar. (g,h) Examples of hair-like (filamentous) illite particles in the Silurian Longmaxi shale, which are modified after Zhu et al. (Reference Zhu, Ju, Huang, Han, Qi and Shi2019). cps = counts per second.

The FESEM or FIBSEM observations show that illite is rarely present as a single crystal and that illite aggregates tend to be hair-like (filamentous; Fig. 3g,h) or in some cases flaky. The illite mineral assemblages are generally twisted and curved, filling the pore space in a haphazard manner or wrapping around the surfaces of mineral grains to form clay films. Mixed-layer I-S is by far the most abundant mixed-layer clay in high-maturity marine shales (Ahn & Peacor, Reference Ahn and Peacor1986; Do Campo et al., Reference Do Campo, Bauluz, Nieto, del Papa and Hongn2016). The mixed-layer I-S crystals in natural mudrocks are arranged into sub-parallel aggregates, with predominant face-to-face contacts among the crystals. Additionally, such mixed-layer minerals are mostly wrapped around other particles or filled in pores in a disorderly segment shape, mostly of several hundred nanometres in size.
Clay-hosted pores and their qualitative characterization
During the burial process, the shales undergo diagenetic modifications such as compaction, thermal evolution, dissolution, clay transformation, recrystallization and authigenic mineral cementation, forming a variety of pore structures such as organic pores, dissolution pores, intergranular pores, interparticle pores and intraparticle pores (Loucks et al., Reference Loucks, Reed, Ruppel and Jarvie2009, Reference Loucks, Reed, Ruppel and Hammes2012). Interparticle and intraparticle clay pores formed by the compaction, dehydration and transformation of clay minerals are diverse and irregular. Slits or wedge-shaped pores are often developed between lamellar clay minerals such as chlorite and illite, which can also be filled with organic matter and pyrite grains. Based on the FESEM and FIBSEM image analyses, the clay-hosted pores can be classified into three main categories: interparticle clay pores, intraparticle clay pores and aggregate pores. All three types of pores are commonly developed in the shale samples, ranging in size from a few nanometres to a few micrometres.
Interparticle clay pores
Clay minerals are mainly deposited in the form of grain aggregates with well-developed interparticle pores. Some of these pores are primary in origin and are typically slit-shaped, long and triangular, with sizes ranging from hundreds of nanometres to several micrometres. These pores not only function as efficient storage spaces, but also interact with microfractures or relatively occluded intraparticle pores to form a well-connected pore–fracture network. Interparticle clay pores can be subdivided into four types: (1) elongated pores, (2) packed pores, (3) jagged pores and (4) card-house pores.
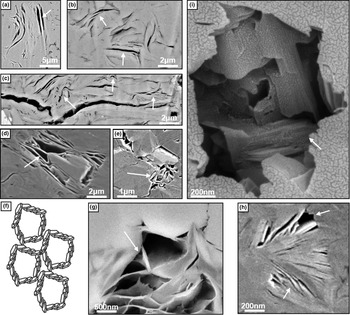
The direction of the long axis of the elongated pores usually follows the flat surface of clay minerals and can be several micrometres long (Fig. 4a,b). Such slit-like pores not only have a high storage capacity for adsorbed gas, but also are likely to act as seepage channels to enhance gas transport capacity.
(a,b) FIBSEM images illustrating elongated pores of the Longmaxi Shale, outcrop sample, Xiushan County, south-east Sichuan Basin. (c) FIBSEM image illustrating packed pores of the Longmaxi Shale, outcrop sample, Xiushan County, south-east Sichuan Basin. (d,e) FESEM images illustrating jagged pores of the Shahejie Shale, 3985.94 m, Qikou Sag, Bohai Bay Basin. (f) Diagrammatic sketch illustrating the ‘card-house’ of clay flakes. (g) FIBSEM image illustrating card-house pores of the Longmaxi Shale, outcrop sample, Xiushan County, south-east Sichuan Basin. (h) FESEM image illustrating card-house pores of the Shahejie Shale, 3898.02 m, Qikou Sag, Bohai Bay Basin. (i) FIBSEM image illustrating card-house pores of the Shihezi Shale, coal mines sample, Lin-Huan district, southern north China.
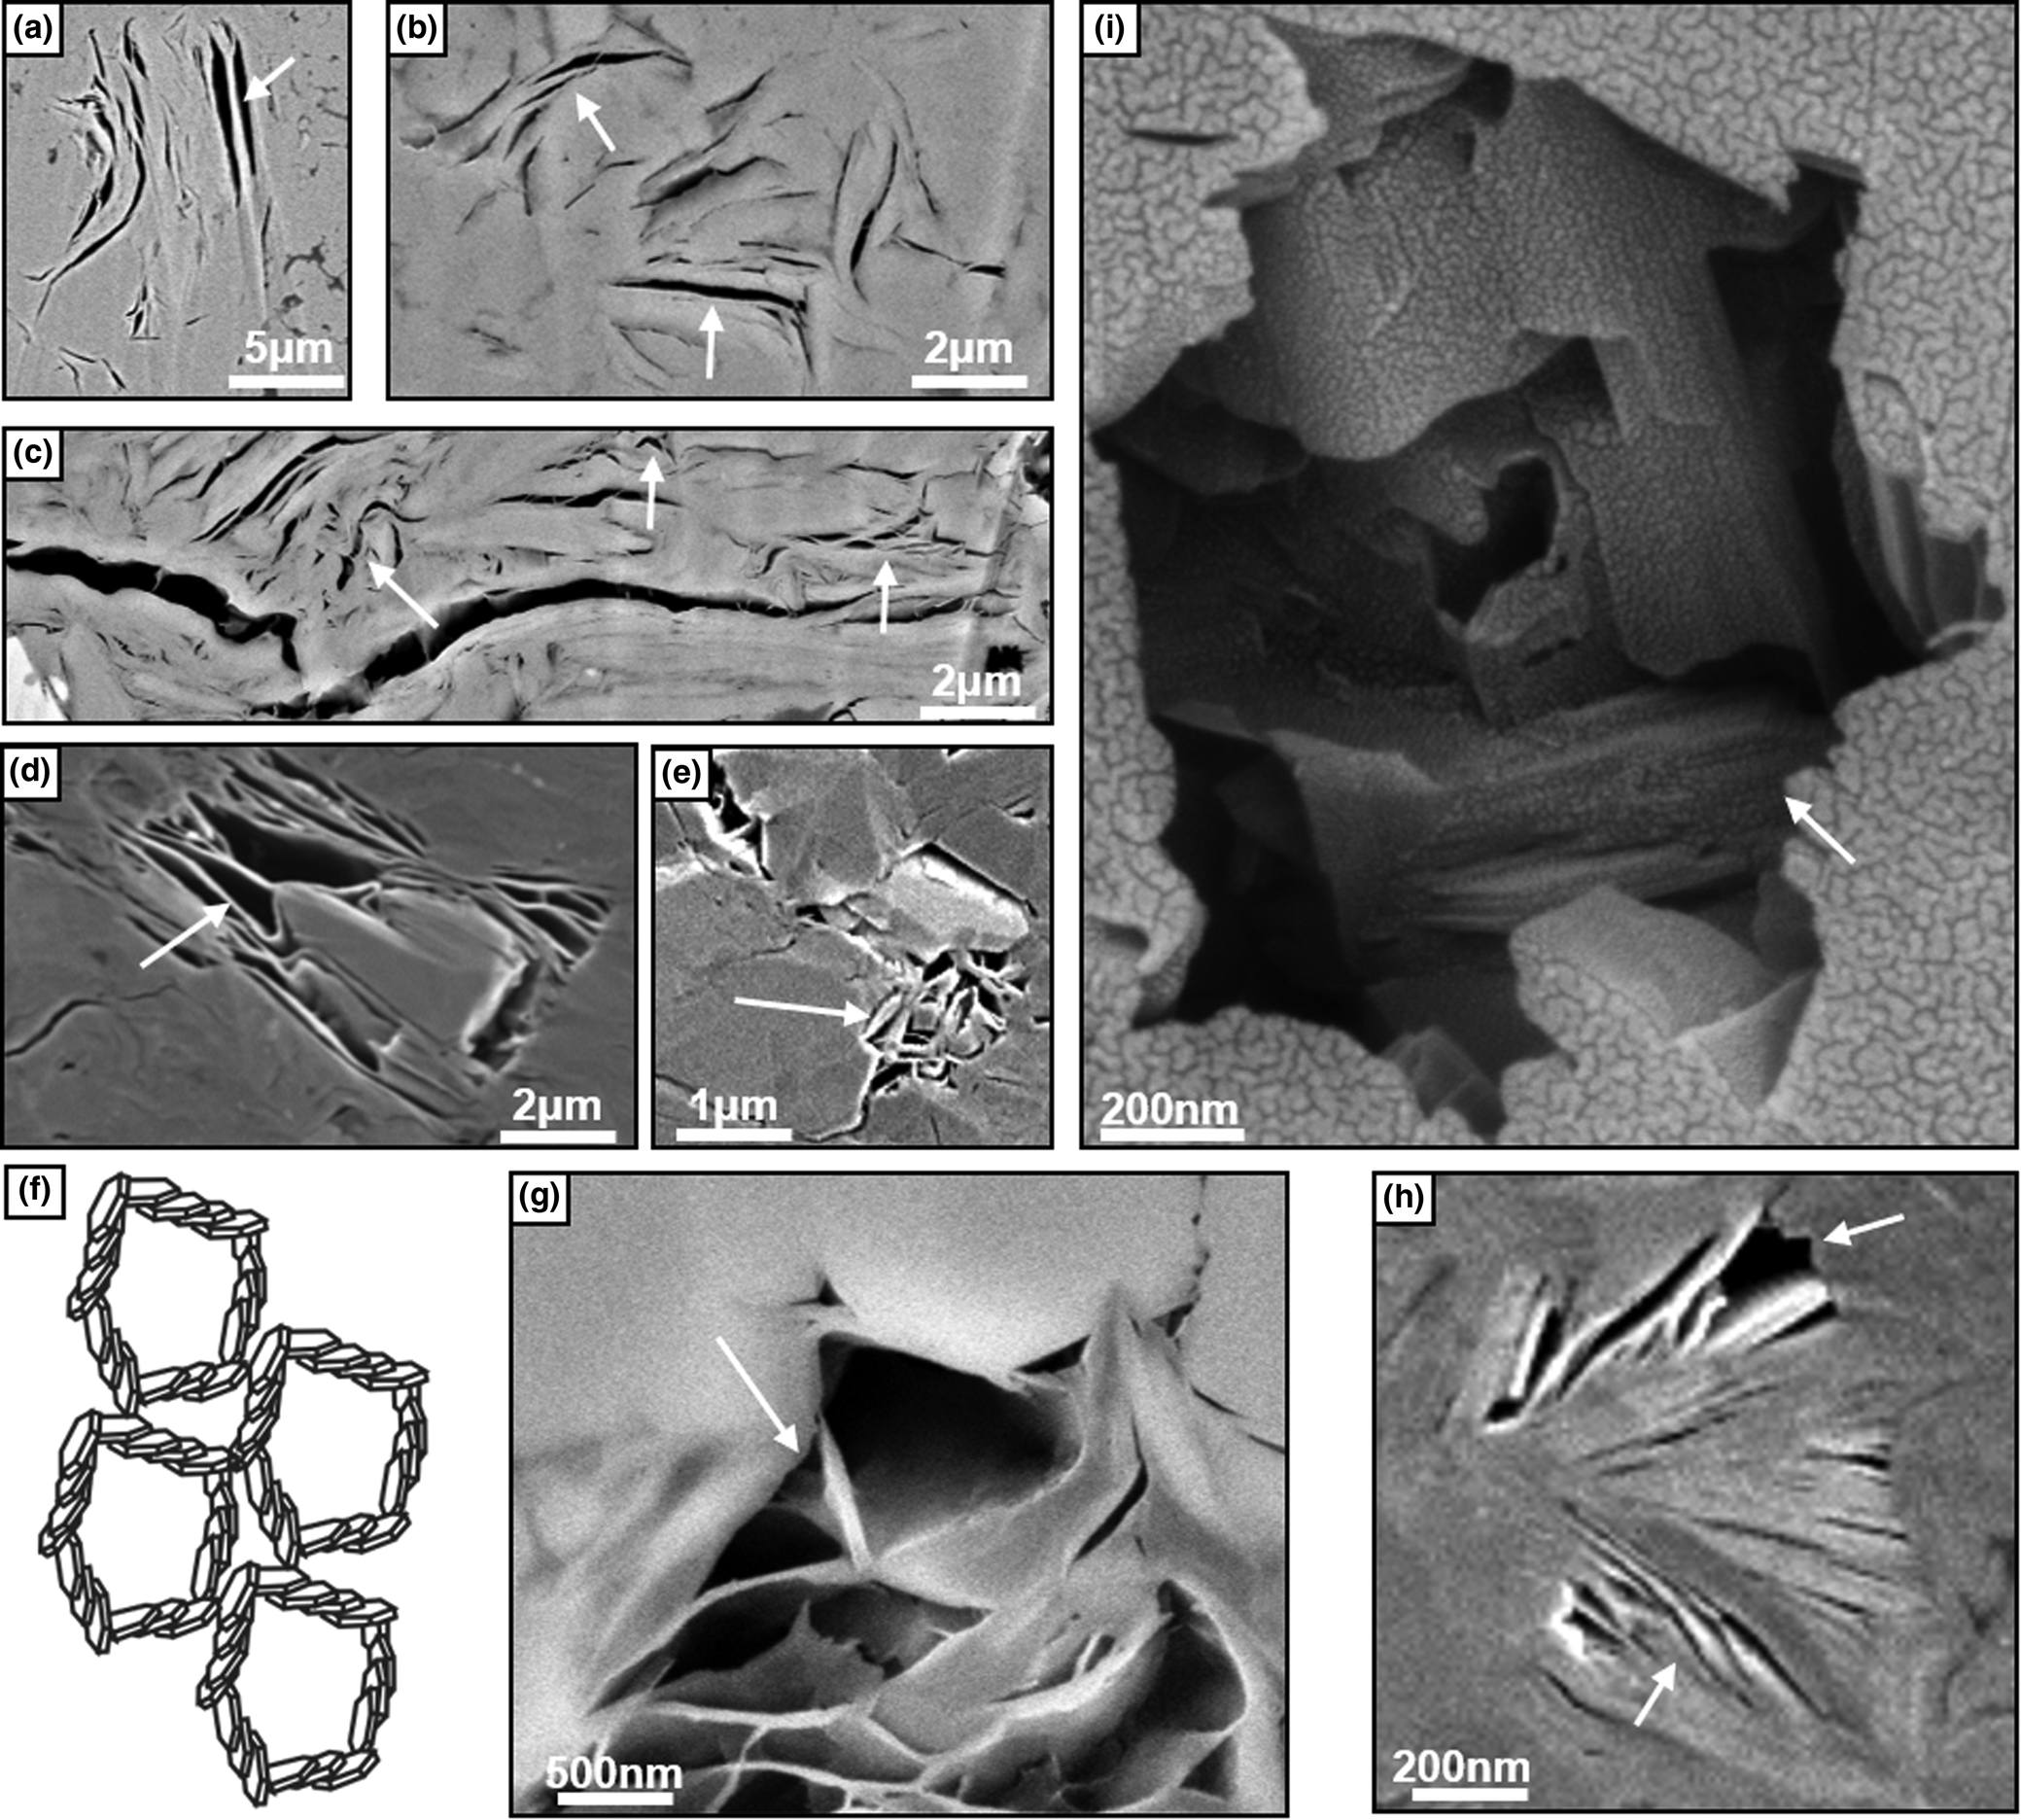
Triangular, rhombic, crescentic and polygonal packed pores have also been observed in the clay mineral assemblage in the shale samples, and their pore sizes tend to be hundreds of nanometres (Fig. 4c). Unlike the slit-like elongated pores between clay mineral sheets, triangular and crescentic pores do not have a uniform orientation due to the influence of tectonic extrusion, and they may have a larger pore volume.
When the thin sheets of clay minerals encounter rigid mineral particles, the clay sheets will bend and deform (Fig. 4d). Under the protective effect of rigid minerals, many large pores will be retained between the thin clay sheet and the rigid minerals; these pores are called jagged pores (Fig. 4d,e). The jagged pores associated with quartz, carbonate and pyrite grains can be well developed where abundant skeletal debris provides significant shelter porosity. The pore sizes are highly variable, ranging from 100 nm to 2 μm. Without the supporting protective effect of rigid particles, these pores tend to collapse and close under strong mechanical compaction.
Suspended clay minerals can form flocculated particles during deposition with an internal ‘card-house’ structure, and these can be deposited under high-energy hydrodynamic conditions to form interlacings (Slatt & O'Brien, Reference Slatt and O'Brien2011). After deposition, although most of the flocculated particles are crushed and destroyed by compaction and dewatering, a small amount of the clay minerals can be protected from compaction by the surrounding rigid particles and the ‘card-house’ is preserved. A large number of card-house pores may form (Fig. 4f–i). These pores have a very complex internal pore structure and may provide sufficient sorption sites for adsorbed methane.
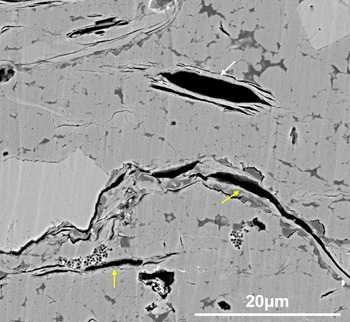
In addition, microfractures tend to form within clay aggregates (Fig. 5, indicated by white arrow) or within areas where clay minerals are in contact with other components (Fig. 5, indicated by yellow arrows) due to the shrinking effects of diagenesis. Such microfractures are usually parallel to the clay mineral lamellae and are closely related to the dewatering of the clay. Due to changes in ground temperature, fluids and other media during shale burial, clay minerals may lose significant amounts of interlayer water during dewatering of the shale and create stable minerals. This action can create a large number of pores and microfractures within the flocculated body or at the marginal parts of the particles. Such microfractures can connect intraparticle and interparticle pore spaces in the clay mineral assemblage, thus creating a 3D connected pore network. Microfractures in clay minerals can be observed under SEM showing good connectivity (Fig. 5), and these can be used as storage spaces and seepage channels for hydrocarbon molecules.
FIBSEM image illustrating microfractures formed within clay aggregates of the Longmaxi Shale, outcrop sample, Xiushan County, south-east Sichuan Basin.

Intraparticle clay pores
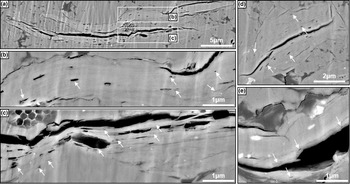
Intraparticle clay pores are usually secondary pores and most are probably diagenetic. The transformation of clay minerals from smectite to illite occurs during diagenesis, and small intraparticle pores are formed and preserved between illite particles (Ahn & Peacor, Reference Ahn and Peacor1986; Do Campo et al., Reference Do Campo, Bauluz, Nieto, del Papa and Hongn2016). The mixed-layer I-S is formed when part of the interlayer water of the smectite is removed during diagenesis, resulting in small areas of interlayer collapse and lattice rearrangement, and the illite and residual smectite produced during the dehydration process interact to stack and thus form pores. The secondary pores in secondary illite are tiny, ranging from a few nanometres to a few hundred nanometres, proportionate to how small secondary illite is (Fig. 6a–d). Additionally, these pores are linked to the stacking of clay flakes and the flocculation of clay minerals, which are transported and deposited as porous flocs, and this structure may remain largely unchanged through burial and diagenesis, allowing the pores to be well preserved (Fig. 6e). These pores are smaller in size and relatively regular in morphology, mostly exhibiting long, thin, short rods with long-axis lengths of up to several hundred nanometres and short-axis lengths of tens of nanometres, showing poor connectivity (Fig. 6). They have a large specific surface area and may adsorb abundant methane. In contrast to the interparticle pores, which generally diminish with compaction and cementation, the intraparticle clay pores are not noticeably affected by compaction and filling.
FIBSEM images illustrating intraparticle clay pores of the Longmaxi Shale, outcrop sample, Xiushan County, south-east Sichuan Basin. (a–d) FIBSEM images of the tiny secondary pores that developed in secondary illite particles. (e) FIBSEM image showing the tiny intraparticle clay pores developing at the edge of clay cracking.

Aggregate pores
The interparticle clay pores are often filled with migrating organic matter or idiomorphic pyrite particles to form organic–clay aggregates, pyrite–clay aggregates and organic–pyrite–clay aggregates. Most often organic–clay aggregates are reported from mudrocks, where they occur as grain aggregates (cf. Zhu et al., Reference Zhu, Ju, Huang, Chen, Chen and Yu2020). Clay minerals and organic matter are two important components of shale, and they can be combined during sedimentary evolution to form the organic–clay aggregates, which are natural parent materials for hydrocarbon generation and play an important role in the enrichment and preservation of organic matter in shale. Current research on organic–clay aggregates in mudrocks focuses on the relationship between organic matter and clay minerals and the catalytic hydrocarbon production of organic matter by clay minerals, while the evolution, modification and preservation of shale porosity by organic–clay aggregates is less well studied. The total organic carbon content of shale is positively correlated with the clay mineral content. Due to the adsorption properties of clay minerals, some of the organic matter can be adsorbed on the outer surface of the clay minerals. The total specific surface area of clay minerals correlated well with organic matter, further supporting the idea that organic matter exists between the clay mineral layers or within the clay pores (Kennedy et al., Reference Kennedy, Pevear and Hill2002, Reference Kennedy, Lohr, Fraser and Baruch2014).
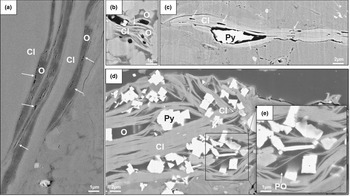
Organic pores are typically well developed in the organic particles that fill the interlayers of clay minerals (Fig. 7a,b). The spaces between the clay layers are preserved during the final stages of diagenesis when black mica or chlorite precipitates iron ions to create pyrite crystals. Some of these interparticle clay pores will receive significant support from the pyrite crystals that fill the clay interlayer, and they are able to resist some compaction. This allows for a particular amount and volume of pores to be preserved, establishing a residual pore space (Fig. 7c). The size of the pyrite crystals affects the size of these clay mineral pores. The size and volume of these pores increase with the size of the pyrite particles. Note that weathering dissolves the pyrite crystals completely or partially, leaving some pore space between the clay mineral particles. Significant variability in pore size and volume, good connectivity and strong adsorption are characteristics of these pyrite–clay aggregate pores, which might contribute to the adsorption and storage of hydrocarbons.
(a) FIBSEM image illustrating organic–clay aggregates and their related pore networks, from the Longmaxi Shale, outcrop sample, Yibin County, south Sichuan Basin. (a) is modified from Wang (Reference Wang2020). (b) FIBSEM image illustrating organic–clay aggregates and their related pore networks, from the Longmaxi Shale, outcrop sample, Xiushan County, south-east Sichuan Basin. (c) FIBSEM image illustrating pyrite–clay aggregates and their related pore networks, from the Longmaxi Shale, outcrop sample, Xiushan County, south-east Sichuan Basin. (d,e) FIBSEM images illustrating organic–pyrite–clay aggregates and their related pore networks, from the Longmaxi Shale, outcrop sample, Qianjiang County, south-east Sichuan Basin. (d) and (e) are modified from Zhu et al. (Reference Zhu, Ju, Huang, Han, Qi and Shi2019). Cl = clay; O = organic matter; PO = porous organics; Py = pyrite.

The third type relates to organic–pyrite–clay aggregates. Such shale microstructures are comparable to the clay-rich aggregates described by Zhu et al. (Reference Zhu, Huang, Ju, Bu, Li and Yang2021). However, we did not find significant interparticle porosity within such aggregates (Fig. 7d,e). In the FIBSEM image (Fig. 7d), the three components are almost in a tightly compacted state, with no visible porosity between the particles. Of note is the development of organic pores visible in the migrated organic matter between the clay layers (Fig. 7e). These pores are spherical in shape, but they are extremely small, with an average pore size of <100 nm.
The strain shadows created by the adjacent hard pyrite grains produce significant secondary porosity within the pyrite-related aggregates. However, even though the migrated organic matter generates a large number of nanopores, the filling impact of the organic matter and the decrease in interparticle pores reduced porosity within the organic–clay aggregates and organic–pyrite–clay aggregates.
Clay-hosted pores and their semi-quantitative characterization
Numerous techniques have been applied recently to quantitatively analyse the pore structure of shales (Loucks et al., Reference Loucks, Reed, Ruppel and Jarvie2009, Reference Loucks, Reed, Ruppel and Hammes2012; Schieber, Reference Schieber2013; Chen et al., Reference Chen, Lu, Liu, Han, Xu and Xue2018; Cai et al., Reference Cai, Lin, Singh, Zhou, Meng and Zhang2019; Bai et al., Reference Bai, Song, Fu, Shi, Liu and Chen2022). Low-pressure gas adsorption and mercury intrusion methods are the two experimental techniques that are most frequently used to characterize pore structure quantitatively, but the results obtained using these techniques cannot be matched to any kind of pore structure, and the range of calculated pore sizes is also severely constrained by the experimental conditions. For instance, the relative pressure (P/P 0) range for CO2 adsorption is controlled from 0.001 to 0.995, which can only test pores in the diameter range of ~0.3–1.5 nm, and the relative pressure range for N2 adsorption is ~0.0001–0.03, which can only test pores in the diameter range of ~1.2–80 nm. Nuclear magnetic resonance is mainly used to obtain pore-size distributions by converting relaxation times to pore radii, but the method remains controversial (Zhu et al., Reference Zhu, Ju, Qi, Huang and Zhang2018). Small-angle scattering experiments and computed tomography scanning techniques are expensive and require high-level data interpretation (Hemes et al., Reference Hemes, Desbois, Urai, Schroppel and Schwarz2015).
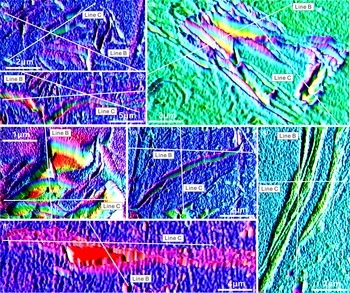
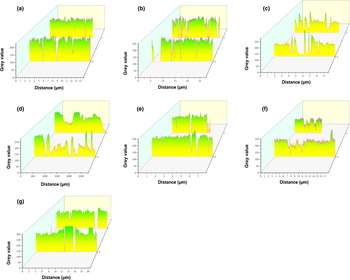
ImageJ is a powerful Java-based image processing software developed by the National Institutes of Health (NIH), which has been used extensively in scientific research and is now used in the fields of biology, materials science and earth science. This software can be used to calculate the number of pores, pore size, pore area, pore perimeter and roundness in unconventional oil and gas fields. In this paper, the ImageJ software was used to quantify the pore size and distribution characteristics of various types of clay-hosted pores. We selected seven typical SEM images of clay-hosted pores and used the ImageJ software to identify and statistically analyse each type of pore structure according to statistical parameters including pore quantity, pore size, areal porosity, etc. The software can also be applied to obtain the 3D structure of the pore surface (Fig. 8) and the pore profiles (Fig. 9) at locations of interest.
Morphologies and 3D pore spaces obtained using ImageJ of seven typical clay-hosted pores in a clay matrix (labelled (a)–(g)). The white lines indicate the locations of the 2D profiles of pore topography shown in Fig. 9.

The 2D profiles of pore topographies obtained using ImageJ of seven typical clay-hosted pores in a clay matrix (labelled (a)–(g)).

The various colours present in the graph in Fig. 8 represent the undulations or heights of the pore morphology, converting the 2D pore surface into a 3D pore structure. By studying the degree of development of the pore structure, connectivity, pore network and roughness of the pore surface from these 3D pore images, we are able to clearly see the microstructural features inside the pores and infer the impacts of these pores on methane storage or transport. The internal pore spaces of the jagged pores, card-house pores and pyrite–clay aggregate pores are more developed and have high connectivity inside the clay aggregates (Fig. 8c,d,f). The positions of the pore profiles in Fig. 9 are shown on each image in Fig. 8 with white lines. As much of the primary clay structure in the image as feasible is covered by the white lines as they expand in a certain direction. Figure 9 illustrates the profile development of the seven pore types. The density of the pores, the roughness of the pore surface and the extent to which the pores extend into the interior can be estimated by counting the peaks and troughs on the profile lines. We can also determine the extent to which the pores extend into the interior, inferring the degree to which the pore spaces are developed in 3D.
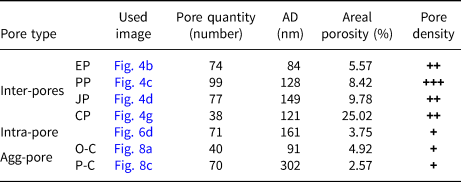
Table 1 lists the pore structural parameters of the seven different types of clay-hosted pores. The main features are outlined below:
(1) The packed pores are most abundant, followed by elongated pores and jagged pores, whereas the intraparticle pores are the least developed. Due to the large number of packed pores, these are conducive to hydrocarbon molecule storage and migration.
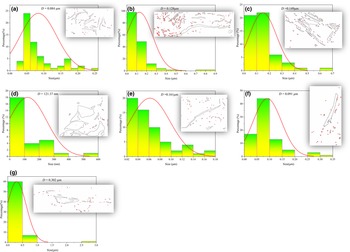
(2) The average pore width of clay-hosted pores can be as small as 84 nm, and these pores are typically nanoscale in size. Figure 10 illustrates the pore-size distribution of the seven types of pores. The majority of the elongated pores have diameters of 50–100 nm, with an average pore size of 84 nm. The packed pores have an average pore size of 128 nm, with most pores being 100 nm wide. The jagged pores have an average pore size of 149 nm, with most pore diameters being <200 nm. The card-house pores have an average pore size of 121 nm, with most pore diameters being <100 nm. Most intraparticle pores are ~60 nm, with the average pore size being 161 nm. Organic–clay aggregates have an average pore size of 91 nm, with most pore diameters being between 50 and 100 nm. Finally, the pyrite–clay aggregate pores have an average pore size of 302 nm, with most pore diameters being 500 nm. The largest average pore diameter is 302 nm (pyrite–clay aggregate pores) and the smallest pore diameter is 84 nm (elongated pores).
(3) The areal porosity of different types of clay pores ranges from 2.57% to 25.02%, with an average value of 8.58%. Card-house pores were few in number, but they had the largest areal porosity (25.02%), which was over five times greater than that of the other pore types. This suggests that the number of pores is not the primary factor influencing the level of pore development.
(4) According to SEM observation, packed pores and organic–clay aggregate pores have the lowest pore densities on the plane, whereas intraparticle pores have the greatest. As a result, it can be concluded that packed pores can significantly improve the porosity and permeability of shale oil/gas reservoirs, whereas intraparticle pores and organic–clay aggregate pores have a weaker effect and perhaps even do not promote the development of permeability.
Semi-quantitative characteristics of clay-hosted pores in the investigated shale samples, derived from SEM and ImageJ.

Notes: Seven clay-hosted pore types were qualitatively recorded from SEM images and classified as trace (+), common (++) or abundant (+++) due to their pore density. AD = average pore diameter; agg-pore = aggregate pores; CP = card-house pores; EP = elongated pores; inter-pores = interparticle clay pore; intra-pore = intraparticle clay pore; JP = jagged pores; O-C: organic–clay; P-C: pyrite–clay; PP = packed pores.
Pore-number fractions and pore-size contribution distributions of clay-hosted pores based on SEM data and ImageJ of seven typical clay-hosted pores in a clay matrix (labelled (a)–(g)). The D values in the images represent the average pore diameters. The colour gradient on the vertical bars indicates the number of pores at a given bin size and the red curves indicate the percentage of the distribution. Insets: schematic diagrams of the locations of pore development, 2D contours and number of pores based on ImageJ identification.

Influence of clay microstructures on reservoir quality
Shale oil/gas reservoirs have abundant nanopores, including organic pores and clay-hosted pores, especially in the 100 nm pore-size range, which offer substantial volumes and sorption surfaces for methane storage (Ross & Bustin, Reference Ross and Bustin2009; Chen et al., Reference Chen, Lu, Liu, Han, Xu and Xue2018). The development of shale reservoir enrichment theories and methods is challenging due to the complicated condition of methane in nanoscale adsorption media and the variable transport mechanisms. The capacity of shale microstructures to adsorb gas depends on both the size of the organic and mineral particles and the degree of pore formation (Zhu et al., Reference Zhu, Ju, Huang, Chen, Chen and Yu2020). The reactivity of the grain surface and the capacity for adsorption are directly influenced by the specific surface area. The clay minerals content can reach up to 80%, controlling the specific surface area of the shale. In a statistical study of shale pore characteristics, Ross & Bustin (Reference Ross and Bustin2009) concluded that there was a good positive correlation between the clay content and the pore specific surface area. The formation of shale pore networks is connected to clay minerals since the volumes of micropores, mesopores and macropores dramatically increase with increasing clay mineral concentration (Zhang et al., Reference Zhang, Tang, He, Sun and Zou2020b). Clay types and their related microstructures determine the size of the pore volume and specific surface area, which is further supported by previous work showing that an increase in the contents of illite and mixed-layer I-S increases pore volume and pore specific surface area, whereas an increase in chlorite inhibits the development of pore structures (Houben et al., Reference Houben, Desbois and Urai2013; Zhu et al., Reference Zhu, Huang, Ju, Bu, Li and Yang2021). The adsorption behavior and storage mechanisms of hydrocarbon molecules on the surface and inside the clay-hosted pores over wide ranges of pore sizes, pressures (≤50 MPa) and temperatures (≤380 K) are currently being studied extensively using the Grand Canonical Monte Carlo and molecular dynamics methods. The results show that methane density distribution, absorbed site and adsorption capacity are negatively correlated with pore size, and the methane molecules have a higher aggregation density and stronger adsorption capacity in pores of small size (Chen et al., Reference Chen, Lu, Liu, Han, Xu and Xue2018).
Numerous studies have demonstrated that reservoir characteristics such as water content, porosity and permeability, as well as total gas capacities and gas transport, are directly influenced by the amount, type, distribution and hosted pore structure of clays in mudstones, shales and sandstones (Jarvie et al., Reference Jarvie, Hill, Ruble and Pollastro2007; Nelson, Reference Nelson2009; Ross & Bustin, Reference Ross and Bustin2009; Slatt & O'Brien, Reference Slatt and O'Brien2011; Hemes et al., Reference Hemes, Desbois, Urai, Schroppel and Schwarz2015). The clay mineral content is one of the factors that affect the physical properties of shale reservoirs (Houben et al., Reference Houben, Desbois and Urai2013; Hemes et al., Reference Hemes, Desbois, Urai, Schroppel and Schwarz2015). Generally, porosity and permeability decrease with increasing clay concentration. Clay minerals in shale or tight sandstone reservoirs usually occur in filled, semi-filled or cemented forms. Therefore, the increase in clay content leads to the large interparticle and intraparticle pore spaces being filled and cemented, thereby altering the pore throat and affecting reservoir porosity and permeability. For example, illite has the characteristic of growing from the pore edges to the centre of the pore, causing the pore throat to become convoluted and even to form a grid or bridging type of cementation, creating an obstruction to the flow of hydrocarbons (Zhu et al., Reference Zhu, Huang, Ju, Bu, Li and Yang2021). As a result, reservoir porosity and permeability are relatively low in formations with relatively high illite content. In addition, chlorite is predominantly flaky and mainly covers the surfaces of brittle particles such as quartz and calcite, forming a pore liner that narrows the pore throat of large pores. These clay liners reduce the effective radius of the pore space, especially for narrow pore throats, and often cause blockages, thus adversely affecting porosity and permeability. In contrast to illite, the influence of chlorite on the porosity and permeability of shale reservoirs is not significant (Chamley, Reference Chamley1989).
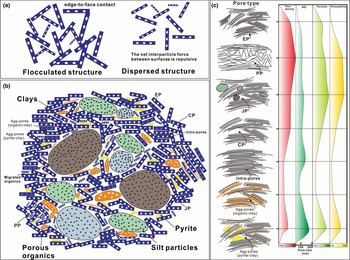
Porosity and permeability are both significantly influenced by the microstructural organization of the clay (Houben et al., Reference Houben, Desbois and Urai2013; Hemes et al., Reference Hemes, Desbois, Urai, Schroppel and Schwarz2015). According to our SEM images, there are two main modes of arrangement of clay domains and clay platelets: flocculated structures and dispersed structures. For the same void ratio, the porosity and permeability of the rocks will be greater in flocculated structures as compared to dispersed structures (Fig. 11a). Flocculated structures describe clay particles with edge-to-edge or edge-to-face connections, whereas dispersed structures show no face-to-face association of clay particles. The net interparticle force between surfaces is repulsive in dispersed structures. This is clearly shown in our visualization and quantification data, where the growth of elongated pores and intraparticle pores dominates flocculated structures, whereas packed holes, jagged pores, card-house pores and clay–pyrite aggregate pores are more abundant in flocculated structures (Fig. 11). Elongated pores and intraparticle pores have substantially lower pore numbers, average pore sizes, areal porosities and pore densities than other pores (Table 1). Figure 11b shows a schematic representation of an idealized clay-rich shale matrix. Seven types of pore structure associated with clay minerals are marked in this diagram. The microstructural features of each type of clay-hosted pore are depicted in close up in Fig. 11c. The contribution of each pore type to reservoir porosity and permeability is also assessed based on the quantitative data.
(a) Schematic illustration of two clay microstructural arrangements. (b) Model of an idealized clay-rich shale matrix, within which developed significant clay-hosted pore networks. (c) Schematic diagram relating the observed changes in pore density, pore size, porosity and permeability to seven clay-hosted pore types. Black dashed lines on the pore density, pore size, porosity and permeability curves indicate the positions of the clay-hosted pores imaged. (a) and (b) are modified after Zhu et al. (Reference Zhu, Huang, Ju, Bu, Li and Yang2021). AD = average pore diameter; agg-pore = aggregate pores; CP = card-house pores; EP = elongated pores; intra-pore = intraparticle clay pores; JP = jagged pores; PP = packed pores.

The visualization and quantitative data from this study demonstrate that the robust pore space results in larger packed pores, jagged pores and pyrite–clay aggregate pores. Due to their distinct microstructures and the impacts of the stiff particles around them, several clay domains and clay platelets can maintain a certain level of porosity during the compaction of the shale formation. Due to the protective function of the stiff particles, which makes these pore throats less vulnerable to alteration, these particles also have a favourable impacts on permeability. The jagged pores and pyrite–clay aggregate pores are less likely to impede the flow of hydrocarbons due to the influence of quartz and pyrite particles, which increase the pore throat size. The jagged pores and pyrite–clay aggregate pores can be classified as demonstrating shelter porosity. Schieber (Reference Schieber2013) suggested that such shelter pores generally increase in abundance with increasing clay content in some compacted or tight shales and mudstones due to the presence of pressure shadows generated adjacent to mechanically competent grains (quartz, pyrite and carbonate grains), which can resist compaction and deformation. Although packed pores may be abundant, their areal porosity, pore density and pore structure are prone to clay mineral swelling or flocculation, leading to low and inconsistent permeability. By contrast, elongated pores and intraparticle pores have a small pore radius with poor pore connectivity, resulting in a negative impact on the physical properties of shale reservoirs.
Conclusions
FESEM and FIBSEM are direct analytical techniques that facilitate the characterization of clay microstructures and their hosted porosities of unconventional gas/liquid reservoirs at a resolution from the microscale to the nanoscale. The key conclusions from FESEM and FIBSEM image analyses of four typical clay-rich shales and mudstones of China are as follows:
(1) Qualitative and semi-quantitative investigations using SEM images and the public-domain software ImageJ provide significant information regarding clay-hosted pore type, 3D pore surface, 2D pore profile, pore quantity, pore size and areal porosity.
(2) FESEM and FIBSEM images provide an appreciation of the complexity of the clay-hosted pore networks, confirming the interconnection between clay microstructures with porosity preservation and petrophysical variability.
(3) Visual observations highlight complex pore structures related to clay microstructures and demonstrate that a finite number of clay-hosted pore types exist despite considerable variability in clay composition, clay content and depositional setting. The three major pore types are interparticle clay pores, intraparticle clay pores and aggregate pores. Interparticle clay pores include four subtypes: elongated pores, packed pores, jagged pores and card-house pores.
(4) A large quantity of the shelter porosity of the jagged pores and pyrite–clay aggregate pores results from pressure shadows generated adjacent to mechanically competent grains. The development of these two shelter pore types highlights the importance of understanding the porosity preservation and gas transmission of shale gas/liquid reservoirs.
Acknowledgements
The authors thank the anonymous reviewers for their helpful reviews of the manuscript and the Principal Editor for constructive suggestions and comments on this work.
Financial support
This research was financially supported by the National Natural Science Foundation of China (42102186), the Science and Technology Project of Hebei Education Department (BJK2022018), the SINOPEC Key Laboratory of Geology and Resources in Deep Stratum (33550000-22-ZC0613-0240) and the Opening Foundation of State Key Laboratory of Continental Dynamics, Northwest University (21LCD10).
Conflicts of interest
The authors declare none.