


Introduction
Snow avalanches are a significant, life-threatening hazard throughout the mountains of the western United States, where they cause more deaths on average than earthquakes or landslides (Reference VoightVoight and others, 1990). Death tolls in recent years have been rising due to increased recreational use of the back country by skiers, snowboarders and snowmobilers. Through the 1990s, fatalities in the United States rose to nearly 30 people a year (http://www.caic.state.co.us, 2000). In addition, avalanches destroy buildings and disrupt transportation networks and recreational facilities each winter. Estimates of the economic losses associated with avalanches in the western United States total more than a million dollars a year (Reference VoightVoight and others, 1990). The best way to mitigate rising death and damage tolls is through better prediction of avalanche hazard. This paper links avalanche conditions to atmospheric patterns at a daily time-scale at four sites in the western United States in order to better understand those linkages, and to help predict avalanche conditions.
Since avalanche conditions are closely related to past and current weather conditions, and long-term weather forecasting is steadily improving, understanding the relationship between atmospheric circulation patterns and avalanche activity might allow us to better anticipate future avalanche conditions. Reference BjornssonBjornsson (1980) described the synoptic conditions that resulted in major avalanche cycles in Iceland, and provided surface maps based on recent experience. Similarly, individual case-studies of extreme avalanche events and the associated general circulation patterns have been conducted in India (Reference Rangachary and BandyopadhyayRangarchary and Bandyopadhyay, 1987), Turkey (Reference Gurer, Tuncel, Murat Yava§, Erenbilge and SayinGürer and others, 1995) and New Zealand (Reference FitzharrisFitzharris, 1976; Reference Moore and MarcusMoore and Marcus, 1983). Research in Canada has focused on the long data record available at Roger’s Pass. Reference Fitzharris and SchaererFitzharris and Schaerer (1980) compared atmospheric circulation patterns during major and minor avalanche winters at a seasonal time-scale to come up with a description for the conditions that lead to major avalanche winters. Subsequently, Reference FitzharrisFitzharris (1987) used synoptic typing to more stringently classify the conditions leading to significant avalanching, and he used sea-level pressure anomaly maps to identify anomalous circulation conditions that led to those conditions. Reference Fitzharris and BakkehoiFitzharris and Bakkehoi (1986) conducted a similar analysis for Norway, but chose extreme avalanche winters based on the number of avalanche fatalities.
Relatively few studies have attempted to look at the variable atmospheric conditions leading to avalanche cycles in different parts of a region, which is one aspect of the present research. In Switzerland, Reference HächlerHachler (1987) used data from the Swiss Federal Institute for Snow and Avalanche Research to define a number of prominent historical avalanche events. These case-studies showed how synoptic conditions differed significantly for creating dangerous avalanche conditions in Switzerland’s Northern and Southern Alps. The direction of the upper-level airflow in relation to the orientation of the mountains and the distance to the nearest ocean were key factors for determining optimal conditions leading to prolonged, vigorous storms and large avalanches. Subsequently, Reference Laternser, Pfister and MatthewsLaternser and Pfister (1997) applied this synoptic information to assess the relationship between synoptic weather patterns and extreme avalanche periods of the last 500 years.
In the United States, much research relating avalanches and climate has focused on the delineation of the western United States and Alaska into continental, intermountain and coastal regions (Roch, unpublished; Reference LaChapelleLaChapelle, 1966; Reference Hackett and SantefordHackett and Santeford 1980; Reference Armstrong and ArmstrongArmstrong and Armstrong, 1987; Reference Mock and KayMock and Kay, 1992; Reference MockMock, 1995, Reference Mock1996a). Alta, Utah (Reference Mock and KayMock and Kay, 1992), several Colorado sites (Reference MockMock, 1995) and Alyeska, Alaska (Reference MockMock, 1996a), have been the subject of case-studies using monthly climate and avalanche data to investigate how atmospheric conditions vary between months with many avalanches and those with only a few, but this research utilized only monthly data. Reference Birkeland and MockBirkeland and Mock (1996) used daily data to investigate the relationship between atmospheric circulation and snowfall conditions at Bridger Bowl, Montana, but did not correlate those findings to avalanche activity However, their study, and some recent snow climatology research (e.g. Reference Serreze, Clark, Armstrong, McGinnis and PulwartySerreze and others, 1999), illustrates the importance of assessing topographic aspects that may relate to the predominant synoptic-scale patterns conducive to avalanching.
The present research builds on the above past studies. First, we use daily data for our analyses, which is the time-scale of the data commonly used by avalanche forecasters. Second, we attempt to quantitatively define avalanche extremes, rather than investigate case-studies. Third, we use multivariate statistical analyses to determine which climatological variables are most useful for predicting extreme avalanche conditions. Fourth, we construct 500 hPa composite anomaly maps using selected extreme avalanche days to define the anomalous atmospheric conditions leading to those extremes. Finally, we use data from four sites with similar snow-avalanche climates to investigate the spatial variability of these linkages between extreme avalanche days and atmospheric circulation patterns.
Methods
Data
This study utilizes avalanche and climate data from the West-wide Avalanche Network (WAN), which is currently the longest-established high-elevation climate and avalanche database in the United States. WAN started through the efforts of the U.S. Forest Service in the late 1960s (Reference Judson, Gold and WilliamsJudson, 1970). All WAN sites are located close to avalanche paths and runout zones, and the daily data collected include the number and size of avalanches, as well as climatic data such as maximum and minimum temperatures, total snow depth, new snowfall, snow water equivalent (SWE) and measured rainfall. Avalanche data follow the U.S. recording system (Reference Perla and MartinelliPerla and Martinelli, 1976; Reference McClung and SchaererMcClung and Schaerer, 1993). We supplement these data with daily calculations of 2 and 3 day new snowfall and SWE totals because of the importance of persistent storms in creating dangerous avalanche conditions (e.g. Reference Davis, Elder, Howlett and BouzaglouDavis and others, 1999). A drawback of the WAN data is that avalanches are recorded at ski areas and are largely the result of explosive control work. Still, these data are generally indicative of hazardous avalanche conditions, because the ski areas typically conduct control work when the overall avalanche danger is high.
Daily circulation data for this research come from ajoint project between the U.S. National Center for Environmental Prediction (NCEP) and the U. S. National Center for Atmospheric Research (NCAR) called the NCEP/NCAR 40 year re-analysis project (ftp.cdc.noaa.gov). The re-analysis data use previously observed climate data of temperature, wind speed and pressure measured from land surface, ship, aircraft and radar from 1957 to 1998 (Reference KalnayKalnay and others, 1996). A three-dimensional forecasting model was initialized with the observational data and then interpolated onto a system of grids. Output from the forecasting model is a simulated dataset representing re-analyzed data at 6 hourly, daily and monthly time-steps (Reference KalnayKalnay and others, 1996). For this research we used the daily data, which are averages of the 6 hourly data (observation times of 0000, 0600, 1200, and 1800 UTC) for each day. The objective of the re-analysis project is to produce meteorological fields, many unobservable, for analyzing the spatial and temporal variability of the climate system. The data are global and are arranged in a gridded format with a spatial resolution of 2.5 × 2.5° for circulation. Daily 500 hPa pressure heights are used in this study to represent longwave ridges and troughs (Reference HarmanHarman, 1991).
Study sites
The western United States has three primary avalanche climate zones: coastal, intermountain and continental. Though the existence of these zones was first recognized by Roch (unpublished) and later described in detail by Reference LaChapelleLaChapelle (1966), the WAN data have resulted in a number of quantitative studies that have confirmed the general classification (Reference Armstrong and ArmstrongArmstrong and Armstrong, 1987; Reference Mock and KayMock and Kay, 1992; Reference MockMock, 1995). In essence, the coastal zone of the Pacific mountain ranges is characterized by abundant snowfall and relatively warm temperatures which result in a relatively strong snowpack. Consequently, most avalanches in coastal areas result from large snowfalls. Low temperatures and relatively scarce snowfall, resulting in a weak snowpack, characterize continental avalanche climates. In this zone, avalanches may result from small storms which overload buried weaknesses in the snowpack. The intermountain zone of Montana, Wyoming, Idaho and Utah is intermediate between the two, and may have either continental or coastal conditions depending on the given winter. For this research we selected four sites: Bridger Bowl, Montana; Jackson Hole, Wyoming; Alta, Utah; and Taos, New Mexico (Fig. 1). The avalanche climate of the first three of these is intermountain, while most previous work has classified Taos as continental. However, recent research using a binary classification scheme reveals that Taos classifies predominantly as intermountain (Reference Mock and BirkelandMock and Birkeland, 2000). Thus, the four sites have somewhat similar snow and avalanche conditions, but vary considerably in latitude, allowing us to investigate the spatial variations in the relationship between atmospheric conditions and avalanches at sites throughout the intermountain zone.
Map of the western United States showing the location of our four study sites: (1) Bridger Bowl, (2) Jackson Hole, (3) Alta and (4) Taos.

Data analyses and mapping
We simplified the daily WAN avalanche data to analyze those data at a number of sites by constructing an avalanche hazard index. WAN avalanche data consist of daily records of the location and size (on the 1–5 United States scale) of each avalanche. We constructed the avalanche hazard index by squaring the recorded size of the individual avalanches and summing them up for each day. We squared the avalanche data because some conditions lead to a large number of small avalanches that are often relatively harmless, while larger avalanches are more indicative of conditions that might lead to facilities damage and widespread instabilities in the snowpack in the surrounding back country.
Next, we conducted a varimax rotated principal-components analysis (PGA) on all the data for each of our four sites. The PGAs were run on time-attribute data matrices, where the variables consisted of the nine climate variables discussed previously, and the cases consisted of each day of record for each site. This gave several components, which are orthogonal linear combinations of the original variables. Component scores representing each component were also derived for each day. Scores greater than +1 or less than –1 represent values greater than the standard deviation, and therefore represent “abnormal” or anomalous conditions (Reference GorsuchGorsuch, 1983; Reference ManlyManly 1990). Subsequently, we defined avalanche extremes using the calculated avalanche hazard index for each site, and selected the top 10% of days with recorded avalanches as “extreme”avalanche days. This 10% level was chosen to balance a need for sufficiently unique days in terms of avalanche hazard with the requirement of large enough datasets for subsequent analyses. We examined the component scores to determine which climatic variables were most important in determining avalanche extremes, focusing on whether the component score had the same sign as the component and exceeded one standard deviation.
The final step of our analysis involved creating composite-anomaly maps of the atmospheric conditions existing during avalanche extremes. Composite-anomaly maps exhibit relationships between large-scale atmospheric circulation patterns and surface climate responses (Reference StiddStidd, 1954; Reference YarnalYarnal, 1992), and are important for aiding avalanche weather analyses because they represent how conditions differ from the mean, or average, conditions. We chose to analyze the 500 hPa level because it is above most mountain ranges and represents longwave patterns of the westerlies. The mean winter condition over the United States consists of a Pacific North American (PNA) pattern, with a trough over the northeastern Pacific, a ridge over the western United States and a trough over the east. The PNA pattern is due to the alignment of mountain barriers, especially the Rockies (Reference Wallace and GutzlerWallace and Gutzler, 1981; Reference HarmanHarman, 1991). Deviations from the PNA pattern occur, affecting the pattern of storm tracks over the western United States (Reference CayanCayan, 1996), and thus the avalanche activity.
We selected the days for compositing using the PCA, which allowed us to determine that new snow and SWE generally dominated during our extreme avalanche events. Therefore, we used for our composites the avalanche extreme days having high scores on the component representing new snow and SWE Anomalies were determined by subtracting daily 500 hPa values for avalanche extremes from the mean daily averages for December-March for the period 1957–98. Maps of the spatial patterns of composite anomalies highlight major circulation features, with clockwise (anticyclonic) flow around ridges and counterclockwise (cyclonic) flow around troughs.
Results and Discussion
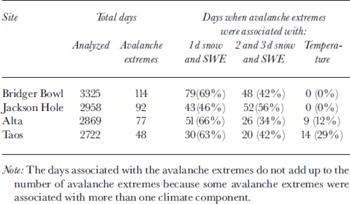
The PCA resulted in four components for Alta and Jackson Hole, and five components for Bridger Bowl and Taos (Table 1). The total variance of the original climate-data matrix explained by the PCA was 93–96%. All four sites had a component representing lday snow and SWE that explained 20–26% of the total variance, and another component that loaded heavily on 2 and 3 day snowfall and SWE Each site also had a component that loaded on snow depth, while the other component(s) generally loaded on temperature variables (Table 1). By examining the component scores for each of the avalanche extreme days, we identified the component or components associated with each avalanche extreme. For Bridger Bowl, Alta and Taos, 63–69% of the avalanche extremes were associated with lday snowfall and SWE (Table 2). The component representing 2 and 3 day snowfall and SWE was associated with 34–42% of the avalanche extremes. These results demonstrate that lday snowfall and SWE are primarily important for avalanche extremes at these sites, while prolonged storms are also important in some cases. Jackson Hole differed from the other sites in that 46% of the avalanche extremes were associated with lday snowfall and SWE, while 56% were associated with the 2 and 3 day variables. Therefore, manyjackson Hole avalanche extremes are the result of prolonged storms. Temperature was less important at all the sites and did not contribute to avalanche extremes at either Bridger Bowl or Jackson Hole, though it still was associated with 12% of the avalanche extremes at Alta and 29% of the extremes at Taos. The snow-depth component was not associated with avalanche extremes at any of our sites. Thus, lday high SWE and high snowfall correspond most closely to days of high avalanche hazard at all sites, but prolonged storms are also important.
The total variance of the original climate-data matrix explained by the PCA, and the amount of variance explained by each component

Number of days analyzed, numbers of days of avalanche extremes, and the climatic variables associated with the avalanche extremes as identified by the PC A (see text)
Composite-anomaly maps of daily 500 hPa heights using the avalanche-extreme days associated with lday snowfall and SWE illustrate the spatial patterns of atmospheric circulation that normally prevail during avalanche extremes (Fig. 2). The maps represent the avalanche extremes most closely related to new snow and new SWE, the dominant climatological variables explaining the days of avalanching. For jackson Hole, avalanche extremes result along the eastern side of a zone of strong negative anomalies where westerly flow is prevalent, while Taos is similarly located along the eastern zone of the negative anomalies but with a predominantly southwesterly flow. These 500 hPa anomaly patterns simply suggest that increased snowfall is closely related to the maximum zone of upper-level divergence. However, atmospheric patterns for Bridger Bowl and Alta differ from those for jackson Hole and Taos, with these sites situated along the backside of a trough with mostly northwesterly flow prevailing during avalanche extremes.
Maps of 500 h Pa composite anomalies for avalanche-extreme days for Alta, Bridger Bowl, Jackson Hole and Taos. Locations are designated with dots. Daily data are from the NCEP/NCAR re-analysis project.

The contrasting atmospheric anomalies for different scenarios of avalanche extremes can be largely explained by the topography of the western United States, especially the low-elevation pathways for moisture that exist to the west of each of the sites. At Bridger Bowl, a northwesterly flow dominates the atmospheric conditions during most avalanche extremes (Fig. 2), a result that mirrors Reference Birkeland and MockBirkeland and Mock’s (1996) snow-climatology study for the area. Northwesterly flow is important for snowfall and avalanche activity at Bridger Bowl because significant mountain barriers with elevations of > 3000 m exist both to the southwest and west of this area, preventing a strong injection of moisture from those directions (Fig. 3). Furthermore, moisture coming from the southwest tends to be channeled away from Bridger Bowl by the Snake River Plain and toward Yellowstone National Park (Reference DespainDespain, 1987; Reference MockMock, 1996b). Conversely, during periods of strong northwesterly flow, moisture traveling through low-elevation gaps in British Columbia and the Columbia River Gorge may be accelerated as it passes to the north around the high mountains of central Idaho southeastward toward Bridger Bowl.
Hillshade map of the western United States, showing the approximate location of our study sites and several major topographic features discussed in the text: (1) Columbia River Gorge, (2) Yellowstone National Park, (3) Snake River Plain, (4) Great Salt Lake, (5) Sierra Nevada Range, (6) Colorado Plateau and (7) San Juan Mountains. Data used to create the map are from the U.S. Geological Survey GTOPO30 30 arcsecond global digital elevation model.

At jackson Hole, avalanche extremes are typically accompanied by a strong westerly flow (Fig. 2). Jackson is near the headwaters of the Snake River, and the Snake River Plain across southern Idaho forms a prominent low-elevation pathway in the western United States (Fig. 3). During westerly flow, the Snake River Plain helps to channel and direct storms and snowfall directly into Jackson Hole. Moisture coming from the southwest has to cross the numerous mountains of the basin and range area of Nevada, while the more formidable mountain barriers of central Idaho exist to the northwest ofjackson Hole.
The Snake River Plain also plays a role in the snowfall and SWE associated with avalanche extremes at Aha, which, as at Bridger Bowl, are dominated by a northwesterly flow at the 500 hPa level (Figs 2 and 3). The Snake River Plain allows moisture to penetrate far inland before hitting the Wasatch Mountains where Aha is located, and previous snowfall research has also emphasized the importance of a northwesterly flow for large Aha snowstorms (Reference DunnDunn, 1983). Moisture at Aha is further enhanced during a northwesterly flow by a lake effect as the air travels over the Great Salt Lake immediately before ascending to Aha (Reference Steenburg, Halvorson and OntonSteenburg and others, 2000). Aha can still receive snowfall when the flow is westerly or southwesterly, but the mountains and the lake ensure that an unstable northwesterly flow is the preferred direction for Aha snowfall.
Unlike the other three locations, snowfall and SWE associated with avalanche extremes at Taos are dominated by a mostly southwesterly flow at the 500 hPa level. Reference MockMock (1995) suggested that such a synoptic pattern is important for avalanche activity at this site. Though significant mountains exist in all directions west of Taos, the mountains to the southwest offer the least impressive barrier to moisture (Fig. 3). The high Colorado Plateau, with elevations of > 3000 m, is immediately to the west of Taos, while some of the higher elevations of the Sierra Nevada Range (>4400 m) are located farther west. Immediately to the northwest the San Juan Mountains of Colorado are > 4300 m high and form a sizable barrier to moisture coming from that direction (Reference Armstrong and WilliamsArmstrong and Williams, 1981).
Conclusions
This research utilized extensive climate and avalanche datasets from four sites in the western United States to examine the relationships between avalanche extremes and atmospheric circulation patterns. Though all four sites are located in a similar, intermountain avalanche climate, distinctive atmospheric conditions are associated with avalanche extremes at each site. These differing patterns can be largely explained by the topography of the region, and the locations of the sites in relation to various mountain barriers and low-elevation pathways for moisture.
Several avenues exist for future research. First, an analysis of all the WAN sites might yield additional information about how different areas are affected by atmospheric conditions, as well as how avalanche extremes vary in different avalanche climates. Second, this work quantitatively examines daily data, while several other studies focus on monthly or seasonal data (e.g. Reference Fitzharris and BakkehoiFitzharris and Bakkehoi, 1986; Reference FitzharrisFitzharris, 1987; Reference MockMock, 1995, Reference Mock1996a). A combination of these two approaches might allow the characterization of seasonal and monthly trends associated with specific daily atmospheric conditions that produce excessive avalanche activity Third, since the existing snow structure is critically important when examining avalanches, a study integrating snow-profile or stability-test data observed during avalanche extremes, and the atmospheric patterns during those extremes, would also be useful.
The methods developed for this research can be applied to other sites with long-term climate and avalanche databases to better understand the spatial distribution of atmospheric patterns associated with extreme avalanche events. Even if accurate avalanche data are unavailable, it is still possible to use a similar approach to examine atmospheric patterns associated with the large snowfall events often responsible for avalanches. Understanding these patterns helps avalanche forecasters to anticipate, and prepare for, extreme avalanche events.
Acknowledgements
We thank A. Judson, K. Williams, D. Judd and D. Howlett for archiving, and providing access to, the WAN data. W. Urie and G. Birkeland provided cartographic assistance. H. Gubler and Y. Durand provided helpful reviews of the paper. The Geography and Regional Science Program of the U.S. National Science Foundation (NSF) provided funding for this research (NSF Grant SBR-9807388).



