INTRODUCTION
Alzheimer’s disease (AD) is a major public health problem; by 2050, it is estimated that 14 million people may be affected by this illness (Alzheimer’s Association, 2019). There is considerable interest in the diagnosis and characterization of mild cognitive impairment (MCI), a syndrome believed to be a prodrome often leading to dementia. A variety of MCI subtypes have been identified, including patients presenting with single-domain syndromes such as amnestic (aMCI) and dysexecutive (dys MCI) and a combined or mixed (mixed MCI) phenotype (Emrani et al., Reference Emrani, Wasserman, Matusz, Miller, Lamar, Price, Ginsberg, Au, Swenson and Libon2019; Eppig et al., Reference Eppig, Wambach, Nieves, Price, Lamar, Delano-Wood, Giovannetti, Bettcher, Penney, Swenson, Lippa, Kabasakalian, Bondi and Libon2012; Libon et al., Reference Libon, Bondi, Price, Lamar, Eppig, Wambach, Nieves, Delano-Wood, Giovannetti, Lippa, Kabasakalian, Cosentino, Swenson and Penney2011). Past research suggests varying rates of conversion to dementia and reversion to normal cognitive functioning depending on MCI subtype (Aerts et al., Reference Aerts, Heffernan, Kochan, Crawford, Draper, Trollor, Sachdev and Brodaty2017; Díaz-Mardomingo, García-Herranz, Rodríguez-Fernández, Venero, & Peraita, Reference Díaz-Mardomingo, García-Herranz, Rodríguez-Fernández, Venero and Peraita2017; Pandya, Lacritz, Weiner, Deschner, & Woon, Reference Pandya, Lacritz, Weiner, Deschner and Woon2017; Shimada, Doi, Lee, & Makizako, Reference Shimada, Doi, Lee and Makizako2019). There is some suggestion that MCI subtypes are associated with different underlying biological mechanisms. Thus, as disease-modifying agents become available, the differentiation between MCI subtypes will become increasingly important for disease management, better understanding of the course of the illness, and predicting possible treatment outcomes. The development of machine learning-assisted tools for detecting emerging neurodegenerative illness with appropriate specificity may be able to address these needs.
The Clock Drawing Test (CDT) is a popular and widely used neuropsychological test (Rabin, Barr, & Burton, Reference Rabin, Barr and Burton2005). Over the past several decades, there has been considerable research regarding differing patterns of performance on the CDT among patients with various dementia and MCI syndromes (Ahmed et al., Reference Ahmed, Brennan, Eppig, Price, Lamar, Delano-Wood, Bangen, Edmonds, Clark, Nation, Jak, Au, Swenson, Bondi and Libon2016; Cahn-Weiner et al., Reference Cahn-Weiner, Williams, Grace, Tremont, Westervelt and Stern2003; Cosentino, Jefferson, Chute, Kaplan, & Libon, Reference Cosentino, Jefferson, Chute, Kaplan and Libon2004; Freedman et al., Reference Freedman, Leach, Kaplan, Winocur, Shulman and Delis1994; Libon, Malamut, Swenson, Sands, & Cloud, Reference Libon, Malamut, Swenson, Sands and Cloud1996; Price et al., Reference Price, Cunningham, Coronado, Freedland, Cosentino, Penney, Penisi, Bowers, Okun and Libon2011; Rouleau, Salmon, Butters, Kennedy, & McGuire, Reference Rouleau, Salmon, Butters, Kennedy and McGuire1992; Royall, Cordes, & Polk, Reference Royall, Cordes and Polk1998; Royall, Palmer, & Markides, Reference Royall, Palmer and Markides2017; Schillerstrom et al., Reference Schillerstrom, Sawyer Baker, Allman, Rungruang, Zamrini and Royall2007; Shulman, Reference Shulman1993; Tuokko, Hadjistavropoulos, Miller, & Beattie, Reference Tuokko, Hadjistavropoulos, Miller and Beattie1992). In the aggregate, prior research has demonstrated that clock drawing to command versus copying a model of a clock produces complementary, but different patterns of performance associated with different underlying neurocognitive constructs (Ahmed et al., Reference Ahmed, Brennan, Eppig, Price, Lamar, Delano-Wood, Bangen, Edmonds, Clark, Nation, Jak, Au, Swenson, Bondi and Libon2016; Cosentino et al., Reference Cosentino, Jefferson, Chute, Kaplan and Libon2004; Libon et al., Reference Libon, Malamut, Swenson, Sands and Cloud1996; Price et al., Reference Price, Cunningham, Coronado, Freedland, Cosentino, Penney, Penisi, Bowers, Okun and Libon2011).
The CDT is also used as part of other tests such as the Montreal Cognitive Assessment (Nasreddine et al., Reference Nasreddine, Phillips, Bedirian, Charbonneau, Whitehead, Collin, Cummings and Chertkow2005) and the Mini-Cog (Holsinger et al., Reference Holsinger, Plassman, Stechuchak, Burke, Coffman and Williams2015), tests that are now commonly used to screen for neuropsychological impairment in primary health settings. Brief screening measures for cognitive change have previously been noted for their limited intra-individual reliability (Feeney et al., Reference Feeney, Savva, O’Regan, King-Kallimanis, Cronin and Kenny2016). Additionally, cognitive screening measures have been shown to be influenced by baseline intelligence measured on word-reading tasks, indicating that an individual’s performance on traditional screening measures should be considered with respect to their premorbid abilities (Dykiert et al., Reference Dykiert, Der, Starr and Deary2016). To the extent that the CDT is used to screen for cognitive impairments, additional potential limitations include the subjectivity of various scoring systems, and the ability to score or capture only a small or limited number of features that might reveal the presence of early or emergent cognitive impairment.
A digital version of the CDT has recently been developed at the Lahey Clinic and Massachusetts Institute of Technology (Davis et al., Reference Davis, Penney, Pittman, Libon, Swenson and Kaplan2010; Penney, Davis, et al., Reference Penney, Davis, Libon, Lamar, Price, Swenson, Garrett, Freedland, Weninger, Scala, Giovannetti and Kaplan2010; Penney, Libon, et al., Reference Penney, Libon, Lamar, Swenson, Price, Weninger, Freedland, Garrett, Scala and Davis2010) that combines traditional paper and pen administration procedures using a digital pen and software that captures the patient’s drawing in real time, allowing the observation of previously difficult-to-capture behavior. This technology has been used with both patients and healthy research participants. Libon et al. (Reference Libon, Penney, Davis, Tabby, Eppig, Nieves, Bloch, Donohue, Brennan, Rife, Wicas, Lamar, Price, Au, Swenson and Garrett2014) administered the digital Clock Drawing Test (dCDT) to patients with multiple sclerosis (MS) to investigate the bradyphrenia often seen in this patient group. In both the command and copy conditions, MS patients produced slower latencies during the latter portion of their drawings, suggesting problems with sustaining attention and concentration. Cohen et al. (Reference Cohen, Penney, Davis, Libon, Swenson, Ajilore, Kumar and Lamar2014) obtained dCDT protocols from patients diagnosed with major depression and found that younger patients spent a smaller proportion of time actually drawing, relative to non-drawing time, compared to the older depressed group. These data were thought to reflect the presence of excessive rumination in patients with depression. Lamar et al. (Reference Lamar, Ajilore, Leow, Charlton, Cohen, GadElkarim, Yang, Zhang, Davis, Penney, Libon and Kumar2016) examined non-demented, non-depressed adults who were grouped on the basis of whether the four cardinal anchor digits (i.e., the numbers 12, 6, 3, 9) were initially drawn before other digits. Local-level connectome analyses found that anchorers demonstrated superior efficiency in the left medial orbitofrontal and transverse temporal cortices as well as the right rostral anterior cingulate and superior frontal gyrus versus non-anchorers. Hierarchical modularity analyses suggested a higher degree of modular integration involving heteromodal regions of the ventral visual processing stream for anchorers versus non-anchorers.
Using machine learning algorithms, Davis et al. (Reference Davis, Libon, Au, Pitman and Penney2014) demonstrated that the dCDT was able to differentiate patients with AD and other dementia syndromes from normal controls (NCs). Finally, Souillard-Mandar et al. (Reference Souillard-Mandar, Davis, Rudin, Au, Libon, Swenson, Price, Lamar and Penney2016) extracted digital clock drawing data from healthy controls, patients with MCI, patients with several dementia syndromes, and other groups and demonstrated impressive classification rates using several machine learning techniques. In sum, past research using the dCDT has demonstrated that this technology is able to measure very subtle and discrete behavior involving latency, decision-making, and graphomotor output – behavior previously unobtainable – to aid in the differential classification between dementia subtypes.
A question that has not yet been explored is how well the dCDT can differentiate between patients classified with various MCI subtypes and dementia such as AD when features extracted from the test are used to train an automated machine learning-based classifier. The current research aims to address this issue. In the current research, the dCDT was administered to memory clinic patients meeting criteria for non-MCI, amnestic MCI, and a combined mixed/dys MCI using Jak, Bondi criteria (2009), and patients diagnosed clinically with AD. Our goal was to assess how well machine learning data analytic algorithms – trained with optimally selected features mathematically deemed to be most informative – are able to classify patients into their respective groups. The ability of machine learning algorithms to differentiate between patient groups could potentially increase the usefulness of the CDT to screen for neuropsychological impairment in primary care or other healthcare settings.
METHODS
Participants
The study cohort consisted of 163 patients (92 female; 162 Caucasian). All patients were evaluated at The Memory Assessment Program, Rowan University, New Jersey Institute for Successful Aging; and at the Department of Neurology, Drexel University, Pennsylvania. Rowan University and Drexel University institutional review boards approved this investigation and the current research complied with the Declaration of Helsinki. All data were collected between 2005 and 2018. The work-up for MCI and dementia was identical between research sites and included comprehensive neuropsychological assessment, evaluations provided by a board-certified geriatric psychiatrist or neurologist, a brain MRI/CT scan, and serum blood tests. An interdisciplinary team consisting of a neuropsychologist, psychiatrist/or neurologist, and social worker determined clinical diagnosis. Exclusion criteria included any lifetime history of head injury, substance abuse, major/medical psychiatric disorders (e.g., major depression and epilepsy), B12, folate, or thyroid deficiency. The presence of these issues was determined on the basis of information provided by both patients and their families and was deemed positive if any of these issues interfered with work or other aspects of daily life. Any changes in functional independence in connection with a blow or strike to the head were considered indicative of history of head injury. All neuropsychological evaluations were obtained by one of us (DJL, a PhD level, broad-certified neuropsychologist). A knowledgeable family member provided information regarding functional status. Demographic and clinical characteristics including age, education, and Mini-Mental State Exam Performance (MMSE; Folstein, Folstein, & McHugh, Reference Folstein, Folstein and McHugh1975) are displayed in Table 1.
Demographic information (means and standard deviations)

Note: With the exception of one, all study participants were Caucasian.
Neuropsychological Assessment
The neuropsychological protocol used to clinically diagnose non-MCI and MCI patients is identical as described by Emrani et al., (Reference Emrani, Libon, Lamar, Price, Jefferson, Gifford, Hohman, Nation, Delano-Wood, Jak, Bangen, Bondi, Brickman, Manly, Swenson and Au2018). Three domains of neuropsychological functioning were assessed including executive control, naming/lexical access, and verbal episodic memory. Nine neuropsychological parameters, three from each neurocognitive domain, were employed to classify patients as presenting with non-MCI or MCI subtypes as described below. Tests were expressed as z-scores derived from normative data as listed below.
Executive control
The Boston Revision of the Wechsler Memory Scale-Mental Control subtest-Accuracy Index (see Lamar, Price, Cynthia, Kaplan, & Libon, Reference Lamar, Price, Cynthia, Kaplan and Libon2002 for full details); letter verbal fluency (‘FAS’; Spreen & Strauss, Reference Spreen and Strauss1990); and Trail Making Test-Part B (Reitan & Wolfson, Reference Reitan and Wolfson1985).
Lexical access/language
The 60-item Boston Naming Test (Kaplan, Goodglass, & Weintraub, Reference Kaplan, Goodglass and Weintraub1983); semantic (‘animals’) fluency (Carew, Lamar, Cloud, Grossman, & Libon, Reference Carew, Lamar, Cloud, Grossman and Libon1997); and Wechsler Adult Intelligence Scale-III Similarities subtest (Wechsler, Reference Wechsler1997).
Memory and learning
Episodic memory was assessed with three parameters obtained from the 9-word California Verbal Learning Test short form (Delis, Kramer, Kaplan, & Ober, Reference Delis, Kramer, Kaplan and Ober2000) including total immediate free recall, delayed free recall, and the delayed recognition discriminability index.
Diagnostic Determination
Alzheimer’s disease
All AD patients were assessed at Rowan University Memory Assessment Program and diagnosed using the criteria suggested by McKhann et al. (Reference McKhann, Drachman, Folstein, Katzman, Price and Stadlan1984).
Single- and multi-domain MCI
Jak, Bondi et al. (Reference Jak, Bondi, Delano-Wood, Wierenga, Corey-Bloom, Salmon and Delis2009) comprehensive neuropsychological criteria were used to determine MCI subtype. Single-domain MCI syndromes were diagnosed when scores fell below 1.0 standard deviation (SD) below expectations based on available norms on any two of the three measures within a single cognitive domain. Mixed MCI syndromes were diagnosed when scores fell below 1.0 SD below available norms on any two of the three measures across two or more cognitive domains. Twenty-six patients met criteria for single-domain aMCI, fifteen patients for dys MCI, and twenty-eight for mixed or multi-domain mild cognitive impairment (mixed MCI). Because of the small number of dys MCI patients, a combined mixed/dys MCI subgroup (n = 43) was constructed. Supporting this decision, previous research employing these criteria has shown that statistically defined mixed and single-domain dys MCI patients produce similar patterns of performance on executive tests (Eppig et al., Reference Eppig, Wambach, Nieves, Price, Lamar, Delano-Wood, Giovannetti, Bettcher, Penney, Swenson, Lippa, Kabasakalian, Bondi and Libon2012).
Non-MCI group
Thirty-five patients did not meet Jak, Bondi et al. (Reference Jak, Bondi, Delano-Wood, Wierenga, Corey-Bloom, Salmon and Delis2009) criteria for MCI. Some of these individuals (n = 11) obtained scores where all nine neuropsychological parameters were above 1 SD below mean cutoff criteria. The second group of patients (n = 24) not meeting criteria for MCI presented with some, but very little, cognitive impairment, such that 14 patients produced tests scores in which only one of the nine neuropsychological parameters was below 1 SD and 10 patients produced neuropsychological test scores in which only two parameters across different domains of cognitive functioning were below 1 SD. These patients were combined into a single group and labeled as non-MCI.
The Digital Clock Drawing Test
The instructions used to administer the dCDT are consistent with traditional CDT administration and included both a command and copy test conditions. In the command condition, patients were asked, “draw the face of a clock, put in all numbers, and set the hands for 10 after 11.” Upon completion of the command test condition, the copy test condition was administered whereby patients were asked to copy a model of a clock with hands set for 10 after 11. The dCDT (Davis et al., Reference Davis, Penney, Pittman, Libon, Swenson and Kaplan2010; Penney, Davis, et al., Reference Penney, Davis, Libon, Lamar, Price, Swenson, Garrett, Freedland, Weninger, Scala, Giovannetti and Kaplan2010) was developed by the Lahey Clinic and Massachusetts Institute of Technology in collaboration with the ClockSketch Consortium and uses digital pen technology developed by Anoto, Inc., Westborough, MA, USA. The pen works as an ordinary ball point pen while capturing pen position 80 times/sec. + .002. All data are time-stamped, allowing the pen to capture the final drawing for more accurate classification than would be possible without this technology. The Clocksketch program can label and calculate latencies for the length and number of strokes associated with individual clock components such as digits and hands; the dimensions and orientation of the clock face, digits, and hands; the time elapsed during and between the drawing of individual clock features; and the deviation of clock features from “ideal” placement on the command clock stimulus.
Data Preprocessing
Prior to formal analysis, all dCDT data underwent preprocessing to remove duplicate features, noisy features, and extremely sparse features, that is, those that are only available for a very small subset of the patients (such as clock drawing center dot and related features). All feature values were standardized by subtracting the mean and dividing with the SD of that feature obtained from the total sample. Standardization allows the down-stream processing to be independent of scaling and amplitude.
Information theoretic approaches for feature selection evaluate mutual information (MI) among classifier variables to identify and reduce the number of features with shared predictive contributions. These approaches were based on discrete outcome probabilities, that is, to augment the selection of predictive features, continuous values were converted to discrete, categorical values in order to better isolate MI contributed by these features. All continuous valued features were discretized by binning data into 10 bins using the discretization function in Gavin Brown’s FEAST toolbox for Matlab® (Brown, Reference Brown2009). The process of binning divides continuous values into N = 10 categorical values, where all N bins have equal ranges.
For some patients, features of interest were missing such as the absence of a clock hand or digit within the clock face. To resolve issues revolving around missing features, a k-nearest neighbor (kNN) algorithm was used to impute the missing values. For any missing feature, kNN searches the k nearest neighbors of available features with respect to Euclidean distance and averages them to fill in for the missing data (Beretta & Santaniello, Reference Beretta and Santaniello2016). To find kNNs, Euclidean distance was calculated for all relevant features. For example, if a patient did not draw the number “3,” a search was performed on all patients of the same diagnosis who did draw the “3.” Then, the k patients who were most similar with respect to the Euclidean distance to the patient in question were identified. The features associated with the number “3” were averaged from these k patients and were then incorporated as the missing values. To account for patients who did not draw an entire digit and/or clock hand(s), binary variables were created and coded such that a one indicated the value was originally missing and a zero indicated it was available. These additional features preserved the information that the value was imputed for the corresponding patient.
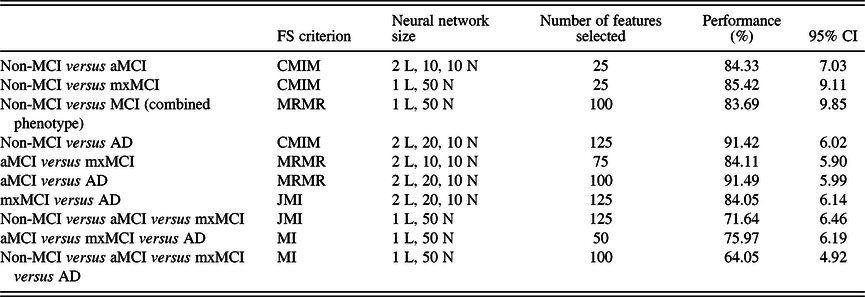
The last preprocessing step involved data partitioning with respect to diagnostic labels. As stated above, the overall goal of this project was to classify non-MCI, MCI subtypes, and AD patients into their respective groups. A singe four-group classification and two combinations of three-group classifications were calculated. However, because of modest sample size among our four patient groups, we were particularly interested in how well machine learning feature selection was able to classify patients into any combination of two groups. Hence, six 2-class problems were evaluated (i.e., all pairwise combinations of two diagnostic groups): non-MCI versus aMCI; non-MCI versus mixed/dys MCI; non-MCI versus AD; aMCI versus mixed/dys MCI; aMCI versus AD; and mixed/dys MCI versus AD. In performing these experiments, information theoretic feature selection algorithms were applied to the problem and then fit to an appropriate feedforward neural network classifier (see Table 2). In an additional, follow-up analysis, aMCI and mixed/dys MCI groups were combined to enable an analysis of classification accuracy for non-MCI versus MCI.
Information theoretic final results

FS criterion = feature selection criterion; mxMCI = mixed/dysexecutive mild cognitive impairment.
Information Theory-Based Feature Selection
The classification of patients through machine learning-based analysis of the dCDT was based on two processes: information theory-based feature selection to identify the most relevant constellation of clock features for distinguishing between groups and successive training of a neural network classifier to identify group membership based on training data for which the group was known.
As noted above, 350 command and copy dCDT features were obtained from the entire sample of 163 patients. Information theoretic-based feature selection approaches were used to determine the most informative features (Brown, Reference Brown2009). Information theoretic methods evaluate different forms of entropy-based MI between diagnoses and features.
Several information theoretic measures are available for computing the amount of information carried by a set of attributes. In this study, we evaluated MI, minimum redundancy maximum relevancy (MRMR), joint mutual information (JMI), and conditional mutual information maximization (CMIM), as described in more detail below (Brown, Reference Brown2009). All of these metrics are based on the central measure of information, defined by entropy, which measures the amount of uncertainty in a random variable, that is, the higher the uncertainty, the higher the information. Given a random variable X (e.g., a specific feature), the entropy of X is given by Equation 1.
 $$H\left( X \right) = - \mathop \sum \nolimits_{x \in X} p\left( x \right)\log p\left( x \right)$$
where  $p\left( x \right)$ is the probability that the random variable X assumes the specific value x. For example, if the specific value of a feature is always the same (i.e., there is no uncertainty), the $p\left( x \right)\;$ is either 0 or 1, depending on the value of x.
Shannon’s mutual information I (X,Y)
This is defined as the dependence between two random variables X and Y as shown in Equation 2.
 $$I(X;Y) = \sum\nolimits_{x\in X} {} \sum\nolimits_{y\in Y} p (x,y)\log \left( {{{p(x,y)} \over {p(x)p(y)}}} \right)$$
where p(x, y) is the joint probability that the random variable X assumes a particular value x, and the random variable Y assumes a particular value y. For a given feature represented by the random variable X and corresponding diagnosis represented with the random variable Y, the MI between X and Y is a measure of the change in entropy (drop in uncertainty) of Y due to the presence of X. Therefore, high MI between a feature and a diagnosis indicates that the feature is a good predictor of its respective diagnosis.
Minimum redundancy maximum relevancy
This was defined below in Equation 3 and includes the consideration of redundancy in addition to maximizing the MI of a feature and a diagnostic label.
 $${J_{mrmr}}\left( {{X_n}} \right) = {\rm{I}}\left( {{X_n};Y} \right) - {{1}\over{{n - 1}}}\mathop \sum \nolimits_{k = 1}^{n - 1} I\left( {{X_n};{X_k}} \right)$$
Specifically, the MI between two features  ${X_n}$ and
 ${X_k}$ (i.e., the redundancy in knowing both ${X_n}$ and ${X_k}$), averaged over all features
 $k = 1, \ldots ,\;n - 1$, is subtracted from the MI between the feature of interest ${X_n}$ and the label Y. The purpose of MRMR is to eliminate redundant features, while still selecting a set of features that enable an accurate prediction of the class label.
Joint mutual information
As shown in Equation 4, this measure includes an additional positive term, the conditional redundancy, compared to MRMR.
 $${J_{jmi}} = I\left( {{X_n};Y} \right) - {{1}\over{{n - 1}}}\mathop \sum \nolimits_{k = 1}^{n - 1} \left[ {I\left( {{X_n};{X_k}} \right) - I\left( {{X_n};{X_k}{\rm{|}}Y} \right)} \right]$$
The conditional redundancy is the redundancy between two features ${X_n}$ and ${X_k}$ given the diagnostic label Y. This term is an indication of first-order interaction between those two features that, when used together, is beneficial in the prediction of the diagnostic group.
Finally, CMIM is similar to JMI; however, CMIM takes a more pessimistic approach than JMI (Equation 5).
 $${J_{cmim}} = I\left( {{X_n};Y} \right) - ma{x_k}\left[ {I\left( {{X_n};{X_k}} \right) - I\left( {{X_n};{X_k}{\rm{|}}Y} \right)} \right]$$
Instead of taking the average of all first-order interactions (i.e., difference between redundancy and conditional redundancy), CMIM only considers the specific pair  $\left( {{X_n}\;;\;{X_k}} \right)$ whose first-order interaction outputs the maximum score. For this reason, CMIM selects the feature ${X_k}$ based on the interaction with an already selected feature ${X_n}$ that gives the lowest score J. Therefore, if ${X_k}$ has high redundancy and low conditional redundancy with only one other feature, then ${X_k}$ will have a low score regardless of the interactions of ${X_k}$ with other features.
Using these metrics as a feature selection approach involves computing the relevant information theoretic metric for each of the features followed by rank ordering the features in descending order according to the scores they receive. Then, a subset of these features with the highest scores is selected as the most informative feature subset.
Balancing the Data
In the current data set, the largest group (i.e., patients with AD) had 59 patients and the smallest group (aMCI) has 26 patients. The adverse impact of imbalanced datasets, creating a bias in the classification decisions of most machine learning algorithms, is well known. To address the imbalanced data concern, we used the well-established Synthetic Minority Oversampling Technique (SMOTE) to rebalance the classes (Chawla, Bowyer, Hall, & Kegelmeyer, Reference Chawla, Bowyer, Hall and Kegelmeyer2002). This approach adds carefully constructed synthetic representative data points to underrepresented classes near the vicinity of existing instances. SMOTE does this by first determining the kNNs of each existing minority instance (k is set to five by default). The algorithm then randomly chooses an instance of a minority class and randomly selects one of its kNNs. Synthetic instances are then created through interpolation along the vector space between the randomly selected instance and its kNN. This process is repeated for additional instances of each minority class until all the minority classes are the same size as the majority class. It is important to note that SMOTE was only used to rebalance training datasets with which the classification models were trained. All diagnostic performances listed in the Results section were computed on a test/ evaluation dataset that strictly consisted of real patient data only.
Classifier Training
Group classification of patients based on dCDT feature selection was accomplished using feed-forward neural networks, due to their previously reported success in classifying medical data for diagnostic purposes (Amato et al., Reference Amato, López, Peña-Méndez, Vaňhara, Hampl and Havel2013) and because of the ability to modify the number of hidden layers and the number of nodes per hidden layer, which allows the network to adjust its learning capacity and approximate decision boundaries (Autio, Juhola, & Laurikkala, Reference Autio, Juhola and Laurikkala2007). To address over-fitting, we implemented a relatively “small” network with fewer adjustable weights. A gradient descent-based stochastic optimization approach was the optimizer used, with early stopping as a further protection against over-fitting (Kingma & Ba, Reference Kingma and Ba2014).
Three different neural network architectures were compared to identify the best predictive configuration for accurately identifying group membership based on dCDT features alone: (1) one hidden layer of 50 nodes, (2) two hidden layers of 10 nodes each, and (3) two hidden layers with 20 and 10 nodes. Each of these structures was trained for features selected with each of the four information theoretic criteria in order to determine the highest performer of each test case (see Supplemental Tables 1–9). We further implemented a 10-fold cross-validation to obtain a better prediction of the true generalization performance of the diagnostic classifier, as well as a confidence interval of the estimated performance. In all cases, the diagnostic performance was computed on test datasets that had been set aside and not used for training, and strictly consisting of real patient data only.
There is, of course, empirical interest in describing the contributions of individual features to accurate classification. Unfortunately, feed-forward machine learning analysis does not yield this kind of information, because it does not analyze data using a General Linear Model (GLM)/regression-based model. While magnitude is considered, there is no directionality assigned to features or the score that ranks features using MI analysis. In addition, any weight that the analysis assigns to a given feature is masked by the hidden layers of the neural network architecture. It would be inaccurate to think of the relationship between a given feature and a classification label as linear, that is, possessing an easily interpreted directional value, because all features are being considered holistically within the model to arrive at a “best fit” classification. While the features themselves and their rank order allow for speculation about what value individual features contribute to the accuracy of classification, much of what machine learning analyses extract from a given feature is hidden within the analysis, thus limiting anything that can be said beyond that a given feature is relevant to distinguishing between two or more groups.
RESULTS
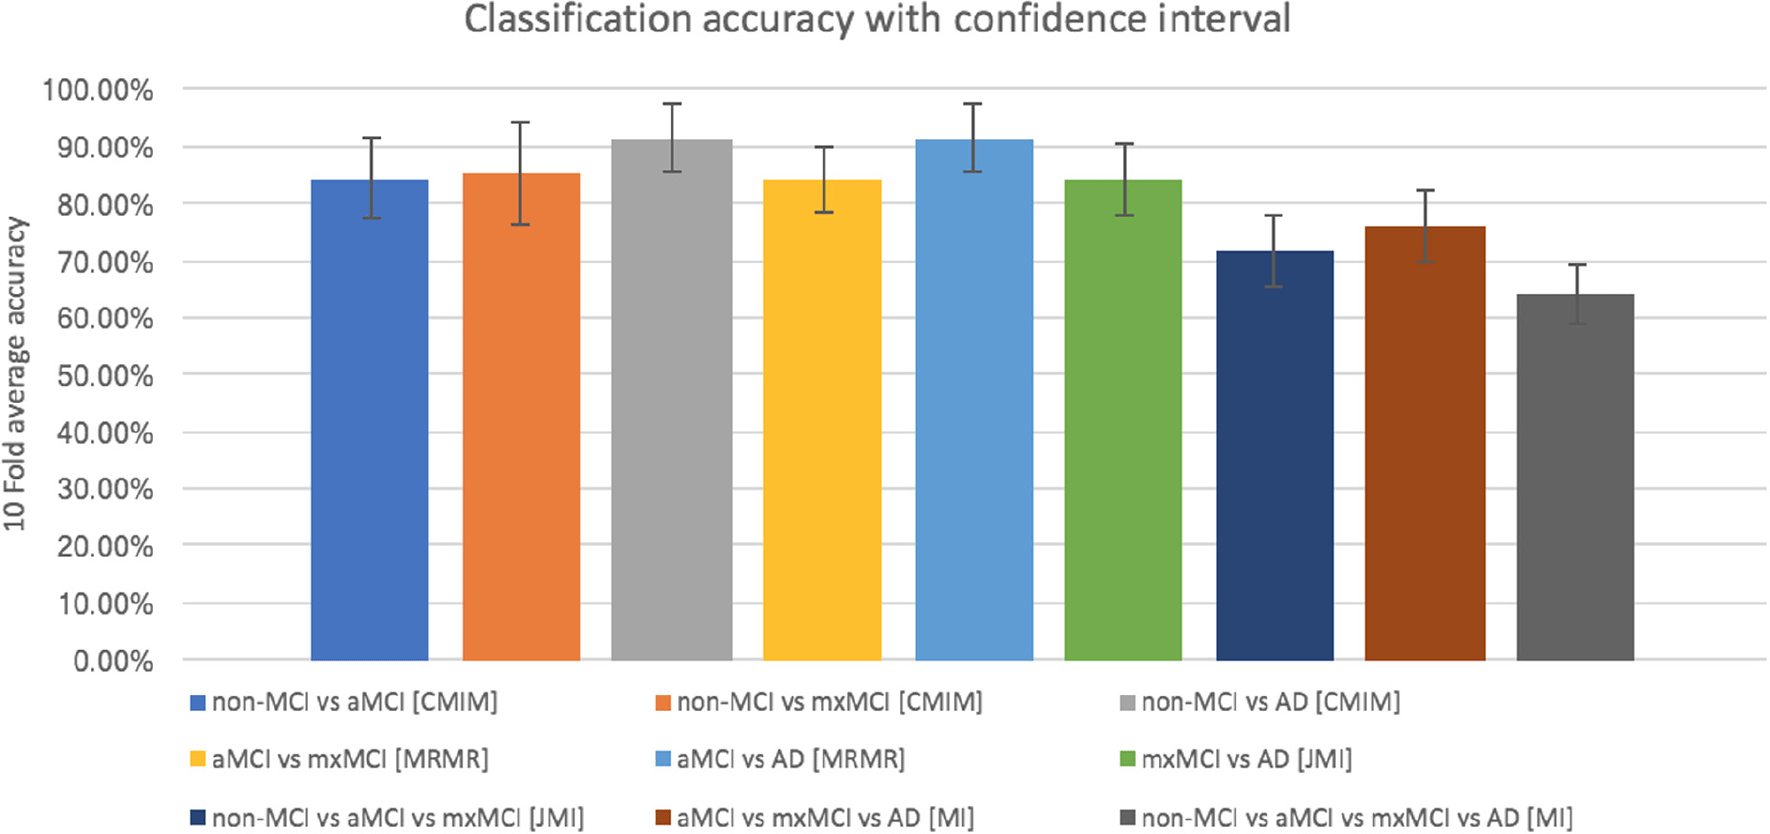
Groups did not differ for education (F[3, 161] = 2.33, p < .076, η 2 = .079). AD patients were older (F[3, 161] = 4.20, p < .001, η 2 = .040) compared only to the mixed MCI group (p < .009). AD patients obtained lower scores on the MMSE (F[3, 161] = 27.39, p < .001, η 2 = .345) than all other groups (Table 1). There were no differences on the MMSE between the non-MCI and MCI groups. The results of all four-group, three-group, and two-group analyses are presented in Table 2 and Figure 1. The least complex model, that is, the model with the fewest adjustable weights or smallest network that obtained the best performance with a narrow confidence interval using as few features as possible, was chosen as the best result in each test case.
Highest performing results for each test case using information theoretic feature selection criteria (see Table 1 for values). Error bars correspond to 95% CI.

Figure 1 shows all 2-, 3-, and 4-diagnostic group analyses where the classifiers were trained with features selected based on information theoretic feature selection. As expected, each two-group analysis performed better as compared to three- and four-group comparisons. All two-group analyses surpassed 80% diagnostic accuracy in correctly classifying patients into their respective groups. Three- and four-group analyses yielded classification rates below 80%. Supplemental Tables 1–9 provide additional information, showing diagnostic performances obtained by each of the three different neural networks when trained with features obtained from each of the four information theoretic approaches discussed above. Supplemental Table 10 lists the first 20 features that entered into several two- and three-group analyses. A follow-up analysis was conducted whereby all MCI patients were placed in a single MCI group and compared to non-MCI patients. Feature section employed MRMR. Consistent with other two-group comparisons, this analysis also surpassed 80% diagnostic accuracy (83.69%; see Table 2).
DISCUSSION
The goal of the current research was to determine how well machine analytic techniques could classify AD patients, non-MCI patients, amnestic MCI, and combined mixed/dys MCI patents into their respective subtypes. Prior research has demonstrated that non-MCI and selected MCI subtypes can be differentiated using tests assessing mental manipulation (Emrani et al., Reference Emrani, Libon, Lamar, Price, Jefferson, Gifford, Hohman, Nation, Delano-Wood, Jak, Bangen, Bondi, Brickman, Manly, Swenson and Au2018), verbal versus visual working memory (Emrani et al., Reference Emrani, Wasserman, Matusz, Miller, Lamar, Price, Ginsberg, Au, Swenson and Libon2019), verbal versus visual episodic memory (Wasserman et al., Reference Wasserman, Emrani, Matusz, Miller, Garrett, Gifford, Hohman, Jefferson, Au, Swenson and Libon2019), and selected visuospatial operations (Wasserman et al., Reference Wasserman, Emrani, Matusz, Peven, Cleary, Price, Ginsberg, Swenson, Heilman, Lamar and Libonsubmitted). These data are compelling on the basis of the neurocognitive constructs that are assessed and differentiated between groups. However, the complexity of the tests used in this research are not necessarily appropriate to be deployed as front-line screening measures.
No single neuropsychological test, including the dCDT, can substitute for detailed neuropsychological assessment in diagnosing dementia, MCI, or any other neurological condition. Moreover, research into how well the CDT can screen for dementia is mixed. Brodaty and Moore (Reference Brodaty and Moore1997) reported that the CDT was superior to the MMSE in screening for dementia, such as AD, in patients evaluated in a memory clinic. Other researchers assessing participants drawn from primary care found mixed results regarding how well the CDT was able to identify patients with dementia or MCI (Ehreke et al., Reference Ehreke, Luppa, Luck, Wiese, Weyerer, Eifflaender-Gorfer, Weeg, Olbrich, van den Bussche, Bachmann, Eisele, Maier, Jessen, Wagner, Fuchs, Pentzek, Angermeyer, König and Riedel-Heller2009; Kirby et al., (Reference Kirby, Denihan, Bruce, Coakley and Lawlor2001). In a large population study comprised of over 6,000 participants drawn from primary care settings, the CDT was better than other neuropsychological screening measures in identifying participants with possible dementia (Reinera et al., Reference Reinera, Eichlera, Hertela, Hoffmann and Thyriana2018). Caballero et al. (Reference Caballero, Ownby, Jacobs, Pandya, Hardigan and Ricabal2018) found that worse diabetes medication adherence was related to greater impairment on the CDT. Hetland et al. (Reference Hetland, Carr, Wallendorf and Barco2014) noted that older persons taking medication believed to impair driving skills produced greater impairment on the CDT.
Despite inconsistencies in past research, the results of the current research suggest that digitally obtained clock drawing behavior analyzed using machine learning algorithms may be able to screen for subtle to mild neuropsychological impairment. Subtle to mild neuropsychological impairment as seen on the dCDT could, indeed, signal the emergence of a neurodegenerative illness such as AD. However, other aetiologies underlying subtle to mild neuropsychological impairment, such as psychiatric problems, might also result in impairment on the dCDT, including depression and anxiety, subtle medication side effects, and medical illness other than putative dementia. These questions should be the subject of future research. Nonetheless, deploying dCDT in the primary care environment and/ or other health care points of entry has potential for better overall healthcare delivery.
In the current research, we were able to demonstrate that feature selection coupled with a judiciously selected network architecture proved to be effective, particularly for two-way classification with performances in the 80%–90% range. For most of our results, the confidence intervals of different methods overlapped, indicating that different classifiers and feature selection approaches performed similarly. This is, perhaps, not surprising due to the similarity of each of the information theoretic metric, all of which are based on MI. It is worth repeating that, in general, the binary two-group analyses significantly outperformed the multi-class 3 and 4 group classification analyses. However, this outcome must be considered in the proper context of the difficulty of the problem, such that a classifier is said to provide meaningful utility by making intelligent decisions if its performance is better than random guessing. In a binary classification problem, that threshold is 50%; hence, classifiers performing in the 80%–90% range are clearly making intelligent decisions. In our four-group problem, however, that threshold is 25%. Thus, classifiers performing in the 60%–70% range are, in fact, providing meaningful information. While the three- and four-group problems performed more modestly, the results described above are nevertheless quite promising. However, we acknowledge that better multi-group classification rates are desirable. Additional research using a larger sample size may address these issues.
Classifying MCI subtypes and differentiating MCI from dementia such AD require a lengthy protocol including comprehensive neuropsychological tests, structural and/or biomarker-related CT/MRI scans of the brain, and an appropriate medical evaluation. As stated above, the current research does not suggest that the dCDT can replace the standard workup for MCI/ dementia nor are we suggesting the performance on a single test is sufficient to make an informed diagnosis. Nonetheless, the accuracies achieved for all binary problems are all at least 83%. As previously discussed, weaknesses in currently employed brief cognitive screening measures, including inconsistent test–retest reliability and sensitivity to premorbid intellect, leave such measures vulnerable to misclassifying patients. While the potential for misclassification can never be completely eliminated, the accuracy of classification achieved through machine learning analysis of a digitized, brief screening measure such as the dCDT may be a valuable indicator of emerging or undetected cognitive change. Thus, the administration of the dCDT is an inexpensive and efficient means to screen for possible alterations in neuropsychological abilities.
One of the strengths of the current study is the well-validated comprehensive neuropsychological diagnostic criteria used to classify non-MCI and MCI patients into their respective groups (Jak, Bondi et al., Reference Jak, Bondi, Delano-Wood, Wierenga, Corey-Bloom, Salmon and Delis2009). However, limitations must be acknowledged, including lack of ethnic diversity in our sample, possible bias in that AD patients were drawn from one site, and our modest sample size relative to the number of features that were analyzed. Also, although groups did not differ for education, premorbid abilities can influence performance on the CDT (Ainslie, et al., Reference Ainslie and Murden1993). Future research exploring relations between premorbid abilities as related to group classification using machine-learning algorithms should be undertaken before a measure such as the dCDT can be used to screen for possible neuropsychological impairment. Additionally, the results of the current research were obtained from memory clinic patients. Different findings may have emerged when training a machine-learning classifier with a community-based sample. Future research should also recruit a community dwelling, NC group and assess how well machine-learning algorithms can classify NC versus any patient with MCI in addition to MCI subgroups.
Finally, the CDT is quite multidimensional regarding the neuropsychological abilities that are needed for successful performance. The methods used in the current research are not able to point to specific neuropsychological constructs that may underlie group classification. Future research combining machine learning classification followed by the analysis of algorithm-selected dCDT features and neuropsychological test performance may be able to provide information regarding the constructs that appear to contribute to group classification.
Additional future work also includes the need to use different feature selection approaches other than information theory, such as wrappers, genetic algorithms, and ensemble-based feature selections. However, it should be noted that each of these approaches are considerably more costly with respect to computational complexity and, in general, rely on specific classification algorithms. The information theoretic approaches, on the other hand, are independent of the classifier, providing a more unbiased estimate of the relevance of the features, not to mention their significantly lower computational cost. Perhaps a more interesting analysis is to compare a variety of feature selection approaches and then determine the overlap in the set of features selected among them. Such an analysis may provide additional insight into which features appear to be selected more often and are, perhaps, more informative than the others. Despite these limitations, machine-learning analysis of features selected from the dCDT is a promising tool to assess for the emergent neuropsychological impairment.
ACKNOWLEDGEMENTS
Dr. Libon owns stock in Digital Cognition Technologies.
Conflict of interest
The authors have nothing to disclose.
Supplementary material
To view supplementary material for this article, please visit https://doi.org/10.1017/S1355617720000144