1. Introduction
The Palaeo-Tethys Ocean was a large ancient ocean located between the supercontinents of Gondwana and Laurasia (Şengor, Reference Şengor1987; Metcalfe, Reference Metcalfe2013). A series of banded terranes (Qiangtang, Lhasa, Himalaya, Cimmerides, Sibumasu, etc.) derived from the north edge of Gondwana drifted northward and were accreted into Laurasia along with the closure of the Palaeo-Tethys Ocean (Yin & Harrison, Reference Yin and Harrison2000; Dilek & Furnes, Reference Dilek and Furnes2011; Metcalfe, Reference Metcalfe2013), forming a huge orogenic belt, known as the ‘Eastern Tethys System’, in the northern and southeast edge of the Tibetan Plateau and the central orogenic belt between North China and the Yangtze (Xu et al. Reference Xu, Dilek, Cao, Yang, Robinson, Ma, Li, Jolivet, Roger and Chen2015 and references therein). The Palaeo-Tethys Ocean in the Eastern Tethys System, which probably opened in the Middle Cambrian and continued to grow throughout the Palaeozoic and closed in the later Triassic, is mainly represented by the Jinshajiang and Longmu Co – Shuanghu suture zone in the northern Tibetan Plateau, and the Changning–Menglian and Ailaoshan suture zone of the Sanjiang Tethys realm in the eastern margin of the Tibetan Plateau (Fig. 1a ; Yin & Harrison, Reference Yin and Harrison2000; Li et al. Reference Li, Zhai, Dong and Huang2006, Reference Li, Dong, Zhai, Wang, Yan, Wu and He2008; Zhai et al. Reference Zhai, Wang, Li and Su2010, Reference Zhai, Jahn, Wang, Su, Mo, Wang, Tang and Lee2013, Reference Zhai, Jahn, Wang, Hu, Chung, Lee, Tang and Tang2016; Metcalfe, Reference Metcalfe2013; Fan et al. Reference Fan, Li, Xu and Wang2014, Reference Fan, Li, Xie, Wang and Chen2015, Reference Fan, Li, Wang, Liu and Xie2017; M Wang et al. Reference Wang, Li, Wu and Xie2014, Reference Wang, Li, Zeng, Li, Fan, Xie and Hao2019; Zhang et al. Reference Zhang, Dong, Wang, Dan, Zhang, Xu and Huang2017; Xie et al. Reference Xie, Li, Ren, Wang and Su2017 a, b).
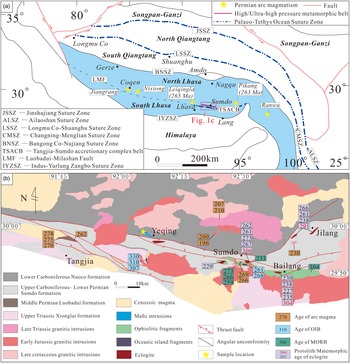
(a) Tectonic framework of the Tibetan Plateau (modified after Li et al. Reference Li, Zhai, Dong and Huang2006 and Zhu et al. Reference Zhu, Mo, Zhao, Niu, Wang, Chu, Pan, Xu and Zhou2010). (b) Geological sketch map of the Tanga–Sumdo area; published age data are after Chen et al. (2009), Yang et al. (Reference Yang, Xu, Li, Xu, Li, Ren and Robinson2009), Cheng et al. (Reference Cheng, Zhang, Vervoort, Lu, Wang and Cao2012, 2014), Weller et al. (Reference Weller, St-Onge, Rayner, Waters, Searle and Palin2016), Cao et al. (Reference Cao, Cheng, Zhang and Wang2017), Duan et al. (Reference Duan, Xie, Fan, Wang and Hao2019, Reference Duan, Xie, Wang, Song and Hao2022), B Wang et al. (Reference Wang, Li, Zeng, Li, Fan, Xie and Hao2019) and Song et al. (Reference Song, Xie, Gao, Yu, Wang, Duan and Hao2022).

The discovery of the late Palaeozoic Sumdo high/ultra-high-pressure (HP/UHP) metamorphic belt in Lhasa terrane reveals that there are records of an oceanic subduction zone, which may represent the southernmost branch of the Palaeo-Tethys Ocean (Fig. 1a; Yang et al. Reference Yang, Xu, Geng, Li, Xu, Li, Ren, Li, Cai, Liang and Chen2006, Reference Yang, Xu, Li, Xu, Li, Ren and Robinson2009; Liu et al. Reference Liu, Liu, Theye and Massonne2009; Xu et al. Reference Xu, Dilek, Cao, Yang, Robinson, Ma, Li, Jolivet, Roger and Chen2015). The fact that Sumdo HP/UHP metamorphic belt is located between Indus – Yarlung Zangbo (Neo-Tethys Ocean) and Bangong Co – Nujiang (Meso-Tethys Ocean) Suture Zone is incongruent with the common view that the Tethys Ocean Suture Zone becomes gradually younger from north to south (Xu et al. Reference Xu, Dilek, Cao, Yang, Robinson, Ma, Li, Jolivet, Roger and Chen2015). In recent years, further evidence for the evolution of the Sumdo Palaeo-Tethys Ocean (SPTO) has been established in Sumdo and adjacent regions, with examples such as ophiolites (Fig. 1b; Chen et al. Reference Chen, Yang, Li and Xu2010; Duan et al. Reference Duan, Xie, Fan, Wang and Hao2019; Wang et al. Reference Wang, Xie, Dong, Fan, Yu and Duan2021), oceanic islands (Fig. 1b; B Wang et al. Reference Wang, Li, Zeng, Li, Fan, Xie and Hao2019; Zhong et al. Reference Zhong, Zhu, Yang, Xie, Mai, Zhang, Li and Zhou2021; Duan et al. Reference Duan, Xie, Wang, Song and Hao2022), eclogite and blueschist (Fig. 1b ; Yang et al. Reference Yang, Xu, Geng, Li, Xu, Li, Ren, Li, Cai, Liang and Chen2006, Reference Yang, Xu, Li, Xu, Li, Ren and Robinson2009; Liu et al. Reference Liu, Liu, Theye and Massonne2009), arc magmatism (Fig. 1b ; Geng et al. Reference Geng, Sun, Pan, Zhu and Wang2009; Zhu et al. Reference Zhu, Mo, Zhao, Niu, Wang, Chu, Pan, Xu and Zhou2010; B Wang et al. Reference Wang, Xie, Dong, Fan and Yu2020, Reference Wang, Xie, Spier, Dong, Yu, Song, Duan and Yakymchuk2022; C Wang, Reference Wang, Xie, Spier, Dong, Yu, Song, Duan and Yakymchuk2022) and flysch-like sedimentary strata (Fig. 1b ; Xie et al. Reference Xie, Song, Wang, Fan and Hao2019, Reference Xie, Duan, Song and Wang2021). Thus, this belt is also called the Tangjia–Sumdo accretionary complex belt (TSACB) (Fig. 1a; B Wang et al. Reference Wang, Xie, Dong, Fan and Yu2020, Reference Wang, Xie, Spier, Dong, Yu, Song, Duan and Yakymchuk2022; Xie et al. Reference Xie, Duan, Song and Wang2021). Previous research suggests that the SPTO may have opened before the early Carboniferous and subducted initially before the early Permian, then soon after the late Triassic at latest (Cheng et al. Reference Cheng, Liu, Vervoort and Lu2015; Duan et al. Reference Duan, Xie, Fan, Wang and Hao2019, Reference Duan, Xie, Wang, Song and Hao2022; B Wang et al. Reference Wang, Xie, Dong, Fan and Yu2020, Reference Wang, Xie, Dong, Fan, Yu and Duan2021, Reference Wang, Xie, Spier, Dong, Yu, Song, Duan and Yakymchuk2022; Liu et al. Reference Liu, Li, Xie, Santosh, Liu, Dong, Wang, Guo and Cao2022). Based on the study of eclogite and arc magma, we know that the SPTO subducted during the early–middle Permian and middle–late Triassic periods (Cheng et al. Reference Cheng, Zhang, Vervoort, Lu, Wang and Cao2012, Reference Cheng, Liu, Vervoort and Lu2015; Zhang et al. Reference Zhang, Bader, Zhang, Shen, Li and Li2018 a; B Wang et al. Reference Wang, Xie, Dong, Fan and Yu2020, Reference Wang, Xie, Spier, Dong, Yu, Song, Duan and Yakymchuk2022; Song et al. Reference Song, Xie, Gao, Yu, Wang, Duan and Hao2022; C Wang et al. Reference Wang, Xie, Spier, Dong, Yu, Song, Duan and Yakymchuk2022). However, many aspects of the subduction evolution of the SPTO remain unclear, especially during the late Permian to early Triassic owing to gaps in the geological record (Zhu et al. Reference Zhu, Mo, Zhao, Niu, Wang, Chu, Pan, Xu and Zhou2010; Cheng et al. Reference Cheng, Zhang, Vervoort, Lu, Wang and Cao2012, Reference Cheng, Liu, Vervoort and Lu2015; Zhang et al. Reference Zhang, Bader, Van, Yang, Shen, Qiu, Li and Zheng2018 b; B Wang et al. Reference Wang, Xie, Dong, Fan and Yu2020, Reference Wang, Xie, Spier, Dong, Yu, Song, Duan and Yakymchuk2022; Li et al. Reference Li, Yang, Zhu, Xie, Zhong, Mai, Zhou and Zhang2022; C Wang et al. Reference Wang, Xie, Spier, Dong, Yu, Song, Duan and Yakymchuk2022).
The Yeqing gabbro is discovered near the north edge of the TSACB, whose zircon U–Pb ages vary from 254 ± 1 to 249 ± 1 Ma in this study, coincident with the active period of the SPTO. Here, we present zircon U–Pb geochronology, whole-rock geochemistry, as well as zircon Hf and whole-rock Sr–Nd isotopic data, which are significant in resolving the diagenetic age and petrogenesis of the Yeqing gabbro. We also discuss the tectonic setting of the intrusion and draw implications regarding the subduction evolution of the SPTO during the late Permian to early Triassic.
2. Geological background
The Tibetan Plateau is located in the eastern part of the Tethys tectonic domain. The closure of the Tethys oceans created four major suture zones associated with the Tibetan Plateau (Fig. 1a;Yin & Harrison, Reference Yin and Harrison2000; Zhu et al. Reference Zhu, Mo, Zhao, Niu, Wang, Chu, Pan, Xu and Zhou2010; Torsvik & Cocks, Reference Torsvik and Cocks2013; Zhai et al. Reference Zhai, Jahn, Wang, Hu, Chung, Lee, Tang and Tang2016). These suture zones divide the Tibetan Plateau, from north to south, into the Songpan–Ganzi, Northern Qiangtang, Southern Qiangtang, Lhasa and Himalayan terranes (Li et al. Reference Li, Zhai, Dong and Huang2006, Reference Li, Dong, Zhai, Wang, Yan, Wu and He2008; Zhai et al. Reference Zhai, Wang, Li and Su2010, Reference Zhai, Jahn, Wang, Su, Mo, Wang, Tang and Lee2013; Fan et al. Reference Fan, Li, Xu and Wang2014, Reference Fan, Li, Xie, Wang and Chen2015, Reference Fan, Li, Wang, Liu and Xie2017; M Wang et al. Reference Wang, Li, Wu and Xie2014, Reference Wang, Li, Zeng, Li, Fan, Xie and Hao2019; Xie et al. Reference Xie, Li, Ren, Wang and Su2017 a, b; Zhang et al. Reference Zhang, Dong, Wang, Dan, Zhang, Xu and Huang2017; Hu et al. Reference Hu, Zhai, Wang, Tang, Wang and Hou2018, Reference Hu, Zhai, Zhao, Wang, Tang, Zhu and Wu2019). The Lhasa terrane is further divided into North and South Lhasa Terrane by the SPTO, marked by the TSACB (Yang et al. Reference Yang, Xu, Li, Xu, Li, Ren and Robinson2009).
The TSACB, correlated spatially with the Luobadui–Milashan Fault (Fig. 1a; Zhu et al. Reference Zhu, Mo, Zhao, Niu, Wang, Chu, Pan, Xu and Zhou2010), is dominated by scattered fragments of the SPTO remnants (Fig. 1b). In the study area, the Nuoco Formation, formed in a continental margin environment, mainly consists of sandstone or metasedimentary rock on the north of the TSACB (Zhu et al. Reference Zhu, Zhao, Niu, Hou and Mo2013). The strata exposed in the TSACB is mainly Sumdo Formation, which is a set of low-grade-metamorphosed terrigenous clastic sandstones and mudstones formed in an initial fore-arc basin environment (Xie et al. Reference Xie, Song, Wang, Fan and Hao2019, Reference Xie, Duan, Song and Wang2021). The Luobadui Formation exposes a little in the study area and is mainly composed of limestone, terrigenous sediments and arc-type volcanic rocks (Geng et al. Reference Geng, Sun, Pan, Zhu and Wang2009; Zhu et al. Reference Zhu, Mo, Zhao, Niu, Wang, Chu, Pan, Xu and Zhou2010; C Wang et al. Reference Wang, Xie, Spier, Dong, Yu, Song, Duan and Yakymchuk2022).
The SPTO remnants are abundant in the Sumdo Formation as slices, including Permian–Triassic eclogites (Li et al. Reference Li, Yang, Xu, Li, Xu, Ren and Robinson2009; Yang et al. Reference Yang, Xu, Li, Xu, Li, Ren and Robinson2009; Zeng et al. Reference Zeng, Liu, Gao, Chen and Xie2009), late Carboniferous – middle Triassic ophiolites (Chen et al. Reference Chen, Yang, Li and Xu2010; Duan et al. Reference Duan, Xie, Fan, Wang and Hao2019; Wang et al. Reference Wang, Xie, Dong, Fan, Yu and Duan2021) and early Carboniferous – middle Permian oceanic islands (B Wang et al. Reference Wang, Li, Zeng, Li, Fan, Xie and Hao2019; Zhong et al. Reference Zhong, Zhu, Yang, Xie, Mai, Zhang, Li and Zhou2021; Duan et al. Reference Duan, Xie, Wang, Song and Hao2022). Previous studies have suggested that there are at least two types of eclogites, with ages of the metamorphic peak in the middle Permian (274–261 Ma) and middle–late Triassic (238–227 Ma) (Li et al. Reference Li, Yang, Xu, Li, Xu, Ren and Robinson2009; Yang et al. Reference Yang, Xu, Li, Xu, Li, Ren and Robinson2009; Zeng et al. Reference Zeng, Liu, Gao, Chen and Xie2009; Chen et al., Reference Chen, Yang, Li and Xu2010; Cheng et al. Reference Cheng, Zhang, Vervoort, Lu, Wang and Cao2012, Reference Cheng, Liu, Vervoort and Lu2015; Weller et al. Reference Weller, St-Onge, Rayner, Waters, Searle and Palin2016; Cao et al. Reference Cao, Cheng, Zhang and Wang2017; Zhang et al. Reference Zhang, Bader, Zhang, Shen, Li and Li2018 a, b). There is also plenty of Permian arc magmatism found in the south edge of the North Lhasa Terrane (Fig. 1a; Geng et al. Reference Geng, Sun, Pan, Zhu and Wang2009; Zhu et al. Reference Zhu, Mo, Zhao, Niu, Wang, Chu, Pan, Xu and Zhou2010) and a part in the TSACB (Fig. 1b, 278–262 Ma; B Wang et al. Reference Wang, Xie, Dong, Fan and Yu2020, Reference Wang, Xie, Spier, Dong, Yu, Song, Duan and Yakymchuk2022; Mai et al. Reference Mai, Zhu, Yang, Xie, Tong, Hao and Zhong2021; Li et al. Reference Li, Yang, Zhu, Xie, Zhong, Mai, Zhou and Zhang2022; C Wang et al. Reference Wang, Xie, Spier, Dong, Yu, Song, Duan and Yakymchuk2022). In addition, the middle–late Triassic (230–200 Ma) granite with typical arc magmatism characteristics may be related to the northward subduction of the SPTO (Li et al. Reference Li, Zhang, Wu, Xie, Zhu and Han2020; Song et al. Reference Song, Xie, Gao, Yu, Wang, Duan and Hao2022).
3. Field observations and petrology
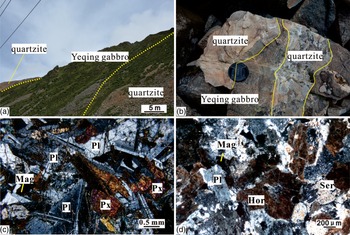
The study area is located between Tangjia and Sumdo (Fig. 1b). The Yeqing gabbro intrusions expose as near east–west-trending dike in the Nuoco Formation (Fig. 1b). The larger intrusion is c. 8 km long and 50 m thick, while the smaller intrusion is c. 3 km long and 20 m thick. The host rocks of the Yeqing gabbro contains quartzite and sandstone of the Nuoco Formation (Fig. 2a). We can observe the obvious chilled margin between gabbro and quartzite (Fig. 2b).
Photographs of Yeqing gabbro. (a) Macro outcrop photo of Yeqing gabbro intruding into Sumdo Formation. (b) Close-up photo of the boundary between Yeqing gabbro and Sumdo Formation. (c, d) Micrograph of Yeqing gabbro, Plagioclase is replaced by sericite, and pyroxene is replaced by hornblende, in part of our samples. Pl – plagioclase; Px – pyroxene; hor – hornblende; Sre – sericite; Mag – magnetite.

The gabbro samples are fine- to medium-grained and consist mainly of pyroxene and plagioclase (Fig. 2b). Petrographic observations under the microscope reveal that the gabbro shows crystalline texture, consisting of dominant mineralogy of pyroxene (35 %), plagioclase (60 %) and magnetite (<5 %), with slight metamorphism (Fig. 2c, d). Some pyroxene has been replaced by chlorite or hornblende, and the plagioclase is weakly altered to sericite, which shows the sericite microcrystalline aggregates under a microscope with orthogonal polarized light (Fig. 2d).
4. Analytical methods
4.a. Whole-rock geochemistry
Whole-rock geochemical analysis was performed at the experimental centre of the Academy of Sciences, China University of Geosciences, Beijing, China. Major-element analysis was performed in the inductively coupled plasma – optical emission spectroscopy (ICP-OES) laboratory using an X-ray fluorescence spectrometer. The precision is better than 1 % for all elements. Trace-element analysis was performed using an Agilent 7500a ICP – mass spectrometry (ICP-MS) instrument. During the analysis, standard samples AGV-2, W2 and BHOV from the United States Geological Survey and rock samples R-1 and R-3 from the China Geological Testing Center were used to monitor the analytical precision, which is better than 5 % for most elements. Further details of the experimental method are presented by Zhai et al. (Reference Zhai, Jahn, Wang, Su, Mo, Wang, Tang and Lee2013).
4.b. Zircon U–Pb geochronology
Zircon grains were separated at the premises of the Yuheng Mineral Technology Service, Langfang, China, by conventional heavy liquid and magnetic techniques. Cathodoluminescence (CL) images were taken at the Institute of Geology, Chinese Academy of Geological Sciences, Beijing, China. U–Pb isotopic and trace-element analyses of zircon were carried out by laser-ablation – ICP-MS (LA-ICP-MS) at the Key Laboratory of Mineral Resources Evaluation in Northeast Asia, Ministry of Natural Resources, Jilin University, Changchun, China. The laser beam spot diameter was 32 µm, and helium was used as the carrier gas. Details of the procedure are reported by Liu et al. (Reference Liu, Gao, Hu, Gao, Zong and Wang2010). Fractionation correction of isotopic ratios was performed using zircon 91500 as the external standard. NIST SRM 610 was used as the external standard for correction of elemental abundances, and 29Si was used as the internal standard. Data were processed using Glitter software (version 4.4; Griffin et al. Reference Griffin, Powell, Pearson and O’Reilly2008). Details of specific experimental data reduction techniques are given by Chang et al. (Reference Chang, Vervoort, McClelland and Knaack2006). The software package Isoplot 4.15 was used to calculate weighted-mean U–Pb ages of the samples and to generate Concordia diagrams (Ludwig, Reference Ludwig2003).
4.c. Zircon Hf isotopes
Zircon Hf isotopic analyses were conducted at the facility of Beijing Createch Testing Technology, Beijing, China. Hf isotopic analyses were performed on the same spots or in the same age domains (as identified by CL images) as used for U–Pb dating. An NWR-213 (nm) laser ablation microprobe coupled to a Neptune Plus multi-collector (MC)-ICP-MS instrument was used for isotopic analysis. The laser beam spot was 40 µm in diameter, with an energy density of 10–11 J cm−2 and a frequency of 10 Hz. The ablated material was carried to the mass spectrometer by high-purity helium gas. Zircon GJ-1 was used as the reference standard during analyses, whose weighted mean 176Hf/177Hf ratio (0.282000 ± 32; 2σ; n = 17) is similar to the commonly accepted weighted mean 176Hf/177Hf ratio of 0.282013 ± 19 (2σ) reported for in situ analysis by Elhlou et al. (Reference Elhlou, Belousova, Griffin, Pearson and O’Reilly2006). Technical procedures and instrument operational parameters are described by Hu et al. (Reference Hu, Liu, Gao, Liu, Zhang, Tong, Lin, Zong, Li, Chen, Zhou and Yang2012). Data reduction methods followed those presented by Bouvier et al. (Reference Bouvier, Vervoort and Patchett2008).
4.d. Whole-rock Sr–Nd isotopic analysis
Whole-rock Sr–Nd isotopic analyses were carried out using a Thermo Fisher Scientific Neptune Plus MC-ICP-MS instrument at the facility of Beijing Createch Testing Technology. 87Sr/86Sr ratios were corrected for instrumental mass fractionation using an exponential fractionation law and assuming 88Sr/86Sr = 8.375209. 143Nd/144Nd ratios were corrected for instrumental mass fractionation using an exponential fractionation law and assuming 146Nd/144Nd = 0.7219. The Sr isotope international standard NBS 987 was repeatedly tested to monitor accuracy, yielding a mean 87Sr/86Sr value of 0.710248 ± 9 (2SD, n = 11). Stability assessment for 143Nd/144Nd was conducted with the in-house standard GSB-Nd, yielding a value of 0.512195 ± 6 (2SD, n = 12). Detailed analytical procedures are given by Hu et al. (Reference Hu, Zhai, Wang, Tang, Wang and Hou2018).
5. Results
5.a. U–Pb zircon geochronology
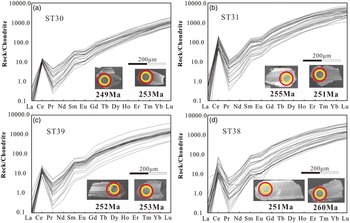
LA-ICP-MS zircon U–Pb data and zircon trace element of the Yeqing gabbro are presented in Supplementary Tables S1 and S2, respectively. Zircon grains separated from gabbro samples (ST30, ST31, ST38 and ST39) are semi-transparent and columnar to granular. The lengths of the zircon crystals are 100–250 μm, with aspect ratios of 1:1–3:1. Some zircon grains exhibit oscillatory zoning in CL imaging (Fig. 3). The range of Th and U contents is relatively wide (Th = 36–1053 ppm, U = 37–450 ppm) and the Th/U ratios are quite high (0.56–2.57), which is consistent with the magmatic origin (Hoskin & Schaltegger, Reference Hoskin and Schaltegger2003). Positive Ce and negative Eu anomalies are observed in chondrite-normalized rare earth element (REE) patterns of zircon grains from these samples (Fig. 3).
Cathodoluminescence (CL) images and chondrite-normalized REE patterns diagram of representative zircon grains from Yeqing gabbro. The yellow circle is the location of U–Pb isotope analysis, and the red is Lu–Hf isotope analysis. Values of chondrite are after Sun and McDonough (Reference Sun, McDonough, Saunders and Norry1989).

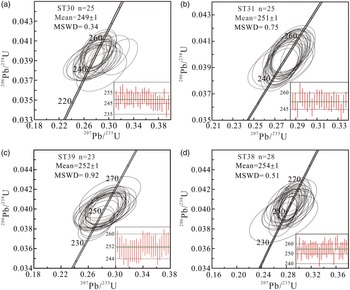
U–Pb data from all four samples are concordant (Fig. 4). The data yield weighted-mean ages of 249 ± 1 Ma for ST30 (n = 25, MSWD = 0.34, 1σ), 251 ± 1 Ma for ST31 (n = 25, MSWD = 0.75, 1σ), 252 ± 1 Ma for ST39 (n = 28, MSWD = 0.51, 1σ) and 254 ± 1 Ma for ST38 (n = 23, MSWD = 0.92, 1σ).
U–Pb zircon Concordia of representative zircon grains from Yeqing gabbro. MSWD = mean squared weighted deviation.

5.b. Whole-rock geochemistry
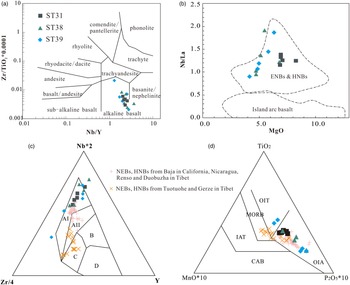
Whole-rock major- and trace-element geochemical data are listed in Supplementary Table S3. These samples contain variational content of SiO2 (41.91–50.12 wt %) and MgO (4.15–8.56 wt %). The contents of Fe2O3 T (Fe2O3 total) and Al2O3 are relatively concentrated, with means of 13.34 wt % and 15.39 wt % respectively. In particular, the contents of TiO2, P2O5 and (Na2O + K2O) are comparatively high, with means of 3.69 wt %, 0.78 wt % and 4.36 wt % respectively. These samples plot mostly in the alkaline basalt field in the SiO2 vs Nb/Y diagram (Fig. 5a).
(a) SiO2 vs Nb/Y (Winchester & Floyd, Reference Winchester and Floyd1977) plot. (b) Nb/La vs MgO (Kepezhinskas et al. Reference Kepezhinskas, Defant and Drummond1996) plot. (c) Nb*2 vs Zr/4 vs Y figure (Meschede, Reference Meschede1986). Within-plate alkali basalts – AI, AII within-plate tholeiites – AII, C; plume-type MORB- B; N-type MORB- D; volcanic arc basalts – C, D. (d) TiO2 vs MnO2*10 vs P2O5*10 figure (Mullen, Reference Mullen1983). MORB – mid-ocean ridge basalt; IAT – island arc tholeiite; CAB – calc-alkaline basalt; OIT – ocean island tholeiite; OIA – ocean island alkaline. Data of the NEBs, HNBs from Baja, Nicaragua, Renso, Dubuzha, Tuotuohe and Gerze are after Storey et al. (Reference Storey, Rogers, Saunders and Terrell1989), Luhr et al. (Reference Luhr, Aranda-Gomez and Housh1995), Benoit et al. (Reference Benoit, Aguilloân-Robles, Calmus, Maury, Bellon, Cotton, Bourgois and Michaud2002), Wang et al. (Reference Wang, Wyman, Xu, Wan, Li, Zi, Jiang, Qiu, Chu, Zhao and Dong2007), Gazel et al. (Reference Gazel, Hoernle, Carr, Herzberg, Saginor, Bogaard, Hauff, Feigenson and Swisher2011), Li et al. (Reference Li, Zhu, Wang, Zhao, Zhang, Liu, Chang, Lu, Dai and Zheng2016) and Hao et al. (Reference Hao, Wang, Zhang, Ou, Yang, Dan and Jiang2018).

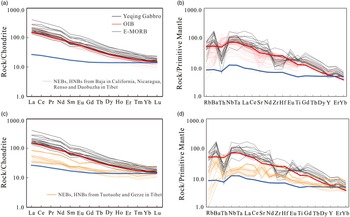
The REE contents of these samples are relatively higher (168.54–559.62 ppm) than mid-ocean ridge basalt (MORB) (39.11 ppm; Sun & McDonough, Reference Sun, McDonough, Saunders and Norry1989), with light REE (LREE) enrichment (LaN/YbN = 11.51–27.10) in chondrite-normalized REE patterns (Fig. 6a). Positive Nb and Ta anomalies and negative Th, Zr and Hf anomalies are observed in primitive-mantle-normalized trace-element spider diagrams, which is similar to the typical OIB and the NEBs and HNBs from Baja (California), Nicaragua, Renso and Duobuzha (Tibet), and different from those from Tuotuohe and Gerze (Tibet) (Fig. 6b, d). The higher Nb contents (45.3–113.5 ppm) of the Yeqing gabbro are similar to those of Nb-enrichment basalts (NEBs; 20 > Nb > 5 ppm) and high-Nb basalts (HNBs; Nb > 20 ppm) which are enriched in LILEs, LREEs and HFSEs and have weakly negative or positive primitive-mantle-normalized Nb and Ta anomalies (Castillo et al. Reference Castillo, Rigby and Solidum2007; Hastie et al. Reference Hastie, Mitchell, Kerr, Minifie and Millar2011); these samples plot in the NEBs and HNBs field in the Nb/La vs MgO plot (Fig. 5b). In addition, the Yeqing gabbro shows characteristics of intraplate alkaline basalts in the tectonic discrimination diagrams (Fig. 5c, d).
Chondrite-normalized REE patterns and primitive-mantle-normalized spider diagrams. Values of chondrite, primitive mantle, OIB and E-MORB are after Sun and McDonough (Reference Sun, McDonough, Saunders and Norry1989).

5.c. Zircon Hf and whole-rock Sr–Nd isotopic analysis
Zircon Hf and whole-rock Sr–Nd isotope data are listed in Supplementary Tables S4 and S5, respectively. The Hf isotope analyses of the zircon grains from the gabbro samples show low 176Lu/177Hf ratios of 0.0003–0.0021 and 176Hf/177Hf ratios of 0.282608–0.282794. Calculated small negative or positive ϵ Hf(t) values range from −0.2 to +6.3. Initial Sr isotope ratios and ϵ Nd(t) values were calculated using ages of c. 254 Ma and c. 251 Ma reported in this study. These samples have a narrow range of initial (87Sr/86Sr) ratios of 0.7047–0.7054, 87Sr/86Sr ratios of 0.7047–0.7054 and 143Nd/144Nd ratios of 0.512526–0.512647. Calculated small positive ϵ Nd(t) values range from 0.3 to 2.7.
6. Discussion
6.a. Petrogenesis
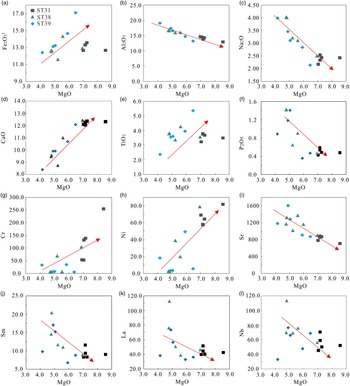
Low loss-on-ignition (LOI) values of 1.14–1.77 wt % and metamorphic minerals under the microscope indicate that the samples have undergone low-level metamorphism or alteration. This process may have modified the contents of mobile elements (e.g. Na, K, Rb, Ba and Sr), whereas the REE and high-field-strength elements (HFSE; e.g. Th, Zr, Hf, Nb, Ta, Ti and Y) should preserve primary magma compositions (Barnes et al. Reference Barnes, Naldrett and Gorton1985; Jochum et al. Reference Jochum, Arndt and Hofmann1991). In fact, most mobile elements and HFSE display good correlations with MgO (Fig. 8, further below), indicating there is almost no significant disturbance by metamorphism or alteration on most elements.
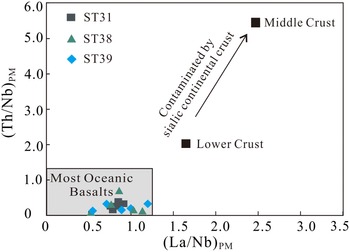
The Yeqing gabbro exhibits clear positive Nb and Ta and negative Th, U, Zr and Hf anomalies, with significant differences compared with continental crust (Rudnick & Gao, Reference Rudnick and Gao2003; Niu, Reference Niu2009). The Th/Ta ratios of these samples are 0.1–1.29, similar to those of volcanic rocks derived from a primitive mantle source (Th/Ta = 2.3), and much lower than that of the upper crust (Th/Ta > 10) (Thompson et al. Reference Thompson, Morrison, Hendry, Parry, Simpson, Hutchison and O’Hara1984; Condie, Reference Condie1993). The (Th/Ta)PM (∼0.24) and (La/Nb)PM (∼0.85) ratios of these samples are both less than 1, indicating that the crustal assimilation is negligible (Peng et al. Reference Peng, Mahoney, Hooper, Harris and Beane1994). Furthermore, these samples plot in the oceanic basalts field without the trend of crustal assimilation in the (Th/Nb)PM vs (La/Nb)PM diagram (Fig. 7).
(La/Nb)PM vs (Th/Nb)PM plot (Neal et al. Reference Neal, Mahoney and Chazey2002). Middle crust and lower crust data are after Rudnick and Gao (Reference Rudnick and Gao2003). The ‘most oceanic basalts’ data are after Neal et al. (Reference Neal, Mahoney and Chazey2002 and references therein).

The Mg# values (=100 × Mg2+/(Mg2+ + Fe2+)) (43.8–61.1) and the Cr (2.9–253.9 ppm) and Ni (2.2–81.9 ppm) contents of the Yeqing gabbro are lower than those of primitive mantle (Mg# = 68–76, Cr = 300–500 ppm, Ni = 300–400 ppm), indicating that they may have undergone fractional crystallization of olivine, pyroxene and chromite (Wilson, Reference Wilson1989; Jung & Masberg, Reference Jung and Masberg1998). In the process of fractional crystallization, Ni preferentially integrates into the olivine phase, and Cr preferentially integrates into the pyroxene phase (Wilson, Reference Wilson1989; Rollinson, Reference Rollinson1993). The strongly positive relationships between FeOT, Ni and MgO suggest that the magma underwent obvious fractional crystallization of olivine (Fig. 8a, h). In addition, the higher content and weak positive relationship with MgO of Cr element illustrate that there is a little or no fractional crystallization of pyroxene (Fig. 8g). The negative relationships between Sr, Na2O, Al2O3 and MgO indicate that these samples underwent almost no fractional crystallization of plagioclase (Fig. 8b, c, i; Fodor & Vetter, Reference Fodor and Vetter1984; Baker et al. Reference Baker, Menzies, Thirlwall and Macpherson1997), consistent with the absence of Eu anomaly in the chondrite-normalized REE patterns (Fig. 6a).
Harker variation diagrams for the Yeqing gabbro. The red arrows represent variation trend of part of major (wt %) and trace (ppm) elements towards the increase of MgO (wt %).

As presented above, the Yeqing gabbro is classified as HNBs with clear LREE enrichment and high Nb content (45.3–113.5 ppm). Two possible mantle sources have been generally proposed to generate HNBs, namely (1) OIB-type mantle source with mixing depleted normal-MORB (N-MORB) type components (Reagan & Gill, Reference Reagan and Gill1989; Storey et al. Reference Storey, Rogers, Saunders and Terrell1989; Luhr et al. Reference Luhr, Aranda-Gomez and Housh1995; Castillo et al. Reference Castillo, Rigby and Solidum2007; Castillo, Reference Castillo2008; Li et al. Reference Li, Zhu, Wang, Zhao, Zhang, Liu, Chang, Lu, Dai and Zheng2016) and (2) a mantle wedge metasomatized by slab melt (Defant et al. Reference Defant, Jackson, Drummond, De Bore, Bellon, Feigenson, Maury and Stewart1992; Kepezhinskas et al. Reference Kepezhinskas, Defant and Drummond1996; Sajona et al. Reference Sajona, Maury, Bellon, Cotton and Defant1996; Wang et al. Reference Wang, Wyman, Xu, Wan, Li, Zi, Jiang, Qiu, Chu, Zhao and Dong2007; Hastie et al. Reference Hastie, Mitchell, Kerr, Minifie and Millar2011; Xu et al. Reference Xu, Li, Wang, Fan, Wu and Li2017; Hao et al. Reference Hao, Wang, Zhang, Ou, Yang, Dan and Jiang2018). In REE patterns and trace-element spider diagrams, the NEBs/HNBs derived from OIB-type mantle source with mixing depleted N-MORB type components show obvious LREE enrichment and positive Nb and Ta anomalies reported in Baja (California), Nicaragua, Renso and Duobuzha (Tibet), called a-type NEBs/HNBs in the following discussion (Fig. 6a, b). In contrast, the NEBs/HNBs derived from mantle wedge with mixing slab melt show an almost flat curve and negative Nb and Ta anomalies reported in Tuotuohe and Gerze (Tibet), called b-type NEBs/HNBs (Fig. 6c, d).
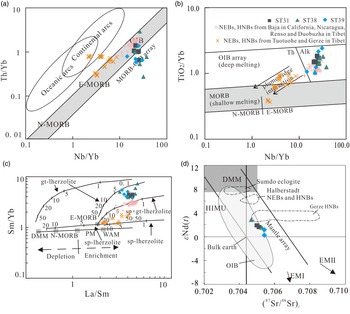
The HNBs that originated from a mantle wedge source metasomatized by slab melt still display some arc geochemical signatures, such as negative Nb–Ta anomalies and enrichment of Th (Fig. 6d; Kepezhinskas et al. Reference Kepezhinskas, Defant and Drummond1996; Sajona et al. Reference Sajona, Maury, Bellon, Cotton and Defant1996; Wang et al. Reference Wang, Wyman, Xu, Wan, Li, Zi, Jiang, Qiu, Chu, Zhao and Dong2007; Hao et al. Reference Hao, Wang, Zhang, Ou, Yang, Dan and Jiang2018). The Yeqing gabbro samples actually exhibit clearly positive Nb–Ta anomalies and depletion of Th (Fig. 6b, d). In the REE patterns and trace-element spider diagrams, the Yeqing gabbro shows a large slope like the OIB and a-type NEBs/HNBs, as distinct from the b-type NEBs/HNBs (Fig. 6b, d). In the Th/Yb vs Nb/Yb program (Fig. 9a), the gabbro samples plot in the OIB array like the a-type NEBs/HNBs, while the b-type NEBs/HNBs plot in the OIB to enriched MORB (E-MORB) array with a tendency to convert to continental arc, indicating that the magma of Yeqing gabbro generated without any addition of subduction fluids and melts. In the TiO2/Yb vs Nb/Yb diagram (Fig. 9b), these samples are plotted as OIBs (alkaline) like the a-type NEBs/HNBs, while the b-type NEBs/HNBs show characteristics of shallow melting, indicating that the Yeqing gabbro may be the product of deep melting where garnet is stable. In addition, the Sr and Nd isotopic compositions of the Yeqing gabbro and Sumdo eclogite differ greatly (Fig. 9d), while the metasomatism of the mantle wedge by slab-derived melt would require the formation of Nb-rich magma with Sr and Nd isotopic characteristics similar to oceanic slab (Castillo et al. Reference Castillo, Rigby and Solidum2007). Above all, the Yeqing gabbro is notably distinct from the NEBs and HNBs from mantle wedge metasomatized by slab melt with negligible characteristics of arc, precluding the possibility of a mantle wedge source metasomatized by slab melt.
(a) Th/Yb vs Nb/Yb plot and (b) TiO2/Yb vs Nb/Yb plot (Pearce, Reference Pearce2014). (c) La/Sm vs Sm/Yb plot. Mantle array (heavy line) defined by depleted MORB mantle (DMM; McKenzie & O’Nions, Reference McKenzie and O’Nions1991) and primitive mantle (PM; Sun & McDonough, Reference Sun, McDonough, Saunders and Norry1989); Melting curves for spinel lherzolite and garnet peridotite with both DMM and PM compositions are after Aldanmaz et al. (Reference Aldanmaz, Pearce and Thirlwall2000). Numbers along lines represent the degree of partial melting. (d) ϵ Nd(t) vs (87Sr/86Sr) i plot. Mantle arrays are after Zindler and Hart (Reference Zindler and Hart1986). Bulk Earth is after Depaolo (Reference DePaolo1988). OIB is after Wilson (Reference Wilson1989). The date of Sumdo eclogite is from Li et al. (Reference Li, Yang, Xu, Li, Xu, Ren and Robinson2009). Dates of Halberstadt, Gerze NEBs and HNBs are after Hastie et al. (Reference Hastie, Mitchell, Kerr, Minifie and Millar2011) and Hao et al. (Reference Hao, Wang, Zhang, Ou, Yang, Dan and Jiang2018).

Compared to normal arc basalts, the higher TiO2 (2.38–5.37 wt %), P2O5 (0.36–1.42 wt %), Nb (45.3–113.5 ppm) and Nb/Yb (14.6–38.1) suggest a deep mantle origin for the Yeqing gabbro. These samples exhibit LREE-enriched chondrite-normalized REE patterns and high (La/Yb)PM (11.51–27.12) and (Ce/Yb)PM (9.91–21.87) ratios, similar to those of basalts derived from garnet lherzolite (Hart & Dunn, Reference Hart and Dunn1993; Hauri et al. Reference Hauri, Wagner and Grove1994). These samples also plot in the garnet lherzolite field with a low degree of partial melting in the La/Sm vs Sm/Yb plot near the a-type NEBs/HNBs and far from b-type NEBs/HNBs (Fig. 9c; Aldanmaz et al. Reference Aldanmaz, Pearce and Thirlwall2000), indicating that the magma may be derived from a garnet-stable region (>85 km; Robinson & Wood, Reference Robinson and Wood1998) with lesser addition of N-MORB components, where it is generally considered to generate OIB (Niu, Reference Niu2009). However, according to mantle heterogeneity, the regional evolution and compotation of the study area must be taken into account when considering a ‘true’ OIB or the depleted and enriched mantle model (Hastie et al. Reference Hastie, Mitchell, Kerr, Minifie and Millar2011). There are several pieces of evidence about oceanic islands of the SPTO found in the TSACB, indicating that a plume had indeed existed in the SPTO (B Wang et al. Reference Wang, Li, Zeng, Li, Fan, Xie and Hao2019; Zhong et al. Reference Zhong, Zhu, Yang, Xie, Mai, Zhang, Li and Zhou2021; Duan et al. Reference Duan, Xie, Wang, Song and Hao2022). Consequently, there exists a true enriched OIB mantle beneath the SPTO crust as the material source of the Yeqing gabbro.
In addition, the Yeqing gabbro has elevated FeOT (11.54–14.72 wt %) and TiO2 (2.38–5.37 wt %) like the Fe–Ti basalts which are defined by >12 wt % FeOT and >2 wt % TiO2 (Sinton et al. Reference Sinton, Wilson, Christie, Hey and Delaney1983). Most of the Fe–Ti basalts show MORB affinity, such as lower concentrations of MgO, CaO and Al2O3. rather than N-MORB (Hollis et al. Reference Hollis, Roberts, Cooper, Earls, Herrington, Condon, Cooper, Archibald and Piercey2012). The gabbro in this study has a slightly lower MgO (average of 6.06 wt %) and CaO (average of 10.89 wt %) than N-MORB (MgO with average of 7.60 wt %; CaO with average of 11.48 wt %), which may be related to the fractional crystallization of olivine and a little pyroxene. The Al2O3 (average of 15.39 wt %) is slightly higher than N-MORB (average of 14.85 wt %). Besides, the Yeqing gabbro shows apparent LREE enrichment and HREE depletion in the REE diagram, and large slope curve in the trace-element diagram, in contrast to the Fe–Ti basalts with flat–modest slope curve in the REE and trace-element diagrams (Sinton et al. Reference Sinton, Wilson, Christie, Hey and Delaney1983; Hollis et al. Reference Hollis, Roberts, Cooper, Earls, Herrington, Condon, Cooper, Archibald and Piercey2012).
Relative to MORB, the zircon Hf isotopic composition of OIB has a narrow range and a lower ϵ Hf(t) value, and the mantle typically has a positive ϵ Hf(t) value (Nowell et al. Reference Nowell, Kempton, Noble, Fitton, Saunders, Mahoney and Taylor1998; Dobosi et al. Reference Dobosi, Kempton, Downes, Embey-Isztin, Thirlwall and Greenwood2003; Wu et al. Reference Wu, Li, Zheng and Gao2007). Zircon ϵ Hf(t) values of these samples are −0.2–6.3 which is lower than those of HNBs from Duobuzha and Rena Tso (2.44–11.64 and 1.9–7.6 respectively; Li et al. Reference Li, Zhu, Wang, Zhao, Zhang, Liu, Chang, Lu, Dai and Zheng2016) and similar to those of OIBs. The whole-rock Sr–Nd isotopic data of these samples exhibit slightly high (87Sr/86Sr) i (0.70468–0.70542), low 143Nd/144Nd (0.51253–0.51265) and low ϵ Nd(t) (0.3–2.7) relative to some other HNBs from mantle wedge (87Sr/86Sr of 0.70341–0.70484; 143Nd/144Nd of 0.51292–0.51307; ϵ Nd(t) of 2.57–6.80) (Wang et al. Reference Wang, Wyman, Xu, Wan, Li, Zi, Jiang, Qiu, Chu, Zhao and Dong2007; Hastie et al. Reference Hastie, Mitchell, Kerr, Minifie and Millar2011; Xu et al. Reference Xu, Li, Wang, Fan, Wu and Li2017; Hao et al. Reference Hao, Wang, Zhang, Ou, Yang, Dan and Jiang2018). As we can see, the Yeqing gabbro has a more enriched Sr–Nd isotopic composition than Sumdo eclogite and NEBs/HNBs from Halberstadt in the ϵNd(t) vs (87Sr/86Sr) i plot (Fig. 9d). The Halberstadt NEBs and HNBs exhibit relatively depleted features, which were generated from the mantle wedge metasomatized by slab melt (Fig. 9d; Hastie et al. Reference Hastie, Mitchell, Kerr, Minifie and Millar2011). An analogous Sr–Nd isotopic composition could be found between Yeqing gabbro and Gerze HNBs, which was produced by partial melting of an OIB-type source component involving upwelling asthenosphere mantle (Fig. 9d; Li et al. Reference Li, Zhu, Wang, Zhao, Zhang, Liu, Chang, Lu, Dai and Zheng2016). In conclusion, the geochemistry and isotopic signatures of the Yeqing gabbro samples can be interpreted as the production of a low-degree partial melting of garnet lherzolite mantle with the negligible contribution of subducted oceanic crust.
6.b. Tectonic setting
HNBs are not intraplate lavas like OIB and other alkaline lavas (Adam & Green, Reference Adam and Green2010); they are only found in subduction zone environments (Defant et al. Reference Defant, Jackson, Drummond, De Bore, Bellon, Feigenson, Maury and Stewart1992), such as Zamboanga Peninsula (Philippines; Sajona et al. Reference Sajona, Maury, Bellon, Cotton and Defant1996), Sulu (southern Philippines; Castillo et al. Reference Castillo, Rigby and Solidum2007), Baja (California; Luhr et al. Reference Luhr, Aranda-Gomez and Housh1995; Aguillón-Robles et al. Reference Aguillón-Robles, Calmus, Benoit, Bellon, Maury, Cotten, Bourgois and Michaud2001; Castillo, Reference Castillo2008), Halberstadt (Germany; Hastie et al. Reference Hastie, Mitchell, Kerr, Minifie and Millar2011), Kamchatka (Russia; Kepezhinskas et al. Reference Kepezhinskas, Defant and Drummond1996), Nicaragua (Gazel et al. Reference Gazel, Hoernle, Carr, Herzberg, Saginor, Bogaard, Hauff, Feigenson and Swisher2011), Tuotuohe (Tibet; Wang et al. Reference Wang, Wyman, Xu, Wan, Li, Zi, Jiang, Qiu, Chu, Zhao and Dong2007), Rena Tso (Tibet; Li et al. Reference Li, Zhu, Wang, Zhao, Zhang, Liu, Chang, Lu, Dai and Zheng2016), Duobuzha (Tibet; Li et al. Reference Li, Zhu, Wang, Zhao, Zhang, Liu, Chang, Lu, Dai and Zheng2016; Xu et al. Reference Xu, Li, Wang, Fan, Wu and Li2017) and Gerze (Tibet; Hao et al. Reference Hao, Wang, Zhang, Ou, Yang, Dan and Jiang2018). Actually, there are multiple hypotheses about the formation of HNBs and NEBs, which are linked with some specific subduction processes, like flat subduction, slab rollback, slab break-off, ridge subduction or plume – subduction-zone interaction (Thorkelson, Reference Thorkelson1996; Wang et al. Reference Wang, Wyman, Xu, Wan, Li, Zi, Jiang, Qiu, Chu, Zhao and Dong2007; Gazel et al. Reference Gazel, Hoernle, Carr, Herzberg, Saginor, Bogaard, Hauff, Feigenson and Swisher2011; Thorkelson et al. Reference Thorkelson, Madsen and Sluggett2011; Li et al. Reference Li, Zhu, Wang, Zhao, Zhang, Liu, Chang, Lu, Dai and Zheng2016; Xu et al. Reference Xu, Li, Wang, Fan, Wu and Li2017; Hao et al. Reference Hao, Wang, Zhang, Ou, Yang, Dan and Jiang2018; Wu et al. Reference Wu, Sun, Liu, Chu and Ding2018). In the case of the HNBs-type gabbro investigated in this study, the hypothesis of plume – subduction-zone interaction is invoked to interpret its generation based on the following evidence.
-
(1) The Yeqing gabbro is a part of the arc-volcanism system of the SPTO, which is supported by its spatial distribution and intrusion time.
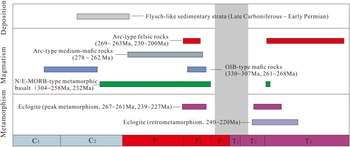
In fact, lots of HNBs and NEBs have been reported on the east coast of the Central Pacific as abnormal arc magmatism within the modern oceanic island arc system (Castillo, Reference Castillo2008; Hoernle et al. Reference Hoernle, Abt, Fischer, Nichols, Hauff, Abers, van den Bogaard, Heydolph, Alvarado, Protti and Strauch2008; Gazel et al. Reference Gazel, Hoernle, Carr, Herzberg, Saginor, Bogaard, Hauff, Feigenson and Swisher2011; Fletcher & Wyman, Reference Fletcher and Wyman2015). The subduction polarity of the SPTO is from south to north (ZL Li et al. Reference Li, Yang, Xu, Li, Xu, Ren and Robinson2009; Yang et al. Reference Yang, Xu, Li, Xu, Li, Ren and Robinson2009; Zhu et al. Reference Zhu, Mo, Zhao, Niu, Wang, Chu, Pan, Xu and Zhou2010; Mai et al. Reference Mai, Zhu, Yang, Xie, Tong, Hao and Zhong2021; YM Li et al. Reference Li, Yang, Zhu, Xie, Zhong, Mai, Zhou and Zhang2022), proved by the spatial distribution characteristics of the oceanic crust (ophiolites, oceanic islands; Chen et al. Reference Chen, Yang, Li and Xu2010; Duan et al. Reference Duan, Xie, Fan, Wang and Hao2019, Reference Duan, Xie, Wang, Song and Hao2022; B Wang et al. Reference Wang, Li, Zeng, Li, Fan, Xie and Hao2019, Reference Wang, Xie, Dong, Fan, Yu and Duan2021; Zhong et al. Reference Zhong, Zhu, Yang, Xie, Mai, Zhang, Li and Zhou2021), trench and initial fore-arc basin (Xie et al. Reference Xie, Song, Wang, Fan and Hao2019, Reference Xie, Duan, Song and Wang2021) and arc magmatism (Geng et al. Reference Geng, Sun, Pan, Zhu and Wang2009; Zhu et al. Reference Zhu, Mo, Zhao, Niu, Wang, Chu, Pan, Xu and Zhou2010; GM Li et al. Reference Li, Zhang, Wu, Xie, Zhu and Han2020; B Wang et al. Reference Wang, Xie, Dong, Fan and Yu2020; Reference Wang, Xie, Spier, Dong, Yu, Song, Duan and Yakymchuk2022; Mai et al. Reference Mai, Zhu, Yang, Xie, Tong, Hao and Zhong2021; N Li et al. Reference Li, Yang, Zhu, Xie, Zhong, Mai, Zhou and Zhang2022; Song et al. Reference Song, Xie, Gao, Yu, Wang, Duan and Hao2022; C Wang et al. Reference Wang, Xie, Spier, Dong, Yu, Song, Duan and Yakymchuk2022) from south to north. The intrusion time of the Yeqing gabbro is coincident with the period of the SPTO subduction in the early–middle Permian and middle–late Triassic by studying the eclogites (Li et al. Reference Li, Yang, Xu, Li, Xu, Ren and Robinson2009; Cheng et al. Reference Cheng, Zhang, Vervoort, Lu, Wang and Cao2012, Reference Cheng, Liu, Vervoort and Lu2015; Zhang et al. Reference Zhang, Bader, Zhang, Shen, Li and Li2018 a, b), which is also proved by the contemporaneous arc magmatism mentioned above (Fig. 10).
-
(2) The flat subduction and slab rollback could scarcely happen in the SPTO.
Distribution diagram of ages related to the Sumdo Palaeo-Tethys Ocean (data are quoted from Geng et al. Reference Geng, Sun, Pan, Zhu and Wang2009; Yang et al. Reference Yang, Xu, Li, Xu, Li, Ren and Robinson2009; Zhu et al. Reference Zhu, Mo, Niu, Zhao, Yang and Wang2009, Reference Zhu, Mo, Zhao, Niu, Wang, Chu, Pan, Xu and Zhou2010; Cheng et al. Reference Cheng, Zhang, Vervoort, Lu, Wang and Cao2012, 2014; Zhang et al. Reference Zhang, Bader, Van, Yang, Shen, Qiu, Li and Zheng2018; Duan et al. Reference Duan, Xie, Fan, Wang and Hao2019, Reference Duan, Xie, Wang, Song and Hao2022; Xie et al. Reference Xie, Song, Wang, Fan and Hao2019, Reference Xie, Duan, Song and Wang2021; B Wang et al. Reference Wang, Li, Zeng, Li, Fan, Xie and Hao2019, Reference Wang, Xie, Dong, Fan and Yu2020, Reference Wang, Xie, Dong, Fan, Yu and Duan2021 , Reference Wang, Xie, Spier, Dong, Yu, Song, Duan and Yakymchuk2022; Li et al. Reference Li, Zhang, Wu, Xie, Zhu and Han2020, Reference Li, Yang, Zhu, Xie, Zhong, Mai, Zhou and Zhang2022; Mai et al. Reference Mai, Zhu, Yang, Xie, Tong, Hao and Zhong2021; Zhong et al. Reference Zhong, Zhu, Yang, Xie, Mai, Zhang, Li and Zhou2021; Song et al. Reference Song, Xie, Gao, Yu, Wang, Duan and Hao2022; C Wang et al. Reference Wang, Xie, Spier, Dong, Yu, Song, Duan and Yakymchuk2022).

The young ocean slab with slighter density subducted with a low angle like flat subduction in the early stage due to greater buoyancy, while the density of the subduction slab increased after the subduction slab dehydrated and then slab rollback occurred (Klein & Langmuir, Reference Klein and Langmuir1987; Hawkins et al. Reference Hawkins, Lonsdale, MacDougall and Volpe1990). However, the SPTO had subducted to a deep mantle in the middle Permian (Li et al. Reference Li, Yang, Xu, Li, Xu, Ren and Robinson2009; Cheng et al. Reference Cheng, Zhang, Vervoort, Lu, Wang and Cao2012, Reference Cheng, Liu, Vervoort and Lu2015; Zhang et al. Reference Zhang, Bader, Van, Yang, Shen, Qiu, Li and Zheng2018 b), indicating that slab rollback and flat subduction is unlikely to have taken place during the late Permian to early Triassic. A magma belt parallel to the subduction belt is commonly required to respond to the asthenosphere upwelling after slab rollback, whereas no analogous magma was discovered in the Sumdo area to constitute a magma belt with the Yeqing gabbro.
-
(3) The slab break-off and ridge subduction are unlikely to lead to formation of the Yeqing gabbro.
Slab break-off generally occurs c. 10 Ma after a continental collision (Benoit et al. Reference Benoit, Aguilloân-Robles, Calmus, Maury, Bellon, Cotton, Bourgois and Michaud2002; Wu et al. Reference Wu, Sun, Liu, Chu and Ding2018). The closure of the SPTO occurred later at least than the late Triassic, supported by the discovery of middle Triassic ophiolite (232–231 Ma; Duan et al. Reference Duan, Xie, Fan, Wang and Hao2019) in Sumdo and a late Triassic – early Jurassic medium-pressure metamorphic belt (225–192 Ma; Dong et al. Reference Dong, Zhang, Liu, Wang, Yu and Shen2011, Reference Dong, Xu, Li, Liu and Li2015; Lin et al. Reference Lin, Zhang, Dong, Xiang and Yan2013; Zhang et al. Reference Zhang, Dong, Santosh and Zhao2014, Reference Zhang, Bader, Van, Yang, Shen, Qiu, Li and Zheng2018 b) between the South and North Lhasa terranes accompanied by the coeval magmatism with a geochemical affinity to syn- or post-collisional plutons (227–180 Ma; HF Zhang et al. Reference Zhang, Xu, Guo, Zong, Cai and Yuan2007; Zhu et al. Reference Zhu, Zhao, Niu, Mo, Chung, Hou, Wang and Wu2011; Li et al. Reference Li, Xu, Yang and Tang2012; C Zhang et al. Reference Zhang, Bader, Van, Yang, Shen, Qiu, Li and Zheng2018 b). Thus, slab break-off did not occur in the SPTO. The Yeqing gabbro is also unlikely to have formed in ridge subduction, which requires a huge volume of magmatism response, such as A-type granite, adakite, high-Mg andesite and high-temperature metamorphic rocks (Hole et al. Reference Hole, Rogers, Saunders and Storey1991; McCrory et al. Reference McCrory, Wilson and Stanley2009; Xu et al. Reference Xu, Li, Wang, Fan, Wu and Li2017), that is missing in the Sumdo area.
-
(4) The back-arc basin may not be a better position to form the Yeqing gabbro.
Geochemistry characteristics of the Yeqing gabbro show Fe–Ti–P enrichment, and lack of arc- and contamination signature. Fe–Ti-enriched basalts are confined to extensional settings with upwelling of the asthenosphere and have been reported from back-arc basins in the subduction belt (Hollis et al. Reference Hollis, Roberts, Cooper, Earls, Herrington, Condon, Cooper, Archibald and Piercey2012). However, there have been no reports about the sedimentary rock of a back-arc basin in the Sumdo area. On the other hand, the back-arc basin basalts are characterized by mainly strong arc affinity in the early stage, and clear MORB affinity in the late stage (Klein & Langmuir, Reference Klein and Langmuir1987; Hawkins et al. Reference Hawkins, Lonsdale, MacDougall and Volpe1990). In fact, the arc magmatism in the Sumdo area shows typical island-arc characteristics (Zhu et al. Reference Zhu, Mo, Zhao, Niu, Wang, Chu, Pan, Xu and Zhou2010; B Wang et al. Reference Wang, Xie, Dong, Fan and Yu2020, Reference Wang, Xie, Spier, Dong, Yu, Song, Duan and Yakymchuk2022; Mai et al. Reference Mai, Zhu, Yang, Xie, Tong, Hao and Zhong2021; Li et al. Reference Li, Yang, Zhu, Xie, Zhong, Mai, Zhou and Zhang2022; C Wang et al. Reference Wang, Xie, Spier, Dong, Yu, Song, Duan and Yakymchuk2022), which also supports the absence of a back-arc basin.
-
(5) The plume – subduction-zone interaction may be a better model to explain the formation of Yeqing gabbro.
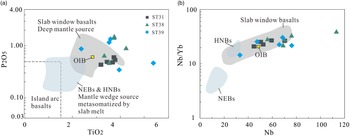
As discussed above, the Yeqing gabbro derived from a deep garnet lherzolite mantle with the negligible contribution of subducted oceanic crust. The intrusion from deep garnet lherzolite mantle in the subduction belt is usually related to asthenosphere upwelling in an extension environment, which is caused by a slab window or slab rollback. The slab rollback model has been excluded already. Besides, the Yeqing gabbro samples plot in within-plate alkali basalts and ocean island alkaline field like the a-type NEBs/HNBs that are caused by ridge subduction or plume – subduction-zone interaction, different from the b-type NEBs/HNBs caused by flat subduction or slab rollback (Fig. 5c, d). In the P2O5 vs TiO2 and Nb/Yb vs Nb figure (Fig. 11a, b), most of these samples plot in the slab window field. The slab window is common in slab break-off or ridge subduction, which are not suitable for this study. Moreover, the seismic ridge, a series of seamount island chains formed by oceanic crust moving over fixed hotspot/mantle plume, could bring about a slab window while subducting (Gazel et al. Reference Gazel, Hoernle, Carr, Herzberg, Saginor, Bogaard, Hauff, Feigenson and Swisher2011; Fletcher & Wyman, Reference Fletcher and Wyman2015). Actually, researchers have reported multiple ocean islands formed from the latest early Carboniferous to middle Permian (B Wang et al. Reference Wang, Li, Zeng, Li, Fan, Xie and Hao2019; Zhong et al. Reference Zhong, Zhu, Yang, Xie, Mai, Zhang, Li and Zhou2021; Duan et al. Reference Duan, Xie, Wang, Song and Hao2022), implying the presence of seismic ridge in the SPTO. At the same time, the hotspot/mantle plume could provide a perfect mantle source for the Yeqing gabbro and favourable conditions for the possibility of plume – subduction-zone interaction.
(a) P2O5 vs TiO2 figure (Li et al. Reference Li, Zhu, Wang, Zhao, Zhang, Liu, Chang, Lu, Dai and Zheng2016). (b) Nb/Yb vs Nb figure (Li et al. Reference Li, Zhu, Wang, Zhao, Zhang, Liu, Chang, Lu, Dai and Zheng2016). Slab window basalts are from Li et al. (Reference Li, Zhu, Wang, Zhao, Zhang, Liu, Chang, Lu, Dai and Zheng2016 and references therein).

6.c. Geological significance for the subduction evolution of the SPTO
According to the discussion of petrogenesis and tectonic setting above, we propose that the hotspot/mantle plume began to interact with the subduction zone in the SPTO after the middle Permian, and the hotter plume material upwelled through a slab window intruding into the continental edge during the late Permian to early Triassic. Under this framework, the formation of the Yeqing gabbro and subduction evolution of the SPTO can be briefly described as follows combined with the regional geology.
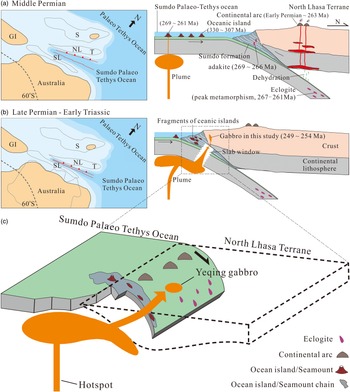
Research into ophiolites and oceanic islands has revealed that the SPTO had already developed an initial ocean basin in the early Carboniferous (Wang et al. Reference Wang, Xie, Dong, Fan, Yu and Duan2021; Duan et al. Reference Duan, Xie, Wang, Song and Hao2022). The SPTO began to subduct not later than the early Permian and subducted to a greater depth beneath the north Lhasa terrane during the middle Permian (Fig. 12a; Yang et al. Reference Yang, Xu, Geng, Li, Xu, Li, Ren, Li, Cai, Liang and Chen2006; Cheng et al. Reference Cheng, Zhang, Vervoort, Lu, Wang and Cao2012; Weller et al. Reference Weller, St-Onge, Rayner, Waters, Searle and Palin2016). Meanwhile, the middle Permian Wenmulang and Ewulang ocean islands imply that the plume under the ocean plate was still active during the middle Permian (Fig. 12a; B Wang et al. Reference Wang, Li, Zeng, Li, Fan, Xie and Hao2019; Zhong et al. Reference Zhong, Zhu, Yang, Xie, Mai, Zhang, Li and Zhou2021). Until the late Permian, the seismic ridge in the SPTO, a structurally weak position of oceanic slab, subducted into the trench, and the slab was torn in the frail place forming a slab window (Gazel et al. Reference Gazel, Hoernle, Carr, Herzberg, Saginor, Bogaard, Hauff, Feigenson and Swisher2011) (Fig. 12b, c). The detached slab was replaced by a hot and buoyant asthenosphere mantle, which generated the Yeqing gabbro in this study (Fig. 12b, c). This is the hypothesis put forward in this study to explain the generation of the Yeqing gabbro. Nevertheless, it is mainly based on petrological, geochronological and geochemical observations. Further studies will be required to verify this hypothesis.
Reconstructed palaeogeography and subduction model of the Sumdo Palaeo–Tethys Ocean during the middle Permian (a) and late Permian to early Triassic (b) (modified after Torsvik & Cocks, Reference Torsvik and Cocks2013; Xie et al. Reference Xie, Duan, Song and Wang2021). (c) The schematic model of the geological processes of plume – subduction-zone interactions required to explain the formation of Yeqing gabbro (modified after Gazel et al. Reference Gazel, Hoernle, Carr, Herzberg, Saginor, Bogaard, Hauff, Feigenson and Swisher2011). GI, Greater India; S, Sibumasu; NL, North Lhasa; SL, South Lhasa; T, Tengchong.

Conclusions
-
(1) LA-ICP-MS U–Pb ages of zircon from Yeqing gabbro are 254–249 Ma, late Permian to early Triassic, which represents the magmatic crystallization age of the Yeqing gabbro.
-
(2) The Yeqing gabbro exhibits positive Nb–Ta anomalies, Fe–Ti–P enrichment, lack of arc- and contamination signature, similar to those of OIB and HNBs, indicating that the Yeqing gabbro may be the product of a low degree of partial melting of garnet lherzolite mantle generated from an extensional environment in the subduction belt.
-
(3) Considering the regional geology of the SPTO, a slab window produced by the plume – subduction-zone interaction is a better explanation for the formation of Yeqing gabbro, proving the SPTO continued to subduct during late Permian to early Triassic.
Supplementary material
To view supplementary material for this article, please visit https://doi.org/10.1017/S0016756822001182
Acknowledgements
This study was financially supported by the National Natural Science Foundation of China (Grant No. 42172226), the Second Tibetan Plateau Scientific Expedition and Research (STEP) Program (Grant No. 2019QZKK0703), and the Independent research fund of Key Laboratory of Mineral Resources Evaluation in Northeast Asia, Department of Natural Resources (DBY-ZZ-18-06).
Conflict of interest
None.