



1 Introduction
The transition to turbulence in pipe flows of Newtonian fluids is abrupt and strongly subcritical (see, e.g. Eckhardt et al. Reference Eckhardt, Schneider, Hof and Westerweel2007). The first turbulent structures, i.e. the ones which can be observed at the lowest values of the Reynolds number, are turbulent spots moving downstream, called ‘puffs’ (Wygnanski & Champagne Reference Wygnanski and Champagne1973). The modelling of this transition is difficult, because of its highly nonlinear nature. Zikanov (Reference Zikanov1996) showed that streamwise vortices or rolls can generate strong streamwise streaks through the lift-up mechanism, and that these streaks can undergo an inflectional wavy instability. The fully nonlinear simulations of Meseguer (Reference Meseguer2003) confirmed that this instability leads to turbulence. In the slightly different context of channel flows, it was shown by Waleffe (Reference Waleffe1997, Reference Waleffe1998), that, besides the turbulent puff solutions, there also exist more symmetric and regular travelling wave solutions. These three-dimensional, unstable waves are ‘precursors’ of the puffs and are sustained because of similar mechanisms. Precisely, Waleffe described this self-sustaining process: the waves contain streamwise rolls and streamwise streaks, the former feeding the latter; the streaks through an ‘inflectional instability’ feed the fluctuating fields of the waves; these fluctuations reinforce the streamwise rolls through Reynolds stresses. Faisst & Eckhardt (Reference Faisst and Eckhardt2003), Wedin & Kerswell (Reference Wedin and Kerswell2004) applied these ideas to pipe flows and discovered numerically new travelling wave solutions (figure 11 b) similar in principle to the ones found by Waleffe (Reference Waleffe1998) in channel flows. These waves, that we denote hereafter ‘EFKW waves’, appear through an abrupt saddle-node bifurcation at a critical Reynolds number
 $$\begin{eqnarray}\displaystyle \mathit{Re}_{c}(m_{0}=2)=1359 & & \displaystyle\end{eqnarray}$$
for the twofold symmetric waves,
 $$\begin{eqnarray}\displaystyle \mathit{Re}_{c}(m_{0}=3)=1251 & & \displaystyle\end{eqnarray}$$
for the threefold symmetric waves. Here
 $$\begin{eqnarray}\displaystyle \mathit{Re}=\overline{W}d/\unicode[STIX]{x1D708}, & & \displaystyle\end{eqnarray}$$
with
 $\overline{W}$
the mean speed or bulk velocity,
 $d=2a$
the diameter of the pipe,
 $\unicode[STIX]{x1D708}$
the kinematic viscosity of the Newtonian fluid (table 1). The integer
 $m_{0}$
is the basic azimuthal wavenumber of the travelling waves: these waves are invariant under the rotation
 $$\begin{eqnarray}\displaystyle \unicode[STIX]{x1D703}\mapsto \unicode[STIX]{x1D703}+2\unicode[STIX]{x03C0}/m_{0}, & & \displaystyle\end{eqnarray}$$
with
 $\unicode[STIX]{x1D703}$
the azimuthal angle of a cylindrical coordinate system
 $(r,\unicode[STIX]{x1D703},z)$
set around the pipe axis O
 $z$
. EFKW waves are also invariant under the translational symmetry
 $$\begin{eqnarray}\displaystyle z\mapsto z+L_{z}\quad \text{with}~L_{z}=2\unicode[STIX]{x03C0}/q, & & \displaystyle\end{eqnarray}$$
 $L_{z}\simeq 2d,~q\simeq 4/d$
the basic axial wavenumber, and of a further ‘shift-and-reflect’ symmetry
 $$\begin{eqnarray}\displaystyle (r,\unicode[STIX]{x1D703},z)\mapsto (r,-\unicode[STIX]{x1D703},z+\unicode[STIX]{x03C0}/q)\quad \Longrightarrow \quad (u,v,w,p)\mapsto (u,-v,w,p), & & \displaystyle\end{eqnarray}$$
with
 $(u,v,w)$
the velocity components,
 $p$
the pressure. Moreover, they depend on
 $z$
and time
 $t$
only through the combination
 $z-ct$
with
 $c$
a well-defined phase speed. All these properties permit spectral expansions of the type of (2.11) below. Consequently, the waves can be computed with pseudospectral methods and a rather low number of degrees of freedom, of the order of
 $5\times 10^{3}$
, whereas direct numerical simulations of puffs require at least
 $2\times 10^{5}$
degrees of freedom. Given the complexity of the equations of motion of non-Newtonian fluids, this is quite useful. This explains, to a large extent, the paradigm of our work, where we focus on the threefold symmetric EFKW waves. The fact that these waves appear at a lower Reynolds number (1.2) in Newtonian fluids means that their ‘self-sustaining process’ is more efficient, as compared with the one sustaining the twofold symmetric EFKW waves (1.1). These unstable, precursor waves, are indeed to some extent ‘support’ of the puffs, since the flows in puffs may ‘visit’ some waves in a transient manner, as shown experimentally by Hof et al. (Reference Hof, van Doorne, Westerweel, Nieuwstadt, Faisst, Eckhardt, Wedin, Kerswell and Waleffe2004, Reference Hof, van Doorne, Westerweel and Nieuwstadt2005) and numerically by Kerswell & Tutty (Reference Kerswell and Tutty2007). The ‘precursor’ nature of the waves is confirmed by the fact that the Reynolds numbers (1.1), (1.2) are lower bounds of the critical Reynolds number at which turbulence sets in experiments with large natural levels of perturbations,
 $$\begin{eqnarray}\displaystyle \mathit{Re}^{t}\simeq 2040, & & \displaystyle\end{eqnarray}$$
as established by Avila, Willis & Hof (Reference Avila, Willis and Hof2010), Avila et al. (Reference Avila, Moxey, de Lozar, Avila, Barkley and Hof2011) through an analysis of puff dynamics (puff decaying versus puff splitting) in direct numerical simulations and experiments. Note finally that a recent experimental study of fully turbulent pipe flow at
 $\mathit{Re}=35\,000$
also showed the predominance of threefold symmetric patterns (Dennis & Sogaro Reference Dennis and Sogaro2014).
Of course, focusing solely on EFKW waves with
 $m_{0}=3$
is restrictive.
Firstly, other families of waves and ‘exact coherent structures’ have been discovered since the pioneering works of Faisst & Eckhardt (Reference Faisst and Eckhardt2003), Wedin & Kerswell (Reference Wedin and Kerswell2004). Among those, the first ones found are ‘global’, like the EFKW waves. This means that they ‘live’ in the whole pipe, without any localization effect: the kinetic energy averaged in a pipe cross-section,
 $E(z,t)$
, oscillates mildly with
 $z$
and
 $t$
, around a mean value, but do not show strong variations. Global waves with symmetries different from those of the EFKW ones have been found, see e.g. Pringle & Kerswell (Reference Pringle and Kerswell2007) and the quite complete article by Pringle, Duguet & Kerswell (Reference Pringle, Duguet and Kerswell2009). Some of them appear at rather low values of the Reynolds number, and may be more linked to the ‘edge’ of chaos (the ‘frontier’ of the basin of attraction of the laminar flow) than to puffs. Global ‘relative periodic orbits’ or ‘modulated waves’ have also been found by Duguet, Pringle & Kerswell (Reference Duguet, Pringle and Kerswell2008a
), Mellibovsky & Eckhardt (Reference Mellibovsky and Eckhardt2011): contrarily to the travelling waves, which are stationary in frames drifting in the
 $z$
direction at their phase velocity
 $c$
, modulated waves lose this symmetry and oscillate in all frames. Avila et al. (Reference Avila, Mellibovsky, Roland and Hof2013) discovered modulated waves localized in the streamwise direction. Of course, in their case, the axial length of the periodic pipe is much longer,
 $L_{z}\simeq 40d$
. The localized modulated waves present some strong similarities with a puff, and were, in fact, found close to a puff solution. Recently, Chantry, Willis & Kerswell (Reference Chantry, Willis and Kerswell2014) showed that the localized modulated waves of Avila et al. (Reference Avila, Mellibovsky, Roland and Hof2013) originate in a modulational Hopf bifurcation from a global travelling wave with
 $m_{0}=2$
. Chantry et al. (Reference Chantry, Willis and Kerswell2014) also exhibited a similar bifurcation from a global travelling wave with
 $m_{0}=3$
, that leads to other localized modulated waves. With the notations of Pringle et al. (Reference Pringle, Duguet and Kerswell2009), the global travelling wave is of the ‘N3’ family, which is, however, connected to the ‘S3’ family i.e. the EFKW waves
 $m_{0}=3$
with our notations (see the figure 8 of Pringle et al.
Reference Pringle, Duguet and Kerswell2009).
Secondly, ‘exact coherent structures’ like travelling or modulated waves are not sufficient to model accurately real transition scenarios in pipe flow. For instance, the direct numerical simulations of Avila et al. (Reference Avila, Moxey, de Lozar, Avila, Barkley and Hof2011) were run without symmetry assumptions, except for the periodicity in the
 $z$
-direction, with
 $L_{z}\gtrsim 150d$
. Thus, the structures that were computed (single puff, decaying or splitting, multiple puffs
 $\ldots$
) are ‘exactly coherent’ in a very loose sense only.
Nevertheless, the question of the influence of a non-Newtonian rheology on the EFKW
 $m_{0}=3$
waves is of fundamental interest, especially if one accepts the idea that these waves are relevant precursors and, to a certain extent, ‘supports’ of the puffs (Eckhardt et al.
Reference Eckhardt, Schneider, Hof and Westerweel2007). Non-Newtonian fluids are common in biological systems (blood, for instance, may be considered as a non-Newtonian fluid), geophysical systems (the Earth’s mantle, volcanic lava, mud,
 $\ldots$
), civil engineering (cement,
 $\ldots$
), petroleum engineering (oil,
 $\ldots$
), chemical industry (polymeric fluids), pharmaceutical industry, etc…Their flow behaviour is complex: it typically combines an elastic response, which is often nonlinear, and a viscous response, with a non-constant, nonlinear viscosity. These rheological properties influence the transition to turbulence and the turbulence itself. For instance, Toms (Reference Toms1948) demonstrated that adding a small amount of some polymers into a Newtonian solvent can lead to a strong drag reduction in turbulent pipe flow. This effect is now used in pipelines. Studying precisely the pipe flows of polymer solutions in water which exhibit drag reduction in the turbulent regime, Escudier, Presti & Smith (Reference Escudier, Presti and Smith1999), Escudier et al. (Reference Escudier, Poole, Presti, Dales, Nouar, Desaubry, Graham and Pullum2005), Escudier, Rosa & Poole (Reference Escudier, Rosa and Poole2009) also noticed a delay in the transition to turbulence, i.e. puffs set in at a larger value of the Reynolds number,
 $\mathit{Re}_{w}^{t}$
, than in Newtonian fluids. Importantly, the Reynolds number used
 $$\begin{eqnarray}\displaystyle \mathit{Re}_{w}=\overline{W}d/\unicode[STIX]{x1D708}_{w} & & \displaystyle\end{eqnarray}$$
is based on the wall viscosity
 $\unicode[STIX]{x1D708}_{w}$
, which can be deduced from the mean pressure gradient
 $G$
, as it will be explained in § 2.3. In the experiments of Escudier et al., no effort was made to reduce or control the level of the flow perturbations. The appearance of puffs was deduced from a sharp increase of the root mean square value
 $w^{\prime }$
of the fluctuations of the axial velocity, which was measured with laser Doppler velocimetry (LDV) far from the pipe inlet, at least 100
 $d$
downstream, and at a radial position of
 $0.8a$
with
 $a$
the pipe radius. Whereas, in Newtonian fluids,
 $w^{\prime }$
increases sharply when
 $\mathit{Re}\simeq \mathit{Re}^{t}=2040$
, in some non-Newtonian fluids
 $w^{\prime }$
increases sharply at similar Reynolds values, but in other fluids, made of rather concentrated polymer solutions, at larger values. The largest values of
 $\mathit{Re}_{w}^{t}$
are of the order of 4000 in Escudier et al. (Reference Escudier, Presti and Smith1999) (their figure 9) and Escudier et al. (Reference Escudier, Poole, Presti, Dales, Nouar, Desaubry, Graham and Pullum2005) (their figure 5b), 9000 in Escudier et al. (Reference Escudier, Rosa and Poole2009) (their figure 4b). A stabilizing effect that is compatible with these results has been evidenced by Draad, Kuiken & Nieuwstadt (Reference Draad, Kuiken and Nieuwstadt1998) in the same range of Reynolds numbers,
 $2000\leqslant \mathit{Re}_{w}\leqslant 10\,000$
. Draad et al. (Reference Draad, Kuiken and Nieuwstadt1998) introduced controlled perturbations in a set-up with an otherwise low level of natural perturbations, and measured the critical velocity needed to trigger turbulence 115
 $d$
downstream of the disturbance system. Turbulence was detected through a drop in the centreline velocity measured by LDV. Their figures 19 and 20 show that, as compared with water, non-Newtonian fluids require, in the range
 $2000\leqslant \mathit{Re}_{w}\leqslant 10\,000$
, a larger critical velocity to trigger turbulence.
Most non-Newtonian fluids are both elastic and shear thinning, i.e. the viscosity decreases when the shear rate increases. This last property is evidenced for instance in our figure 1, the figure 14 of Draad et al. (Reference Draad, Kuiken and Nieuwstadt1998) or the figure 2 of Escudier et al. (Reference Escudier, Rosa and Poole2009). Quite probably, both phenomena, elasticity and shear thinning, play a role in the transition to turbulence. For the sake of simplicity, we choose to focus here on viscous effects only, neglecting the elastic response of the fluid (furthermore, elastic effects are often under focus in the literature). This modelling hypothesis can be physically justified for some fluids which show a rather weak elastic response, e.g. xanthan gum (Escudier et al.
Reference Escudier, Presti and Smith1999, Reference Escudier, Rosa and Poole2009). The rheological model giving the viscosity of the fluid, as a function of the shear rate, is chosen to be the Carreau model, which is a particular case of the more general Carreau–Yasuda model (Bird, Armstrong & Hassager Reference Bird, Armstrong and Hassager1987). As shown by Carreau (Reference Carreau1972), this model has a theoretical foundation. The Carreau model (see 2.6 below) has four material parameters: the zero-shear-rate (dynamic) viscosity
 $\unicode[STIX]{x1D702}_{0}$
, the infinite-shear-rate (dynamic) viscosity
 $\unicode[STIX]{x1D702}_{\infty }$
, which is smaller, the characteristic time of the fluid
 $\unicode[STIX]{x1D706}_{C}$
and the shear-thinning index
 $n_{C}$
. The changeability offered by these four parameters allows this model to represent correctly the rheological behaviour of the viscosity of some real fluids, as shown by Carreau (Reference Carreau1972), Bird et al. (Reference Bird, Armstrong and Hassager1987) for various polymer solutions, and, more recently, by Draad et al. (Reference Draad, Kuiken and Nieuwstadt1998), Roland, Plaut & Nouar (Reference Roland, Plaut and Nouar2010), hereafter, Roland et al. (Reference Roland, Plaut and Nouar2010), for different solutions of polyacrylamide. Another interest of the Carreau model is that it is mathematically regular, which is not the case of the simpler, more ‘popular’ power-law model. This latter model, which can describe partly the behaviour of some strongly shear-thinning fluids, is however often used in the engineering community because, in the laminar regime, it allows an analytical calculation of the flow. This is not possible with the more complex Carreau model. A remarkable property of the Carreau model is that, when the characteristic time of the fluid
 $\unicode[STIX]{x1D706}_{C}$
is much larger than the advection time
 $d/\overline{W}$
, it tends, if one assumes
 $\unicode[STIX]{x1D702}_{\infty }=0$
, towards the power-law model. The regime where
 $\unicode[STIX]{x1D706}_{C}\gg d/\overline{W}$
is the regime relevant for the study of the transition to turbulence. Indeed, polymeric fluids are generally much more viscous than water, hence attaining Reynolds numbers
 $\mathit{Re}_{w}\gtrsim 2000$
require large values of
 $\overline{W}$
, hence, usually, small values of
 $d/\overline{W}$
.
Flow curves of the 0.125 % w/w polyacrylamide fluid studied by Escudier et al. (Reference Escudier, Rosa and Poole2009): (a) viscosity, (b) shear stress versus shear rate. Continuous curves, Carreau’s model (2.6) with
 $\unicode[STIX]{x1D702}_{0}=4.22~\text{Pa}~\text{s}$
,
 $\unicode[STIX]{x1D702}_{\infty }=0.00372~\text{Pa}~\text{s}$
,
 $\unicode[STIX]{x1D706}_{C}=45.8~\text{s}$
,
 $n_{C}=0.34$
; dashed lines, power-law model; vertical dotted lines, characteristic shear rate
 $\dot{\unicode[STIX]{x1D6FE}}=1/\unicode[STIX]{x1D706}_{C}$
for the onset of shear-thinning.

Theoretical studies of the transition to turbulence in pipe flows of non-Newtonian, purely viscous fluids, are rare. If one excludes yield-stress fluids, which are quite singular – but physically interesting –, the already published theoretical studies are only, to our knowledge, Roland et al. (Reference Roland, Plaut and Nouar2010); Liu & Liu (Reference Liu and Liu2012), López Carranza, Jenny & Nouar (Reference López Carranza, Jenny and Nouar2012, Reference López Carranza, Jenny and Nouar2013). In López Carranza et al. (Reference López Carranza, Jenny and Nouar2012), it has been checked that the laminar pipe flows of Carreau fluids are linearly stable, as it is the case of the laminar pipe flow of Newtonian fluids. López Carranza et al. (Reference López Carranza, Jenny and Nouar2012), Liu & Liu (Reference Liu and Liu2012) studied and characterized transient growth, with the result that two-dimensional rolls constitute the optimal perturbation, that leads after a while to strong streamwise streaks. Interestingly, Liu & Liu (Reference Liu and Liu2012) showed that, whereas the optimal azimuthal wavenumber is
 $m_{0}=1$
for weakly shear-thinning fluids, it increases to
 $m_{0}=3$
for highly shear-thinning fluids with
 $n_{C}\leqslant 0.25$
. In López Carranza et al. (Reference López Carranza, Jenny and Nouar2013), the stability of the streamwise streaks with
 $m_{0}=1$
produced by transient growth has been analysed with respect to small perturbations assuming the form of three-dimensional waves. This study, which has been inspired by the one of Zikanov (Reference Zikanov1996), allows the determination of a ‘critical streak amplitude’ for transition. This amplitude slightly decreases when the shear-thinning character of the fluid increases. These results may be connected to a first regime found in the experiments, at intermediate Reynolds numbers, before the apparition of the puffs, where a weakly turbulent streaky structure has been found, with a dominant mode at
 $m_{0}=1$
(Escudier et al.
Reference Escudier, Poole, Presti, Dales, Nouar, Desaubry, Graham and Pullum2005, Reference Escudier, Rosa and Poole2009).
The study of Roland et al. (Reference Roland, Plaut and Nouar2010) focussed on the influence of a shear-thinning rheology on EFKW
 $m_{0}=3$
waves, viewed as ‘precursors’ and ‘support’ of the puffs. Carreau’s rheological model was used. The basic axial wavenumber was fixed to its optimal value for Newtonian fluids,
 $$\begin{eqnarray}\displaystyle q=q_{cN}=2.44/a. & & \displaystyle\end{eqnarray}$$
A very strong retardation effect was found: in a moderately shear-thinning fluid (
 $\unicode[STIX]{x1D706}=2$
with the notations of Roland et al. (Reference Roland, Plaut and Nouar2010), which are also ours, see (2.18)), where the viscosity at the wall, in the laminar flow, is still 40 % of
 $\unicode[STIX]{x1D702}_{0}$
, the critical Reynolds number
 $\mathit{Re}_{wc}$
for the onset of
 $m_{0}=3$
waves was multiplied by 3, as compared with the Newtonian value (1.2).
The present work is a follow up of Roland et al. (Reference Roland, Plaut and Nouar2010). We study the influence of the basic axial wavenumber
 $q$
and optimize it by minimizing the values of
 $\mathit{Re}_{w}$
for the onset of (modified) EFKW
 $m_{0}=3$
waves through a saddle-node bifurcation. We focus on the physically relevant power-law limit, assuming
 $\unicode[STIX]{x1D702}_{\infty }=0$
. This last hypothesis is realistic, as explained in § 2.1. From a study of the numerical results obtained with the typical value
 $n_{C}=0.5$
, semi-analytical formulae are established in the power-law limit. The relevance of these formulae is confirmed with computations for other values of
 $n_{C}$
.
The mathematical and physical model is presented in § 2, the basic laminar flows in § 3. In § 4, we give some general informations on the pressure gradient and the friction factors. Our main § 5 is devoted to the computation and study of the nonlinear waves at constant pressure gradient, the one that drives the ‘reference laminar base flow’. A further study where the critical wave solutions already obtained are compared to the laminar flow at the same mass flux is presented in § 6. A concluding discussion closes.
2 Model
2.1 Dimensional model: general equations – rheology
We consider an incompressible, purely viscous fluid. Its Eulerian velocity field
 $\boldsymbol{v}$
therefore fulfils
 $$\begin{eqnarray}\displaystyle \text{div}\boldsymbol{v}=0. & & \displaystyle\end{eqnarray}$$
It evolves according to the linear momentum equation
 $$\begin{eqnarray}\displaystyle \unicode[STIX]{x1D70C}[\unicode[STIX]{x2202}_{t}\boldsymbol{v}+(\unicode[STIX]{x1D735}\boldsymbol{v})\boldsymbol{\cdot }\boldsymbol{v}]=-\unicode[STIX]{x1D735}p+\boldsymbol{d}\boldsymbol{i}\boldsymbol{v}(\unicode[STIX]{x1D64F}), & & \displaystyle\end{eqnarray}$$
with
 $\unicode[STIX]{x1D70C}$
the fluid density,
 $p$
a generalized pressure, which includes the effect of the gravity force,
 $\unicode[STIX]{x1D64F}$
the viscous stress tensor. This tensor
 $$\begin{eqnarray}\displaystyle \unicode[STIX]{x1D64F}=\unicode[STIX]{x1D702}\,\unicode[STIX]{x1D63F}, & & \displaystyle\end{eqnarray}$$
with
 $\unicode[STIX]{x1D702}$
the dynamic viscosity and
 $$\begin{eqnarray}\displaystyle \unicode[STIX]{x1D63F}=\unicode[STIX]{x1D735}\boldsymbol{v}+(\unicode[STIX]{x1D735}\boldsymbol{v})^{\text{T}} & & \displaystyle\end{eqnarray}$$
the rate-of-strain tensor. The second invariant of this tensor,
 $$\begin{eqnarray}\displaystyle \unicode[STIX]{x1D6E4}_{2}={\textstyle \frac{1}{2}}\unicode[STIX]{x1D63F}\boldsymbol{ : }\unicode[STIX]{x1D63F}={\textstyle \frac{1}{2}}\unicode[STIX]{x1D60B}_{ij}\unicode[STIX]{x1D60B}_{ij}, & & \displaystyle\end{eqnarray}$$
the ‘rate-of-strain intensity’, equals the square of the shear rate
 $\dot{\unicode[STIX]{x1D6FE}}$
in viscometric flows. The Carreau’s law reads
 $$\begin{eqnarray}\displaystyle \unicode[STIX]{x1D702}=\unicode[STIX]{x1D702}(\unicode[STIX]{x1D6E4}_{2})=\unicode[STIX]{x1D702}_{\infty }+(\unicode[STIX]{x1D702}_{0}-\unicode[STIX]{x1D702}_{\infty })(1+\unicode[STIX]{x1D706}_{C}^{2}\unicode[STIX]{x1D6E4}_{2})^{(n_{C}-1)/2}. & & \displaystyle\end{eqnarray}$$
The corresponding flow curves are usually presented as log–log graphs of
 $\unicode[STIX]{x1D702}$
versus
 $\dot{\unicode[STIX]{x1D6FE}}=\sqrt{\unicode[STIX]{x1D6E4}_{2}}$
(figure 1
 $a$
, see also the figure 14 of Draad et al.
Reference Draad, Kuiken and Nieuwstadt1998). They present three regions:
-
(i) at low shear rate
 $\dot{\unicode[STIX]{x1D6FE}}<\unicode[STIX]{x1D706}_{C}^{-1}$
a plateau with the ‘Newtonian viscosity’
$\unicode[STIX]{x1D702}_{0}$
;
-
(ii) at intermediate shear rate, a region where the viscosity decreases with
$\dot{\unicode[STIX]{x1D6FE}}$
, i.e. the shear-thinning effects occur; -
(iii) at large shear rate
$\dot{\unicode[STIX]{x1D6FE}}\gg \unicode[STIX]{x1D706}_{C}^{-1}$
, a plateau with the infinite-shear-rate viscosity
$\unicode[STIX]{x1D702}_{\infty }$
.


For fluids that are not close to the Newtonian limit, for instance rather concentrated polymer solutions, the viscosity
 $\unicode[STIX]{x1D702}_{\infty }$
is significantly smaller than
 $\unicode[STIX]{x1D702}_{0}$
(Bird et al.
Reference Bird, Armstrong and Hassager1987). For instance, the flow curves of figure 1 corresponds to
 $\unicode[STIX]{x1D702}_{0}=1130\unicode[STIX]{x1D702}_{\infty }$
; the four flow curves of the figure 14 of Draad et al. (Reference Draad, Kuiken and Nieuwstadt1998) correspond to a value of
 $\unicode[STIX]{x1D702}_{0}$
which is, at least, 8 times
 $\unicode[STIX]{x1D702}_{\infty }$
. Since our interest is to focus on strongly non-Newtonian fluids, we will always assume that
 $$\begin{eqnarray}\displaystyle \unicode[STIX]{x1D702}_{\infty }=0, & & \displaystyle\end{eqnarray}$$
which leaves only three dimensional rheological parameters:
 $\unicode[STIX]{x1D702}_{0},~\unicode[STIX]{x1D706}_{C}$
and
 $n_{C}$
. The zero-shear-rate viscosity
 $\unicode[STIX]{x1D702}_{0}$
is typically of the order of, at least,
 $100$
times the viscosity of water. The characteristic time of the fluid
 $\unicode[STIX]{x1D706}_{C}$
is typically of the order of seconds or tens of seconds. The shear-thinning index
 $n_{C}$
varies in the range
 $]0,1[$
, depending on the fluid. The limit value
 $n_{C}=1$
corresponds to a Newtonian fluid. The smaller
 $n_{C}$
, the stronger the shear-thinning effects. Since
 $n_{C}\in ]0,1[$
, the shear stress in viscometric flows
 $$\begin{eqnarray}\displaystyle \unicode[STIX]{x1D70F}=\unicode[STIX]{x1D70F}(\dot{\unicode[STIX]{x1D6FE}})=\unicode[STIX]{x1D702}(\dot{\unicode[STIX]{x1D6FE}}^{2})\,\dot{\unicode[STIX]{x1D6FE}} & & \displaystyle\end{eqnarray}$$
is an increasing bijective function of the shear rate
 $\dot{\unicode[STIX]{x1D6FE}}$
(figure 1
b), whereas the viscosity
 $\unicode[STIX]{x1D702}$
can be considered as a decreasing bijective function of
 $\dot{\unicode[STIX]{x1D6FE}}$
. Consequently, in viscometric flows, one can define bijective functions
 $\dot{\unicode[STIX]{x1D6FE}}=\dot{\unicode[STIX]{x1D6FE}}_{v}(\unicode[STIX]{x1D70F})$
and
 $$\begin{eqnarray}\displaystyle \unicode[STIX]{x1D702}=\unicode[STIX]{x1D702}_{v}(\unicode[STIX]{x1D70F})=\unicode[STIX]{x1D702}[\dot{\unicode[STIX]{x1D6FE}}_{v}^{2}(\unicode[STIX]{x1D70F})]. & & \displaystyle\end{eqnarray}$$
2.2 Driving pressure gradient – laminar or wave flow fields
The flows are driven by a uniform pressure gradient
 $G_{0}$
in the axial direction, i.e.
 $$\begin{eqnarray}\displaystyle p=p_{0}-G_{0}z+\widetilde{p}, & & \displaystyle\end{eqnarray}$$
where, for the laminar flows,
 $\widetilde{p}$
vanishes, whereas, for the wave flows,
 $$\begin{eqnarray}\displaystyle \widetilde{p}=\mathop{\sum }_{l=-L}^{L}\mathop{\sum }_{m=-M}^{M}p_{lm}(r)\exp \{\text{i}[mm_{0}\unicode[STIX]{x1D703}+lq(z-ct)]\}. & & \displaystyle\end{eqnarray}$$
In this spectral development,
 $L$
and
 $M$
are the order of truncations of the Fourier series in
 $z-ct$
and
 $\unicode[STIX]{x1D703}$
, which are always finite in practical computations. Accordingly, the velocity field
 $$\begin{eqnarray}\displaystyle \boldsymbol{v}=u\boldsymbol{e}_{r}+v\boldsymbol{e}_{\unicode[STIX]{x1D703}}+(W_{b}+w)\boldsymbol{e}_{z}, & & \displaystyle\end{eqnarray}$$
with
 $W_{b}=W_{b}(r)$
the axial velocity of the laminar base flow,
 $u,v$
and
 $w$
the wave fields, which are all written as spectral expansions of the form (2.11).
2.3 Wall shear stress and wall viscosity
A global momentum balance in laminar or wave flows, in a fluid domain of length
 $L_{z}$
in the axial direction (see (1.5)), shows a balance between the mean wall shear stress
 $\unicode[STIX]{x1D70F}_{w}=-\langle T_{rz}(r=a,\unicode[STIX]{x1D703},z)\rangle _{\unicode[STIX]{x1D703}z}$
, averaged with respect to
 $\unicode[STIX]{x1D703}$
and
 $z$
, as denoted by the angular brackets, and the pressure difference between the inlet and outlet of the domain:
 $$\begin{eqnarray}\displaystyle \unicode[STIX]{x1D70F}_{w}=G_{0}a/2. & & \displaystyle\end{eqnarray}$$
One defines the dynamic wall viscosity as
 $$\begin{eqnarray}\displaystyle \unicode[STIX]{x1D702}_{w}=\unicode[STIX]{x1D702}_{v}(\unicode[STIX]{x1D70F}_{w})=\unicode[STIX]{x1D702}_{v}(G_{0}a/2), & & \displaystyle\end{eqnarray}$$
using the viscometric function (2.9). In the case of the laminar base flow, which is indeed viscometric,
 $\unicode[STIX]{x1D702}_{w}$
is the value of the viscosity at the wall. In the case of a wave flow, which is not viscometric, our numerical results (figures 14
e–g) will confirm that the viscosity (2.14) is also the average value of the viscosity at the wall,
 $$\begin{eqnarray}\displaystyle \unicode[STIX]{x1D702}_{w}=\langle \unicode[STIX]{x1D702}(r=a,\unicode[STIX]{x1D703},z)\rangle _{\unicode[STIX]{x1D703}z}, & & \displaystyle\end{eqnarray}$$
a result which was already suggested in Roland et al. (Reference Roland, Plaut and Nouar2010). The definition (2.14) is also used by experimentalists to define the wall viscosity in transitional or turbulent flows, from a measure of the pressure drop in a long pipe. Of course the kinematic wall viscosity
 $$\begin{eqnarray}\displaystyle \unicode[STIX]{x1D708}_{w}=\unicode[STIX]{x1D702}_{w}/\unicode[STIX]{x1D70C}. & & \displaystyle\end{eqnarray}$$
2.4 Dimensionless model
Using the centreline velocity
 $W_{0}$
of the laminar flow as the velocity scale, the radius
 $a$
of the pipe as the length scale, the advection time
 $t_{0}=a/W_{0}$
as the time scale, the zero-shear-rate viscosity
 $\unicode[STIX]{x1D702}_{0}$
as the dynamic viscosity scale, the product
 $\unicode[STIX]{x1D70C}W_{0}^{2}$
as the pressure and stress scale, we introduce two dimensionless parameters. The primary Reynolds number
 $$\begin{eqnarray}\displaystyle \mathit{Re}_{0}=W_{0}\,a/\unicode[STIX]{x1D708}_{0}, & & \displaystyle\end{eqnarray}$$
with
 $\unicode[STIX]{x1D708}_{0}=\unicode[STIX]{x1D702}_{0}/\unicode[STIX]{x1D70C}$
the zero-shear-rate kinematic viscosity, and the main non-Newtonian parameter
 $$\begin{eqnarray}\displaystyle \unicode[STIX]{x1D706}=\unicode[STIX]{x1D706}_{C}/t_{0}=\unicode[STIX]{x1D706}_{C}W_{0}/a. & & \displaystyle\end{eqnarray}$$
Other ‘secondary’ Reynolds numbers are defined in table 1.
From now on, all quantities are dimensionless, except
 $a,~G_{0},~W_{0},~\unicode[STIX]{x1D706}_{C},~\unicode[STIX]{x1D70C},~\unicode[STIX]{x1D702}_{0}$
and
 $\unicode[STIX]{x1D708}_{0}$
. The parameter
 $\unicode[STIX]{x1D706}$
appears in the dimensionless viscosity
 $$\begin{eqnarray}\displaystyle \unicode[STIX]{x1D702}=(1+\unicode[STIX]{x1D706}^{2}\unicode[STIX]{x1D6E4}_{2})^{(n_{C}-1)/2}. & & \displaystyle\end{eqnarray}$$
The primary Reynolds number appears in the dimensionless viscous stress tensor
 $$\begin{eqnarray}\displaystyle \unicode[STIX]{x1D64F}=\mathit{Re}_{0}^{-1}\,\unicode[STIX]{x1D702}\,\unicode[STIX]{x1D63F}. & & \displaystyle\end{eqnarray}$$
The dimensionless form of (2.2) is
 $$\begin{eqnarray}\displaystyle \unicode[STIX]{x2202}_{t}\boldsymbol{v}+(\unicode[STIX]{x1D735}\boldsymbol{v})\boldsymbol{\cdot }\boldsymbol{v}=-\unicode[STIX]{x1D735}p+\boldsymbol{d}\boldsymbol{i}\boldsymbol{v}(\unicode[STIX]{x1D64F}), & & \displaystyle\end{eqnarray}$$
where the pressure is of the form
 $$\begin{eqnarray}\displaystyle p=p_{0}-Gz+\widetilde{p}, & & \displaystyle\end{eqnarray}$$
with
 $G=G_{0}a/(\unicode[STIX]{x1D70C}W_{0}^{2})$
, see § 2.2.
Reynolds numbers. The reference laminar flow is the laminar flow at the same mean axial pressure gradient
 $G_{0}$
.

2.5 Power-law limit
The facts that the main non-Newtonian parameter
 $$\begin{eqnarray}\displaystyle \unicode[STIX]{x1D706}=\mathit{Re}_{0}\,\unicode[STIX]{x1D706}_{C}\unicode[STIX]{x1D708}_{0}/a^{2}, & & \displaystyle\end{eqnarray}$$
and that, at the wave onset,
 $\mathit{Re}_{0}$
is of the order of
 $10^{3}$
, suggest typical values
 $$\begin{eqnarray}\displaystyle \unicode[STIX]{x1D706}\simeq 10^{3}~1~\text{s}~500~10^{-6}~\text{m}^{2}/\text{s}/(1~\text{cm})^{2}\simeq 5000 & & \displaystyle\end{eqnarray}$$
for a pipe of diameter 2 cm. The limit
 $\unicode[STIX]{x1D706}\rightarrow +\infty$
is therefore relevant for the study of the wave onset. In this limit, as soon as
 $\unicode[STIX]{x1D6E4}_{2}>0$
, one recovers the rheological power law
 $$\begin{eqnarray}\displaystyle \unicode[STIX]{x1D702}\simeq \unicode[STIX]{x1D702}_{pl}=\unicode[STIX]{x1D706}^{n_{C}-1}\,\unicode[STIX]{x1D6E4}_{2}^{(n_{C}-1)/2}. & & \displaystyle\end{eqnarray}$$
3 Laminar base flows
3.1 General case
The laminar base flows correspond to
 $p=p_{b}=p_{0}-Gz$
and
 $\boldsymbol{v}=W_{b}(r)\boldsymbol{e}_{z}$
. This yields
 $\unicode[STIX]{x1D6E4}_{2}=(W_{b}^{\prime }(r))^{2}$
and the viscosity
 $$\begin{eqnarray}\displaystyle \unicode[STIX]{x1D702}=\unicode[STIX]{x1D702}_{b}=[1+\unicode[STIX]{x1D706}^{2}(W_{b}^{\prime }(r))^{2}]^{(n_{C}-1)/2}. & & \displaystyle\end{eqnarray}$$
The equation (2.21) therefore gives the ordinary differential equation
 $$\begin{eqnarray}\displaystyle \unicode[STIX]{x1D6FC}:=\mathit{Re}_{0}\,G=-\frac{1}{r}\frac{\text{d}}{\text{d}r}[r\,\unicode[STIX]{x1D702}_{b}\,W_{b}^{\prime }(r)]. & & \displaystyle\end{eqnarray}$$
The boundary condition dictated by the choice of the velocity unit,
 $$\begin{eqnarray}\displaystyle W_{b}(0)=1, & & \displaystyle\end{eqnarray}$$
and the no-slip condition at the pipe wall,
 $$\begin{eqnarray}\displaystyle W_{b}(1)=0, & & \displaystyle\end{eqnarray}$$
can be fulfilled only if
 $\unicode[STIX]{x1D6FC}$
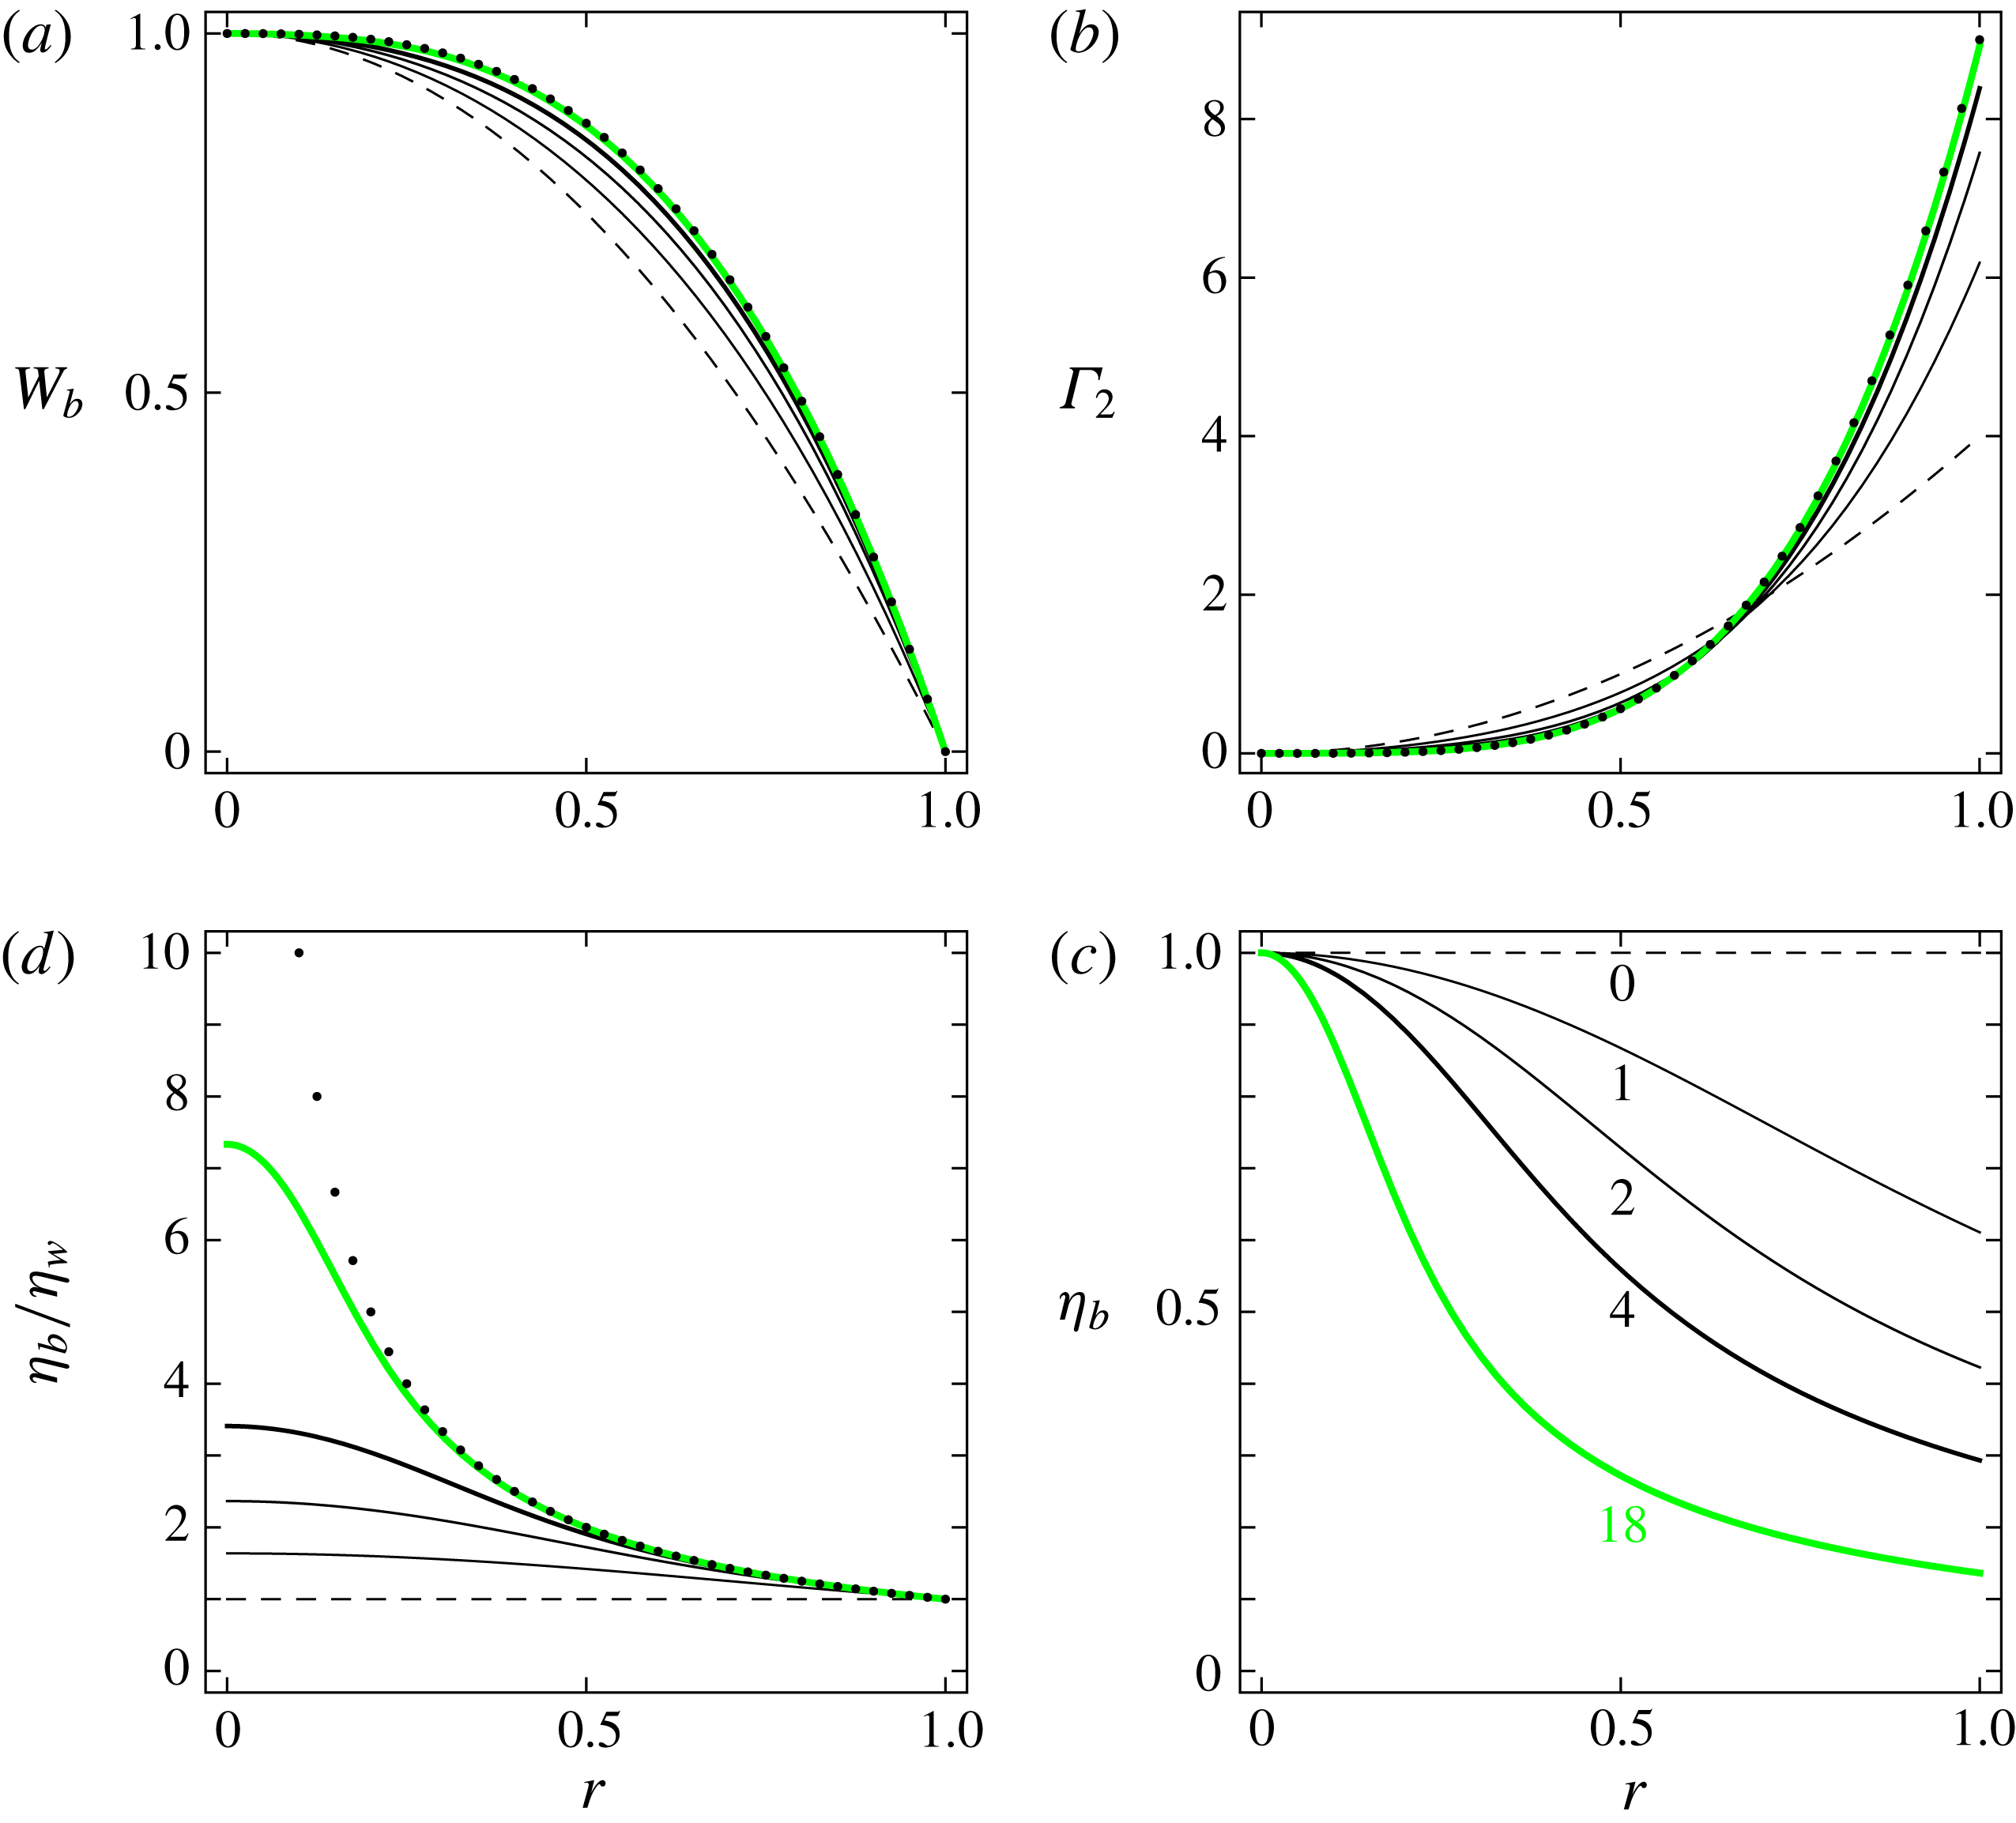
assumes a particular value. This nonlinear boundary value problem is solved numerically. Typical results are shown in figure 2(a), which demonstrates that the flow profile depends on
 $\unicode[STIX]{x1D706}$
. Of course, it depends also on
 $n_{C}$
; for a direct study of the influence of
 $n_{C}$
at finite
 $\unicode[STIX]{x1D706}$
(tendencies will be given in the next subsection in the case
 $\unicode[STIX]{x1D706}\rightarrow +\infty$
), refer to López Carranza et al. (Reference López Carranza, Jenny and Nouar2012). When
 $\unicode[STIX]{x1D706}$
increases, the shear-thinning effects are more pronounced, and the flow departs more strongly from the Newtonian limit, the Hagen–Poiseuille flow. The rate of strain increases near the pipe wall (figure 2
b) and therefore the viscosity drops in this region (figure 2
c). Its value at the pipe wall, the wall viscosity
 $$\begin{eqnarray}\displaystyle \unicode[STIX]{x1D702}_{w}=\unicode[STIX]{x1D702}_{b}(r=1) & & \displaystyle\end{eqnarray}$$
will play an important role, as already advocated in § 2.3. Before discussing this, let us consider the power-law limit.
Properties of the laminar base flows for
 $n_{C}=0.5$
and different values of
 $\unicode[STIX]{x1D706}$
as indicated below each curve of (c). (a) Axial velocity. (b) Rate-of-strain intensity. (c) Viscosity. (d) Ratio of the viscosity to the wall viscosity. In (a,b,d) the dots show the case of a power-law fluid, equations (3.7) and (3.11).
3.2 Power-law limit
If one replaces (3.1) by the power law
 $$\begin{eqnarray}\displaystyle \unicode[STIX]{x1D702}=\unicode[STIX]{x1D702}_{bpl}=\unicode[STIX]{x1D706}^{n_{C}-1}\,|W_{b}^{\prime }(r)|^{n_{C}-1}, & & \displaystyle\end{eqnarray}$$
the boundary value problem (3.2)–(3.4) can be solved analytically. The solution reads
 $$\begin{eqnarray}\displaystyle W_{bpl}(r)=1-r^{1+1/n_{C}},\quad W_{bpl}^{\prime }(r)=-(1+1/n_{C})\,r^{1/n_{C}}. & & \displaystyle\end{eqnarray}$$
The first equation denotes a velocity profile that becomes quite flat as
 $n_{C}\rightarrow 0^{+}$
, as shown, also, by the expression of the corresponding bulk velocity
 $$\begin{eqnarray}\displaystyle \overline{W}_{bpl}=[1+2/(1+3n_{C})]/3, & & \displaystyle\end{eqnarray}$$
which attains the maximum value of 1 for
 $n_{C}=0$
. Figures 2 and 3(a) show that the ‘power-law’ limit (3.7), (3.8) is attained as soon as
 $\unicode[STIX]{x1D706}\gtrsim 18$
for the typical value
 $n_{C}=0.5$
. Whereas its velocity profile (3.7a
) does not depend on
 $\unicode[STIX]{x1D706}$
, the viscosity profile of a power-law fluid,
 $$\begin{eqnarray}\displaystyle \unicode[STIX]{x1D702}_{bpl}=\unicode[STIX]{x1D706}^{n_{C}-1}\,(1+1/n_{C})^{n_{C}-1}\,r^{1-1/n_{C}}, & & \displaystyle\end{eqnarray}$$
does depend on
 $\unicode[STIX]{x1D706}$
. Since
 $n_{C}\in ]0,1[$
,
 $\unicode[STIX]{x1D702}_{bpl}\rightarrow +\infty$
as
 $r\rightarrow 0^{+}$
, where the rate of strain vanishes: this singularity is a well-known shortcoming of the power-law model. The wall viscosity of a power-law fluid,
 $$\begin{eqnarray}\displaystyle \unicode[STIX]{x1D702}_{wpl}=\unicode[STIX]{x1D702}_{bpl}(r=1)=\unicode[STIX]{x1D706}^{n_{C}-1}\,(1+1/n_{C})^{n_{C}-1}, & & \displaystyle\end{eqnarray}$$
can be used to define a viscosity ratio that is independent of
 $\unicode[STIX]{x1D706}$
,
 $$\begin{eqnarray}\displaystyle \unicode[STIX]{x1D702}_{bpl}/\unicode[STIX]{x1D702}_{wpl}=r^{1-1/n_{C}}. & & \displaystyle\end{eqnarray}$$
Figure 2(d) shows how the Carreau fluids approach this limit, as
 $\unicode[STIX]{x1D706}$
increases, not too close of the pipe axis.
For
 $n_{C}=0.5$
. (a) ●, Bulk velocity of the base flows; full line, power-law fluid bulk velocity of the base flows. (b) ●, Wall viscosity of the base flows; full line, power-law fluid wall viscosity of the base flows; ▪, bulk average mean viscosity of the base flows; dashed line, power-law fluid mean viscosity of the base flows; ▾, bulk average mean viscosity of the critical waves discussed in § 5.3.

3.3 Wall viscosity and mean viscosity
Figure 2(b) shows that, as soon as
 $\unicode[STIX]{x1D706}\gtrsim 4$
, the rate of strain at the wall approaches closely the rate of strain at the wall in the laminar flow of a power-law fluid. Consequently, the wall viscosity
 $\unicode[STIX]{x1D702}_{w}\simeq \unicode[STIX]{x1D702}_{wpl}$
. This is confirmed by figure 3(b).
Though the wall viscosity is a priori relevant, because it can be easily measured experimentally, from a theoretical point of view one may look at another viscosity that could be equally, or even more relevant, that is, the bulk average mean viscosity
 $\overline{\unicode[STIX]{x1D702}}_{b}$
. Its values, displayed in figure 3(b), are higher than the ones of the wall viscosity, since in the bulk the rate of strain is lower than at the wall (figure 2
b), hence, the viscosity is higher (figure 2
c,d). The power law for the viscosity (2.25) overestimates the viscosity in the bulk (figure 2
d). Hence the bulk average mean viscosity in laminar base flows of power-law fluids
 $$\begin{eqnarray}\displaystyle \overline{\unicode[STIX]{x1D702}}_{bpl}=\frac{2}{3}\frac{n_{C}}{n_{C}-1/3}\unicode[STIX]{x1D702}_{wpl}=\frac{2}{3}\unicode[STIX]{x1D706}^{n_{C}-1}\frac{n_{C}(1+1/n_{C})^{n_{C}-1}}{n_{C}-1/3} & & \displaystyle\end{eqnarray}$$
overestimates
 $\overline{\unicode[STIX]{x1D702}}_{b}$
, as shown in figure 3(b). The viscosity
 $\overline{\unicode[STIX]{x1D702}}_{bpl}$
cannot be defined for strongly shear-thinning fluids with
 $n_{C}\in ]0,1/3]$
. In such cases, the viscosity (3.9) diverges too rapidly as
 $r\rightarrow 0^{+}$
. We will not address such cases in this work, which will be restricted to shear-thinning fluids with
 $n_{C}\gtrsim 0.4$
.
4 Pressure gradient and friction factor in laminar and wave flows
In both laminar and wave flows, the Darcy friction factor
 $f$
is defined by the equation for the dimensional pressure gradient
 $$\begin{eqnarray}\displaystyle G_{0}=f\,\unicode[STIX]{x1D70C}\,W_{0}^{2}\,\overline{W}^{2}/(4a), & & \displaystyle\end{eqnarray}$$
where the dimensional centreline velocity
 $W_{0}$
appears because the mean velocity
 $\overline{W}$
is dimensionless. In terms of the dimensionless pressure gradient
 $G$
and of the parameter
 $\unicode[STIX]{x1D6FC}$
defined in (3.2),
 $$\begin{eqnarray}\displaystyle f=4G/\overline{W}^{2}=4\unicode[STIX]{x1D6FC}/(\mathit{Re}_{0}\,\overline{W}^{2}). & & \displaystyle\end{eqnarray}$$
Introducing the wall-viscosity Reynolds number (1.8), which is related to the centreline velocity Reynolds number through the relation
 $$\begin{eqnarray}\displaystyle \mathit{Re}_{w}=2\mathit{Re}_{0}\,\overline{W}/\unicode[STIX]{x1D702}_{w}, & & \displaystyle\end{eqnarray}$$
we obtain
 $$\begin{eqnarray}\displaystyle f\,\mathit{Re}_{w}=8\unicode[STIX]{x1D6FC}/(\overline{W}\,\unicode[STIX]{x1D702}_{w}). & & \displaystyle\end{eqnarray}$$
For
 $n_{C}=0.5$
. (a) ●, Parameter
 $\unicode[STIX]{x1D6FC}$
defining the pressure gradient in the base flows, see (3.2). (b) ●, Scaled friction factor of the base flows. Full lines, power-law fluid case.

4.1 Laminar flows
In the Newtonian case,
 $\unicode[STIX]{x1D6FC}=4$
,
 $\overline{W}=\overline{W}_{b}=1/2$
and
 $\unicode[STIX]{x1D702}_{w}=1$
give the well-known relation
 $$\begin{eqnarray}\displaystyle f\,\mathit{Re}=64. & & \displaystyle\end{eqnarray}$$
In the non-Newtonian case, figure 3(a) has already shown that, as
 $\unicode[STIX]{x1D706}$
increases,
 $\overline{W}_{b}$
approaches rapidly the value
 $\overline{W}_{bpl}$
given by (3.8) for a power-law fluid. Figure 4(a) shows that
 $\unicode[STIX]{x1D6FC}$
also approaches the value
 $$\begin{eqnarray}\displaystyle \unicode[STIX]{x1D6FC}_{pl}=2\,\unicode[STIX]{x1D706}^{n_{C}-1}(1+1/n_{C})^{n_{C}} & & \displaystyle\end{eqnarray}$$
corresponding to the power-law fluid. Hence, the product
 $f\,\mathit{Re}_{w}$
approaches the power-law fluid value
 $$\begin{eqnarray}\displaystyle f_{bpl}\,\mathit{Re}_{w}=16(3+1/n_{C}), & & \displaystyle\end{eqnarray}$$
as displayed in figure 4(b). The Newtonian case (4.5) is recovered when
 $n_{C}=1$
. Also, when
 $n_{C}$
decreases, the product
 $f_{bpl}\,\mathit{Re}_{w}$
increases, which indicates a larger friction in more shear-thinning fluids.
4.2 Travelling waves
The waves that will be described in § 5 correspond to sustained perturbations of a given laminar base flow at fixed
 $n_{C}$
and
 $\unicode[STIX]{x1D706}$
, fixed pressure gradient. The parameter
 $\unicode[STIX]{x1D6FC}$
and the wall viscosity are the ones of the laminar base flow. On the contrary, the mean velocity
 $\overline{W}$
is smaller in wave flows than in base flows (§ 5.3.1): this results in a decrease of
 $\mathit{Re}_{w}$
and an increase of
 $f\mathit{Re}_{w}$
, which signifies an increase of the drag. A further study, where the wave flows are compared to the laminar flows with the same bulk velocity, and the pressure gradient growth is directly quantified, is presented in § 6.
For
 $n_{C}=0.5$
,
 $\unicode[STIX]{x1D706}=1$
. Onset curves of the saddle-node bifurcations Reynolds numbers
 $\mathit{Re}(q;n_{C},\unicode[STIX]{x1D706})$
(left ordinate axis) and
 $\mathit{Re}_{w}(q;n_{C},\unicode[STIX]{x1D706})$
(right ordinate axis); dashed lines, critical wavenumber and Reynolds numbers;
 $\star$
, solution found by Roland et al. (Reference Roland, Plaut and Nouar2010).

5 Waves at constant pressure gradient
5.1 Principles of the computations of the waves and onset curves
The specific pseudospectral code used for the computations of the waves has been described and validated in Roland et al. (Reference Roland, Plaut and Nouar2010). It is pointed out that the shift-and-reflect symmetry (1.6) is fulfilled by construction, and that a phase condition is chosen, equation (46) of Roland et al. (Reference Roland, Plaut and Nouar2010). It fixes the azimuthal position of the rolls, as it will be visible in the figure 10. Computations are done at fixed rheological parameters
 $n_{C}$
and
 $\unicode[STIX]{x1D706}$
, fixed pressure gradient
 $G$
, i.e. fixed primary Reynolds number
 $\mathit{Re}_{0}$
and fixed axial wavenumber
 $q$
. Once a wave is obtained, its phase velocity
 $c$
, bulk velocity
 $\overline{W}$
, Reynolds numbers
 $\mathit{Re}$
,
 $\mathit{Re}_{w}$
, are output of the computations. Continuation is used to vary
 $n_{C}$
,
 $\unicode[STIX]{x1D706}$
, the Reynolds numbers or the axial wavenumber
 $q$
. The novelty here is a systematic study of the influence of
 $q$
on the EFKW waves
 $m_{0}=3$
that appear, through saddle-node bifurcations, at low
 $\mathit{Re}$
or
 $\mathit{Re}_{w}$
, whereas, in Roland et al. (Reference Roland, Plaut and Nouar2010), we used
 $q=q_{cN}=2.44$
. The Reynolds number of these saddle-node bifurcations are denoted
 $$\begin{eqnarray}\displaystyle \mathit{Re}(q;n_{C},\unicode[STIX]{x1D706})\quad \text{or}\quad \mathit{Re}_{w}(q;n_{C},\unicode[STIX]{x1D706}), & & \displaystyle\end{eqnarray}$$
which define ‘onset curves’, see figure 5. Since, for fixed rheological parameters
 $n_{C}$
and
 $\unicode[STIX]{x1D706}$
, the wall viscosity
 $\unicode[STIX]{x1D702}_{w}$
is uniquely determined as explained in § 2.3,
 $\unicode[STIX]{x1D702}_{w}=\unicode[STIX]{x1D702}_{w}(n_{C},\unicode[STIX]{x1D706})$
the viscosity at the wall in the laminar base flow, one has
 $$\begin{eqnarray}\displaystyle \mathit{Re}_{w}(q;n_{C},\unicode[STIX]{x1D706})=\mathit{Re}(q;n_{C},\unicode[STIX]{x1D706})/\unicode[STIX]{x1D702}_{w}(n_{C},\unicode[STIX]{x1D706}). & & \displaystyle\end{eqnarray}$$
Therefore the waves that appear at low
 $\mathit{Re}_{w}$
are identical to the ones that appear at low
 $\mathit{Re}$
. The focus is on these waves, that we follow with continuation methods, starting from the Newtonian EFKW waves,
 $\unicode[STIX]{x1D706}=0$
, and progressively increasing
 $\unicode[STIX]{x1D706}$
at fixed
 $n_{C}$
. As compared with Roland et al. (Reference Roland, Plaut and Nouar2010), we have improved the determination of the saddle-node bifurcation points by fitting, close to the bifurcation point, curves of
 $\mathit{Re}$
versus
 $c$
, the phase velocity (curves like the ones visible in figure 6), and of
 $\mathit{Re}$
versus
 $\overline{W}$
, the bulk velocity, with polynomials of degree 2 in
 $\mathit{Re}$
, and extracting the minima of these polynomials. Also, the optimization of
 $q$
has led to lower values of the Reynolds numbers. Therefore, the computations have converged, as far as global quantities are concerned (
 $c,\overline{W},\ldots$
), for all values of
 $n_{C}$
and
 $\unicode[STIX]{x1D706}$
studied here,
 $0.5\leqslant n_{C}\leqslant 1$
,
 $0\leqslant \unicode[STIX]{x1D706}\leqslant 18$
, with truncation parameters
 $N_{r}=28$
,
 $M=10$
,
 $L=7$
with the notations of Roland et al. (Reference Roland, Plaut and Nouar2010). The number of spectral modes is therefore
 $N_{r}(2M+1)(2L+1)=8820$
. However, to obtain a good description of the velocity and viscosity fields in the whole pipe (e.g. for figure 14), higher numbers of modes have been used for the strongly shear-thinning fluids,
 $N_{r}\simeq 40$
,
 $M\simeq 12$
,
 $L\simeq 9$
.
For
 $n_{C}=0.5$
,
 $\unicode[STIX]{x1D706}=2$
. Black curves: three branches of wave solutions for
 $q=2.28$
: thick line, lower branch; thin continuous line, intermediate branch; thin dashed line, higher branch. Grey (green online) curve: lower branch of wave solutions for
 $q=2.32$
.

5.2 Onset curves – definition of the critical waves
For
 $n_{C}=0.5$
,
 $\unicode[STIX]{x1D706}=1$
, i.e. a weakly shear-thinning fluid, the onset curves obtained are shown in figure 5. The rightmost and upmost point in these curves corresponds to
 $q=q_{cN}$
,
 $\mathit{Re}_{w}(q_{cN};0.5,1)=2028$
, to be compared to the Newtonian value
 $\mathit{Re}_{w}(q_{cN};0.5,0)=1251$
, see (1.2). This indicates a strong stabilization of the EFKW waves, which was already evidenced in Roland et al. (Reference Roland, Plaut and Nouar2010). Importantly, when the wavenumber
 $q$
is decreased, the waves appear at lower values of the Reynolds numbers, until a ‘critical’ value
 $q_{c}$
of
 $q$
is attained,
 $q_{c}=q_{c}(n_{C},\unicode[STIX]{x1D706})$
, corresponding to ‘critical’ minimal values of the Reynolds numbers
 $\mathit{Re}_{c}(n_{C},\unicode[STIX]{x1D706})=\mathit{Re}(q_{c};n_{C},\unicode[STIX]{x1D706})$
;
 $\mathit{Re}_{wc}(n_{C},\unicode[STIX]{x1D706})=\mathit{Re}_{w}(q_{c};n_{C},\unicode[STIX]{x1D706})$
. When
 $q$
is further decreased, the Reynolds numbers increase. The critical parameters here are
 $$\begin{eqnarray}\displaystyle q_{c}(0.5,1)=2.23,\quad \mathit{Re}_{c}(0.5,1)=1120,\quad \mathit{Re}_{wc}(0.5,1)=1840. & & \displaystyle\end{eqnarray}$$
We name the corresponding wave solution the ‘critical’ wave solution.
In fact, several branches of solutions exist and are in competition. This was already shown by Wedin & Kerswell (Reference Wedin and Kerswell2004) in their figure 23, which displays, for
 $m_{0}=3,q=q_{cN}$
, three solution branches in the plane
 $(\mathit{Re},c)$
. We have also found multiple solution branches in the non-Newtonian cases. This is not shown in figure 5, where, quite probably, only the branch corresponding to the lowest Reynolds numbers (‘lower branch’ or ‘critical branch’) is displayed, but we now illustrate this issue by using a larger value of
 $\unicode[STIX]{x1D706}$
,
 $\unicode[STIX]{x1D706}=2$
.
For
 $n_{C}=0.5$
,
 $\unicode[STIX]{x1D706}=2$
, and an axial wavenumber
 $q=2.28$
, three branches of wave solutions are displayed in figure 6, which shows some similarities with the figure 23 of Wedin & Kerswell (Reference Wedin and Kerswell2004). The lower branch has been obtained by continuation from the branch corresponding to the critical point of figure 5. It is remarkable that this lower branch forms a closed loop, and that the corresponding solutions disappear in another saddle-node bifurcation at ‘large’ Reynolds numbers. The loop corresponding to this lower branch shrinks when
 $q$
increases, as shown in figure 6 for
 $q=2.32$
. When
 $q\simeq 2.33$
, this branch of solution disappears in a saddle-node bifurcation, with
 $q$
the bifurcation parameter. Therefore, the onset curves corresponding to this branch stop at
 $q\simeq 2.33$
, as displayed in figure 7. This branch is the ‘critical’ one; in figure 7 one can read the critical parameters
 $$\begin{eqnarray}\displaystyle q_{c}(0.5,2)=2.11,\quad \mathit{Re}_{c}(0.5,2)=973,\quad \mathit{Re}_{wc}(0.5,2)=2300. & & \displaystyle\end{eqnarray}$$
Other complicated bifurcation scenarii happen with the other branches. For instance, the solution branches computed by Roland et al. (Reference Roland, Plaut and Nouar2010) for
 $q=q_{cN}=2.44$
, which correspond to the stars in figures 5 and 7, are connected (respectively disconnected) to the critical wave at
 $\unicode[STIX]{x1D706}=1$
(respectively 2).
For
 $n_{C}=0.5$
,
 $\unicode[STIX]{x1D706}=2$
. Saddle-node bifurcations Reynolds numbers
 $\mathit{Re}$
(left ordinate axis) and
 $\mathit{Re}_{w}$
(right ordinate axis) where different wave branches as shown in figure 6 appear;
 $\star$
, solution found by Roland et al. (Reference Roland, Plaut and Nouar2010).

Instead of elucidating these complicated and bushy bifurcation scenarii, which would be a formidable task, we choose to focus hereafter on a family of waves that we can follow as smooth functions of the rheological parameters
 $n_{C}$
and
 $\unicode[STIX]{x1D706}$
, which corresponds to the ones of figure 5, to the lowest curve of figure 7, or to the curves of figure 8. We cannot prove that the waves of this family that minimize the Reynolds numbers are really ‘critical’ in that no global waves with the same symmetry properties exist at lower Reynolds numbers, for fixed
 $n_{C}$
and
 $\unicode[STIX]{x1D706}$
, but we nevertheless use this simple terminology.
For
 $n_{C}=0.5$
. Onset curves
 $\mathit{Re}_{w}(q,0.5,\unicode[STIX]{x1D706})$
for various values of
 $\unicode[STIX]{x1D706}$
, as indicated under the critical point of each curve;
 $\star$
, solutions found by Roland et al. (Reference Roland, Plaut and Nouar2010).

For
 $n_{C}=0.5$
. (
 $a$
) ●, Critical wavenumber; (
 $b$
) ●, critical phase velocity; ▪, critical bulk velocity. Curves, fits computed for
 $\unicode[STIX]{x1D706}\geqslant 6$
; dashed lines, asymptotic values.

Several onset curves, for
 $n_{C}=0.5$
and various values of
 $\unicode[STIX]{x1D706}$
, are displayed in figure 8, which clearly shows the continuity of this family of waves. The lowest curve, corresponding to
 $\unicode[STIX]{x1D706}=0$
, is indeed similar to the
 $C_{3}$
curve of the figure 2 of Faisst & Eckhardt (Reference Faisst and Eckhardt2003).
5.3 Critical parameters and waves – asymptotic power-law regime for
$n_{C}=0.5$

5.3.1 Critical wavenumber, phase and bulk velocity
One can already suspect from figure 8 that some properties of the critical waves, like their critical wavenumber
 $q_{c}$
or the critical Reynolds number
 $\mathit{Re}_{wc}$
, converge as
 $\unicode[STIX]{x1D706}\rightarrow +\infty$
. This is the case. For
 $n_{C}=0.5$
, the figure 9(a) shows that the critical wavenumber
 $q_{c}$
converges towards
 $$\begin{eqnarray}\displaystyle q_{cpl}(n_{C}=0.5)=1.98. & & \displaystyle\end{eqnarray}$$
This asymptotic value has been obtained by fitting the 5 values of
 $q_{c}(n_{C}=0.5,\unicode[STIX]{x1D706})$
for
 $\unicode[STIX]{x1D706}\geqslant 6$
to a function of the form
 $q_{cpl}+\unicode[STIX]{x1D6FD}\unicode[STIX]{x1D706}^{-1}$
, a fit that reproduces quite well the 7 numerical data for
 $\unicode[STIX]{x1D706}\geqslant 4$
. The variation of
 $q_{c}$
with respect to the Newtonian value (1.9),
 $q_{cN}=2.44$
in dimensionless units, is of the order of
 $-20\,\%$
, which is significant. It means a shift towards larger wavelengths.
Similarly, the figure 9(b) shows that the critical phase velocity
 $c_{c}$
and bulk velocity
 $\overline{W}_{\!c}$
converge, as
 $\unicode[STIX]{x1D706}\rightarrow +\infty$
, towards
 $$\begin{eqnarray}\displaystyle c_{cpl}(n_{C}=0.5)=0.487\quad \text{and}\quad \overline{W}_{cpl}(n_{C}=0.5)=0.414. & & \displaystyle\end{eqnarray}$$
These asymptotic values have been obtained with fits similar to the one used for (5.5). The variation of
 $c_{c}$
, with respect to the Newtonian value
 $c_{N}=0.491$
, is quite small, of the order of
 $-1\,\%$
. This indicates that, for this property, shear thinning does not play much of a role. The variation of
 $\overline{W}_{\!c}$
, with respect to the Newtonian value
 $\overline{W}_{\!cN}=0.384$
, is of the order of
 $+8\,\%$
. One should compare this variation and the one, of the order of
 $+20\,\%$
, of the bulk velocity of the laminar base flow (figure 3
a). In all cases, of course, the transition from the laminar flow to waves reduces the bulk velocity, as measured by the mass flux reduction factor
 $$\begin{eqnarray}\displaystyle \overline{W}_{cN}/\overline{W}_{bN}=0.768 & & \displaystyle\end{eqnarray}$$
in the Newtonian case,
 $\unicode[STIX]{x1D706}=0$
, versus
 $$\begin{eqnarray}\displaystyle \overline{W}_{cpl}(n_{C}=0.5)/\overline{W}_{bpl}(n_{C}=0.5)=0.690 & & \displaystyle\end{eqnarray}$$
in the large-
 $\unicode[STIX]{x1D706}$
non-Newtonian case.
5.3.2 Velocity field
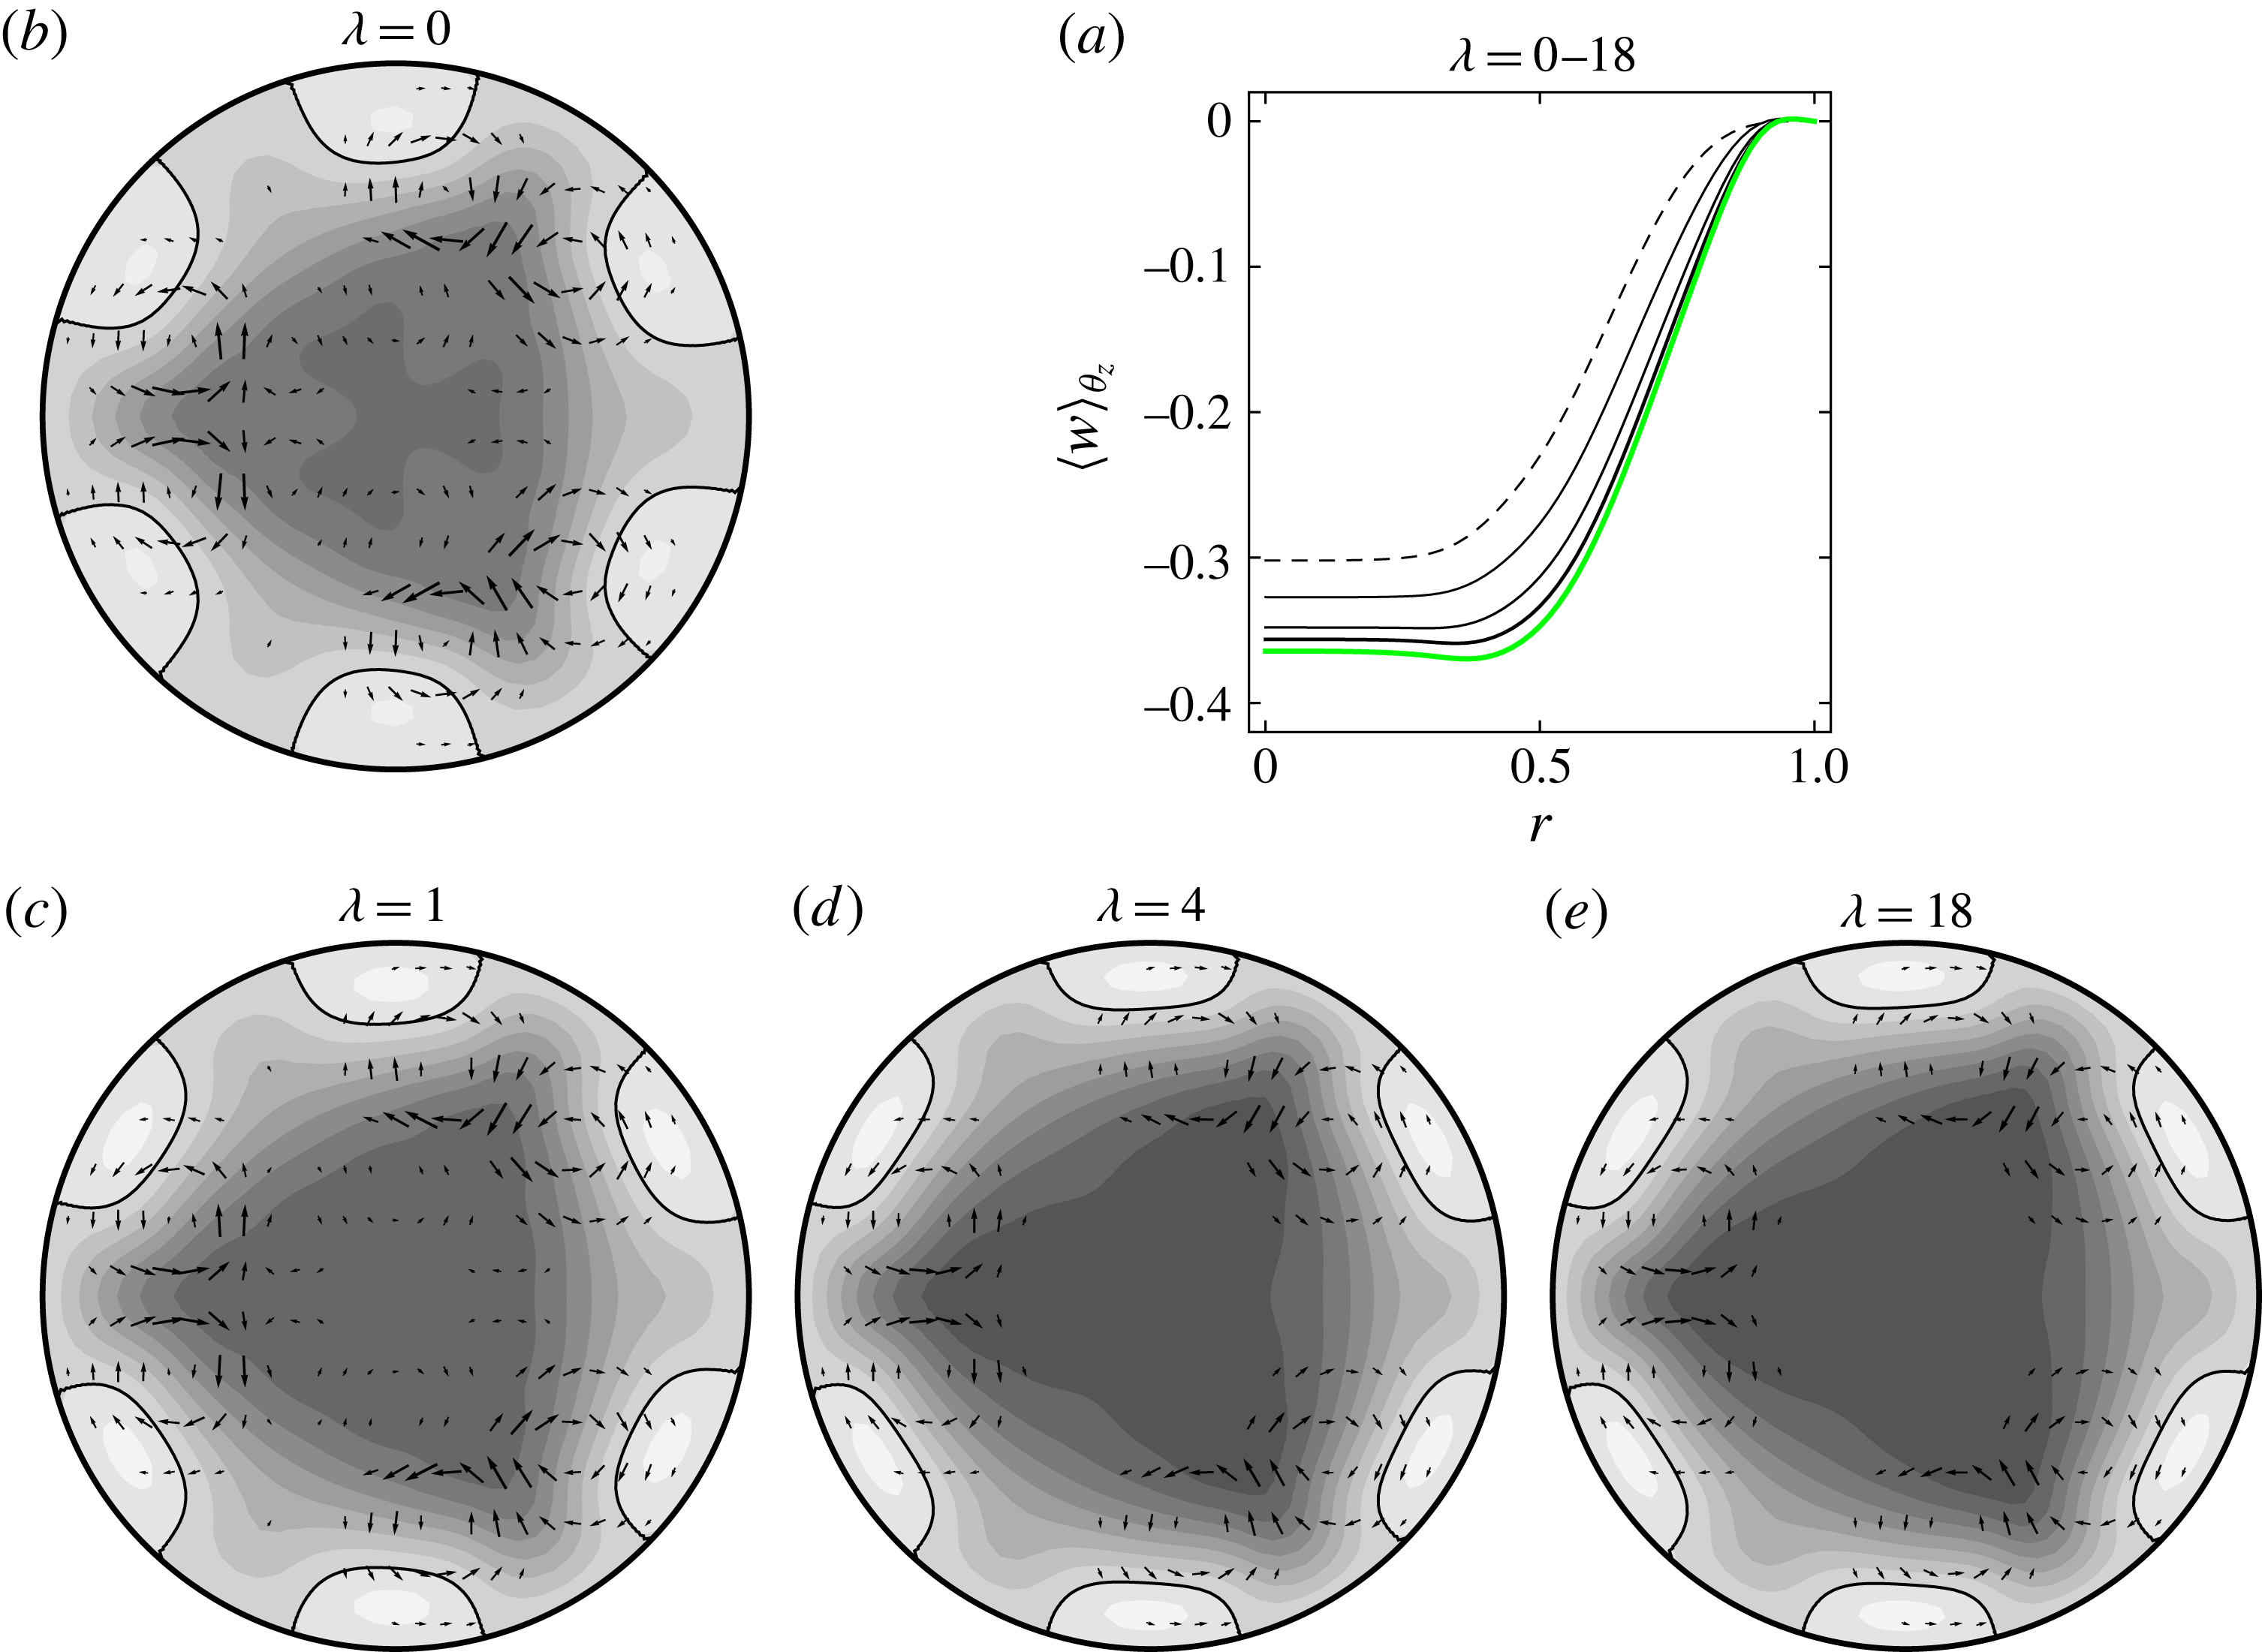
The velocity field of the waves converges to a limit as
 $\unicode[STIX]{x1D706}\rightarrow +\infty$
. This can be seen in the figures 10(a) and 11(a) for the radial profiles of axial velocity, with and without the base flow, averaged over
 $\unicode[STIX]{x1D703}$
and
 $z$
. Accordingly, the fields averaged over
 $z$
, in a pipe section, of the figures 10(b–e) and 11(b–e) converge to a precise pattern as
 $\unicode[STIX]{x1D706}\rightarrow +\infty$
. The asymptotic solution for
 $\unicode[STIX]{x1D706}\rightarrow +\infty$
may be viewed as the critical wave in a power-law fluid obeying to the rheological law (2.25), with
 $n_{C}=0.5$
. This solution, which corresponds approximately to the figure 11(e), displays even more clearly than the Newtonian solution of figure 11(b) three pairs of streamwise rolls and six attached fast streaks near the pipe wall. This observation and the continuity between all these waves proves that the self-sustaining process advocated in the introduction is at the origin of all these waves, even in the case of strongly shear-thinning fluids.
For
 $n_{C}=0.5$
. (a) Total axial velocity
 $v_{z}$
averaged over
 $\unicode[STIX]{x1D703}$
and
 $z$
of the critical wave for different values of
 $\unicode[STIX]{x1D706}$
as in figure 2: the curves ordered by decreasing centreline velocities correspond to
 $\unicode[STIX]{x1D706}=0,1,2,4,18$
. (b–e) Axial average of the velocity field of the critical wave for various values of
 $\unicode[STIX]{x1D706}$
as indicated. The grey levels show the values of
 $\langle v_{z}\rangle _{z}$
with 9 regularly spaced contours
 $v_{z}=0.07$
(dark) to
 $0.63$
(light). The arrows show on a Cartesian grid the transverse velocity vectors
 $\boldsymbol{v}_{\bot }=\langle u\rangle _{z}\boldsymbol{e}_{r}+\langle v\rangle _{z}\boldsymbol{e}_{\unicode[STIX]{x1D703}}$
whose norm
 $\Vert \boldsymbol{v}_{\bot }\Vert \geqslant 0.003$
. The scale of the arrows is the same on all graphs:
 $\max \Vert \boldsymbol{v}_{\bot }\Vert$
decreases as
 $\unicode[STIX]{x1D706}$
increases.

For
 $n_{C}=0.5$
. (a) Axial velocity
 $w=v_{z}-W_{b}$
averaged over
 $\unicode[STIX]{x1D703}$
and
 $z$
of the critical wave for different values of
 $\unicode[STIX]{x1D706}$
as in figure 10(a). (b–e) Axial average of the velocity field of the critical wave for various values of
 $\unicode[STIX]{x1D706}$
as indicated. The grey levels show the values of
 $\langle w\rangle _{z}$
with 9 regularly spaced contours
 $w=-0.35$
(dark) to
 $+0.05$
(light). The contour
 $w=0$
is shown with a black continuous line to evidence the fast streaks. The arrows show the transverse velocity vectors as in figure 10(b–e).
For
 $n_{C}=0.5$
, for various values of
 $\unicode[STIX]{x1D706}$
as indicated. (a–c) Root-mean-square axial velocity
 $w^{\prime }(r,\unicode[STIX]{x1D703})$
; continuous lines, 5 regularly spaced contours
 $w^{\prime }=0.025\overline{W}$
to
 $0.125\overline{W}$
; dark grey (respectively light grey), low (respectively high) values. (d–f)
 $\langle \unicode[STIX]{x1D6E4}_{2}\rangle _{z}$
; dashed line, first iso-contour
 $\unicode[STIX]{x1D6E4}_{2}=0.5$
; continuous lines, 10 regularly spaced contours
 $\unicode[STIX]{x1D6E4}_{2}=1.5$
(near the centre) to
 $15$
(near the pipe wall).

For
 $n_{C}=0.5$
, various values of
 $\unicode[STIX]{x1D706}$
, value and radial position of the maximum root-mean-square axial velocity.

In order to better characterize the critical waves, in a manner that corresponds to the experiments advocated in the introduction, the root-mean-square value of the axial velocity is computed,
 $$\begin{eqnarray}\displaystyle w^{\prime }(r,\unicode[STIX]{x1D703})=v_{z}^{\prime }(r,\unicode[STIX]{x1D703})=\sqrt{\langle [v_{z}(r,\unicode[STIX]{x1D703},z-ct)-\langle v_{z}(r,\unicode[STIX]{x1D703},z-ct)\rangle _{t}]^{2}\rangle _{t}}. & & \displaystyle\end{eqnarray}$$
This field, normalized with the mean speed
 $\overline{W}$
, is characterized in the table 2 and shown in the figure 12(a–c). It is in the region of the rolls visible in figures 10 and 11 that
 $w^{\prime }$
is large. This strong dynamics of the rolls was already noticeable in the figure 1 of Faisst & Eckhardt (Reference Faisst and Eckhardt2003), and is also visible on the movie included as online supplementary material available at https://doi.org/10.1017/jfm.2017.149. A further characterization of this dynamics is given by the figure 13
 $(a)$
, which displays profiles of
 $w(r,\unicode[STIX]{x1D703},z)$
at the place where
 $w^{\prime }$
is maximum for
 $n_{C}=0.5$
,
 $\unicode[STIX]{x1D706}=18$
, i.e.
 $r=0.59$
,
 $\unicode[STIX]{x1D703}=1.29$
. This figure confirms that the velocity field of the waves converges as
 $\unicode[STIX]{x1D706}\rightarrow +\infty$
.
For
 $n_{C}=0.5$
, for the critical waves corresponding to the values of
 $\unicode[STIX]{x1D706}$
indicated in (b). (a) Axial velocity
 $w=v_{z}-W_{b}$
at
 $r=0.59$
,
 $\unicode[STIX]{x1D703}=1.29$
. (b) Ratio of the viscosity averaged over
 $\unicode[STIX]{x1D703}$
and
 $z$
to the wall viscosity.

For
 $n_{C}=0.5$
and various values of
 $\unicode[STIX]{x1D706}$
as indicated. (a–d) Full line, invariant
 $\unicode[STIX]{x1D6E4}_{2}$
averaged over
 $\unicode[STIX]{x1D703}$
and
 $z$
of the critical wave; dashed line, invariant
 $\unicode[STIX]{x1D6E4}_{2}$
of the laminar flow, already displayed in figure 2(b). (e–g) Full line, viscosity
 $\unicode[STIX]{x1D702}$
averaged over
 $\unicode[STIX]{x1D703}$
and
 $z$
of the critical wave; dashed line, viscosity
 $\unicode[STIX]{x1D702}$
of the laminar flow, already displayed in figure 2(c). (h–k) Full line, product
 $\unicode[STIX]{x1D702}\unicode[STIX]{x1D6E4}_{2}$
averaged over
 $\unicode[STIX]{x1D703}$
and
 $z$
of the critical wave; dashed line, same product in the laminar flow.

(a) For
 $n_{C}=0.5$
.
 $\star$
, onset wall-viscosity Reynolds number
 $\mathit{Re}_{w}(q_{cN};n_{C},\unicode[STIX]{x1D706})$
found by Roland et al. (Reference Roland, Plaut and Nouar2010); ●, after optimization of the wavenumber
 $q$
, critical wall-viscosity Reynolds number
 $\mathit{Re}_{wc}(n_{C},\unicode[STIX]{x1D706})$
; ▾, critical mean-viscosity Reynolds number
 $\mathit{Re}_{mc}(n_{C},\unicode[STIX]{x1D706})$
; grey (red online) curve, fit (5.15); upper dashed line, asymptotic value (5.16); lower dashed line, critical value of the Newtonian case
 $\mathit{Re}_{cN}$
(1.2). (b) ●, For
 $n_{C}=0.6$
, ▪, for
 $n_{C}=0.7$
, critical wall-viscosity Reynolds number
 $\mathit{Re}_{wc}(n_{C},\unicode[STIX]{x1D706})$
; grey (red online) curves, fits (5.15), dashed lines, asymptotic values (5.19).

5.3.3 Rates of strain, viscosity and dissipation
A good understanding of all the properties of the waves, in the non-Newtonian case, requires a study of their viscosity field
 $\unicode[STIX]{x1D702}(r,\unicode[STIX]{x1D703},z)$
, which is itself a function of the field
 $\unicode[STIX]{x1D6E4}_{2}(r,\unicode[STIX]{x1D703},z)$
, the rate-of-strain intensity, defined in (2.5). This latter field multiplied by
 $\unicode[STIX]{x1D702}$
is the dissipated power per unit volume, which is physically meaningful for all fluids, Newtonian or not. In laminar or wave flows, the global kinetic energy balance is
 $$\begin{eqnarray}\displaystyle P_{diss}=\langle \unicode[STIX]{x1D702}\unicode[STIX]{x1D6E4}_{2}\rangle _{r\unicode[STIX]{x1D703}z}=\mathit{Re}_{0}\overline{W}G, & & \displaystyle\end{eqnarray}$$
i.e. the power dissipated by viscous effects is compensated by the power injected by pressure forces through the pressure gradient
 $G$
. Note that
 $P_{diss}$
is the averaged dissipated power by unit volume, rendered dimensionless by division by
 $\unicode[STIX]{x1D702}_{0}(W_{0}/a)^{2}$
with the notations of § 2.4. The relation (3.2) yields
 $$\begin{eqnarray}\displaystyle P_{diss}=\langle \unicode[STIX]{x1D702}\unicode[STIX]{x1D6E4}_{2}\rangle _{r\unicode[STIX]{x1D703}z}=\unicode[STIX]{x1D6FC}\overline{W}, & & \displaystyle\end{eqnarray}$$
where it is recalled that
 $\unicode[STIX]{x1D6FC}=4$
in Newtonian fluids,
 $\unicode[STIX]{x1D6FC}$
is smaller in non-Newtonian fluids (see § 4 and figure 4
a). The field
 $\unicode[STIX]{x1D6E4}_{2}$
axially averaged is shown in figure 12(d–f) for
 $n_{C}=0.5$
and three particular waves. Generally,
 $\unicode[STIX]{x1D6E4}_{2}$
vanishes, for symmetry reasons, at the pipe axis, and increases near the pipe wall, as already displayed in figure 2(b) for the laminar base flows. In wave flows, the highest rate of strain is localized near the fast streaks (compare figures 11
e and 12
f), where large velocity gradients are induced by the near-wall roll flows and the streak flows themselves. Obviously, the field
 $\unicode[STIX]{x1D6E4}_{2}$
in the critical waves converges to a well-defined limit as
 $\unicode[STIX]{x1D706}\rightarrow +\infty$
, as it was already shown for the laminar base flows in figure 2(b). This convergence is visible in the figure 14(a–d). Observe that, in the region near
 $r\simeq 0.6$
, where the roll flows are stronger, the average rate-of-strain intensity
 $\langle \unicode[STIX]{x1D6E4}_{2}\rangle _{\unicode[STIX]{x1D703}z}$
decreases, whatever
 $\unicode[STIX]{x1D706}$
. For
 $\unicode[STIX]{x1D706}=0$
, i.e. the Newtonian case,
 $\unicode[STIX]{x1D702}=1$
, the relation (5.11) gives
 $$\begin{eqnarray}\displaystyle P_{dissN}=\langle \unicode[STIX]{x1D6E4}_{2}\rangle _{r\unicode[STIX]{x1D703}z}=4\overline{W}. & & \displaystyle\end{eqnarray}$$
In the case of the laminar, Hagen–Poiseuille flow,
 $$\begin{eqnarray}\displaystyle P_{dissN}=\langle \unicode[STIX]{x1D6E4}_{2}\rangle _{r\unicode[STIX]{x1D703}z}=2\int _{0}^{1}\langle \unicode[STIX]{x1D6E4}_{2}\rangle _{\unicode[STIX]{x1D703}z}r\,\text{d}r=2, & & \displaystyle\end{eqnarray}$$
which is coherent with the dashed profile of figure 14(a). On the other hand, in the critical EFKW wave,
 $$\begin{eqnarray}\displaystyle P_{dissN}=\langle \unicode[STIX]{x1D6E4}_{2}\rangle _{r\unicode[STIX]{x1D703}z}=2\int _{0}^{1}\langle \unicode[STIX]{x1D6E4}_{2}\rangle _{\unicode[STIX]{x1D703}z}r\,\text{d}r=4\overline{W}_{cN}=1.54, & & \displaystyle\end{eqnarray}$$
which is coherent with the continuous profile of figure 14(a). The tendencies observed in figure 14(a), i.e. lower (respectively higher) rate of strain near
 $r\simeq 0.6$
(respectively
 $r\simeq 1$
) in the wave than in the laminar flow, persist in the non-Newtonian case: the profiles of the figure 14(a–d) are all similar, the main effect being an increase in magnitude, already encountered in figure 2(b). Because the non-Newtonian fluids studied are shear thinning, smaller values of
 $\unicode[STIX]{x1D6E4}_{2}$
imply larger values of
 $\unicode[STIX]{x1D702}$
(2.19): indeed the profiles of the figure 14(e–g) show a bump of
 $\unicode[STIX]{x1D702}$
near
 $r\simeq 0.6$
. Since the relation (2.19) is nonlinear,
 $\langle \unicode[STIX]{x1D702}\rangle _{\unicode[STIX]{x1D703}z}$
is not the viscosity evaluated at
 $\langle \unicode[STIX]{x1D6E4}_{2}\rangle _{\unicode[STIX]{x1D703}z}$
, i.e. the link between the profiles of the figure 14(b–d) and those of the figure 14(e–g) is not straightforward. This is in particular visible near the pipe wall, where
 $\langle \unicode[STIX]{x1D6E4}_{2}\rangle _{\unicode[STIX]{x1D703}z}$
in the wave is larger than
 $\unicode[STIX]{x1D6E4}_{2}$
in the laminar flow, though
 $\langle \unicode[STIX]{x1D702}\rangle _{\unicode[STIX]{x1D703}z}$
in the wave is
 $\unicode[STIX]{x1D702}_{w}$
. In line with the relation (5.11), and the fact that
 $\overline{W}$
in wave flows is smaller than
 $\overline{W}_{b}$
in the laminar flows, the figure 14(h–j) shows that the product
 $\unicode[STIX]{x1D702}\unicode[STIX]{x1D6E4}_{2}$
, the local dissipation rate, decreases in average in wave flows.
A master curve for the averaged viscosity profiles can be obtained by measuring the viscosity in units of the wall viscosity
 $\unicode[STIX]{x1D702}_{w}$
, as it has already been done for the laminar flows in figure 2(d). The figure 13(b) shows that, as
 $\unicode[STIX]{x1D706}\rightarrow +\infty$
,
 $\langle \unicode[STIX]{x1D702}\rangle _{\unicode[STIX]{x1D703}z}/\unicode[STIX]{x1D702}_{w}$
converges to a curve which corresponds quite probably to the one of the power-law fluid critical wave, the viscosity of which diverges as
 $r\rightarrow 0^{+}$
.
If one comes back to the figure 14(e–g), it is clear that the bulk average mean viscosity
 $\overline{\unicode[STIX]{x1D702}}_{c}$
of the critical waves is slightly larger than the bulk average mean viscosity
 $\overline{\unicode[STIX]{x1D702}}_{b}$
of the laminar flows, which has been studied in § 3.3. This is confirmed by the triangles in the figure 3(b). Note that, for
 $\unicode[STIX]{x1D706}\geqslant 4$
,
 $\overline{\unicode[STIX]{x1D702}}_{c}(n_{C},\unicode[STIX]{x1D706})\simeq \overline{\unicode[STIX]{x1D702}}_{bpl}(n_{C},\unicode[STIX]{x1D706})$
within
 $\pm 18\,\%$
.
5.3.4 Critical Reynolds numbers
The figure 8 suggests that the critical wall-viscosity Reynolds number
 $\mathit{Re}_{wc}(n_{C},\unicode[STIX]{x1D706})$
, which corresponds to the minima of the curves in this figure, converges to a finite limit as
 $\unicode[STIX]{x1D706}\rightarrow +\infty$
. Indeed, a fit of the form
 $$\begin{eqnarray}\displaystyle \mathit{Re}_{wc}(n_{C},\unicode[STIX]{x1D706})=\mathit{Re}_{wcpl}(n_{C})+\unicode[STIX]{x1D6FE}(n_{C})\,\unicode[STIX]{x1D706}^{-3/2}, & & \displaystyle\end{eqnarray}$$
evaluated on the last 3 data disk points of figure 15(a), for
 $\unicode[STIX]{x1D706}\geqslant 10$
, yields a curve that describes well the 8 data disk points of figure 15(a) with
 $\unicode[STIX]{x1D706}\geqslant 3$
. From this fit one extracts the critical value for a power-law fluid
 $$\begin{eqnarray}\displaystyle \mathit{Re}_{wcpl}(n_{C}=0.5)=2890. & & \displaystyle\end{eqnarray}$$
The optimization of the wavenumber
 $q$
has a dramatic effect; if it is not performed, as it was the case in Roland et al. (Reference Roland, Plaut and Nouar2010), one obtains the upper curve with the stars in figure 15(a), with much higher values of
 $\mathit{Re}_{w}$
. One can question the choice of the characteristic viscosity used to define the critical Reynolds number. A remarkable result of figure 15(a) is that, if one uses a Reynolds number constructed on the bulk average mean viscosity
 $\overline{\unicode[STIX]{x1D702}}_{c}$
of the critical waves,
 $$\begin{eqnarray}\displaystyle \mathit{Re}_{mc}(n_{C},\unicode[STIX]{x1D706})=\mathit{Re}_{wc}(n_{C},\unicode[STIX]{x1D706})\,\unicode[STIX]{x1D702}_{w}(n_{C},\unicode[STIX]{x1D706})/\overline{\unicode[STIX]{x1D702}}_{c}(n_{C},\unicode[STIX]{x1D706}), & & \displaystyle\end{eqnarray}$$
with the exact values displayed by the triangles in the figure 3(b), one obtains the curve with the triangles in the figure 15(a), which is almost flat. Thus, approximately,
 $\mathit{Re}_{mc}(n_{C},\unicode[STIX]{x1D706})\simeq \mathit{Re}_{cN}=1251$
. Using this approximation, and
 $\overline{\unicode[STIX]{x1D702}}_{c}(n_{C},\unicode[STIX]{x1D706})\simeq \overline{\unicode[STIX]{x1D702}}_{bpl}(n_{C},\unicode[STIX]{x1D706})$
, in (5.17), we can propose, with the help of (3.12), the analytic formula
 $$\begin{eqnarray}\displaystyle \mathit{Re}_{wcpl}(n_{C})\simeq 1251\,\overline{\unicode[STIX]{x1D702}}_{bpl}(n_{C},\unicode[STIX]{x1D706})/\unicode[STIX]{x1D702}_{wpl}(n_{C},\unicode[STIX]{x1D706})=834\,n_{C}/(n_{C}-1/3). & & \displaystyle\end{eqnarray}$$
5.4 Validation - asymptotic power-law regime for
$n_{C}\geqslant 0.5$

In order to validate the analytic formula (5.18), computations have been performed with
 $n_{C}=0.6$
and
 $0.7$
, by continuation starting from the solutions obtained with
 $n_{C}=0.5$
. The critical values of the wavenumber
 $q$
increase, i.e. they are closer to the Newtonian value (1.9): for instance
 $q_{c}(0.6,18)=2.07$
,
 $q_{c}(0.7,18)=2.16$
(compare with figure 9
 $a$
). The critical wall-viscosity Reynolds numbers obtained are displayed in figure 15
 $(b)$
. With fits of the form (5.15), we determine the asymptotic values
 $$\begin{eqnarray}\displaystyle \mathit{Re}_{wcpl}(n_{C}=0.6)=2175,\quad \mathit{Re}_{wcpl}(n_{C}=0.7)=1782. & & \displaystyle\end{eqnarray}$$
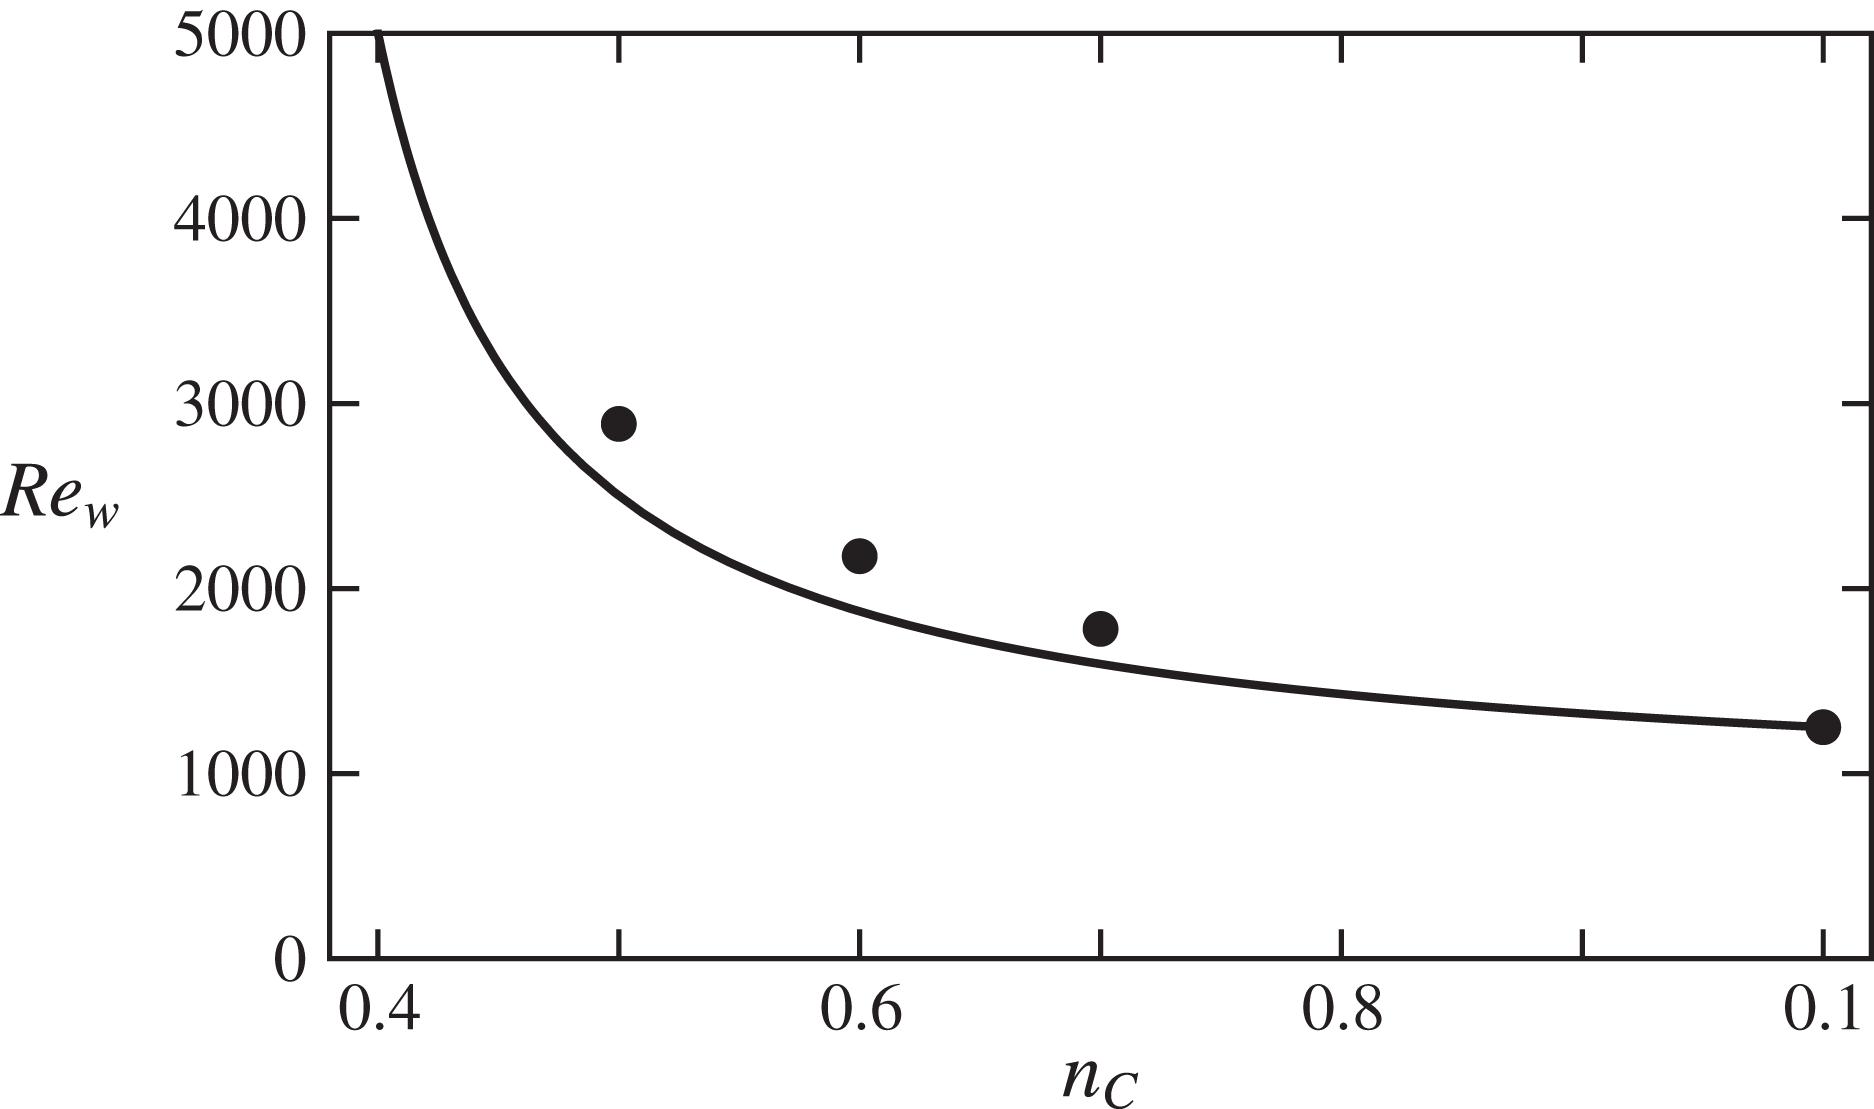
As shown in the figure 16, the formula (5.18) yields a reasonable estimate of
 $\mathit{Re}_{wcpl}(n_{C})$
in both cases.
●, Asymptotic values of the critical wall-viscosity Reynolds number
 $\mathit{Re}_{wcpl}(n_{C})$
for
 $n_{C}=0.5,0.6,0.7$
together with the Newtonian value
 $\mathit{Re}_{wcpl}(1)=\mathit{Re}_{cN}$
; continuous curve, formula (5.18).
6 Waves at constant mass flux
6.1 Newtonian fluid
Consider the critical EFKW wave that develops, in a Newtonian pipe flow, on top of the laminar Hagen–Poiseuille flow with centreline velocity
 $W_{0}$
and pressure gradient
 $G_{0}$
. The dimensional mass flux of this laminar flow is
 $W_{0}\overline{W}_{bN}$
with
 $\overline{W}_{bN}=0.5$
, whereas the dimensional mass flux of the wave is smaller,
 $W_{0}\overline{W}_{cN}$
with
 $\overline{W}_{cN}=0.384$
(§ 5.3.1). The laminar flow at the same mass flux corresponds to a centreline velocity
 $W_{1}$
such that
 $$\begin{eqnarray}\displaystyle W_{1}\overline{W}_{bN}=W_{0}\overline{W}_{cN}\quad \text{i.e.}~W_{1}=W_{0}\overline{W}_{cN}/\overline{W}_{bN}=0.768W_{0}. & & \displaystyle\end{eqnarray}$$
The pressure gradient in this laminar flow is proportional to the centreline velocity,
 $G_{1}=0.768G_{0}$
. Hence the pressure gradient increase factor at constant mass flux is
 $$\begin{eqnarray}\displaystyle A=G_{0}/G_{1}=W_{0}/W_{1}=\overline{W}_{bN}/\overline{W}_{cN}=1.30. & & \displaystyle\end{eqnarray}$$
6.2 Non-Newtonian Carreau fluid
Consider a critical wave computed in a given pipe, for a given non-Newtonian fluid, given pressure gradient
 $G_{0}$
characterized by the corresponding centreline laminar base flow velocity
 $W_{0}$
, hence given parameters
 $\mathit{Re}_{0}$
and
 $\unicode[STIX]{x1D706}=\unicode[STIX]{x1D706}_{C}W_{0}/a$
. The dimensional mass flux of this laminar flow is
 $W_{0}\overline{W}_{b}(n_{C},\unicode[STIX]{x1D706})$
, whereas the dimensional mass flux of the wave is smaller,
 $W_{0}\overline{W}_{c}(n_{C},\unicode[STIX]{x1D706})$
(§ 5.3.1). The laminar base flow of the same fluid in the same pipe with the same mass flux corresponds to a smaller value of the centreline velocity
 $W_{1}$
, smaller value of
 $\unicode[STIX]{x1D706}$
,
 $\unicode[STIX]{x1D706}_{1}=\unicode[STIX]{x1D706}_{C}W_{1}/a$
, such that
 $$\begin{eqnarray}\displaystyle W_{1}\overline{W}_{b}(n_{C},\unicode[STIX]{x1D706}_{1})=W_{0}\overline{W}_{c}(n_{C},\unicode[STIX]{x1D706})\quad \text{i.e.}~\unicode[STIX]{x1D706}_{1}\overline{W}_{b}(n_{C},\unicode[STIX]{x1D706}_{1})=\unicode[STIX]{x1D706}\overline{W}_{c}(n_{C},\unicode[STIX]{x1D706}) & & \displaystyle\end{eqnarray}$$
after multiplication by
 $\unicode[STIX]{x1D706}_{C}/a$
. The function
 $\unicode[STIX]{x1D706}_{1}\mapsto \overline{W}_{b}(n_{C},\unicode[STIX]{x1D706}_{1})$
increases (figure 3
a), hence
 $\unicode[STIX]{x1D706}_{1}\mapsto \unicode[STIX]{x1D706}_{1}\overline{W}_{b}(n_{C},\unicode[STIX]{x1D706}_{1})$
increases, equation (6.3) defines
 $\unicode[STIX]{x1D706}_{1}$
without ambiguity. For large
 $\unicode[STIX]{x1D706}$
,
 $\overline{W}_{\!c}(n_{C},\unicode[STIX]{x1D706})\simeq \overline{W}_{\!cpl}(n_{C})$
,
 $\unicode[STIX]{x1D706}_{1}$
is large and
 $\overline{W}_{\!b}(n_{C},\unicode[STIX]{x1D706}_{1})\simeq \overline{W}_{\!bpl}(n_{C})$
. Hence the solution of (6.3) approaches
 $$\begin{eqnarray}\displaystyle \unicode[STIX]{x1D706}_{1pl}=\unicode[STIX]{x1D706}\overline{W}_{cpl}(n_{C})/\overline{W}_{bpl}(n_{C})=0.69\unicode[STIX]{x1D706} & & \displaystyle\end{eqnarray}$$
for
 $n_{C}=0.5$
, according to (5.8). Because of (3.2), the dimensional pressure gradient in the reference laminar flow i.e. in the wave flow is
 $$\begin{eqnarray}\displaystyle G_{0}=G\,\unicode[STIX]{x1D70C}W_{0}^{2}/a=\unicode[STIX]{x1D6FC}(n_{C},\unicode[STIX]{x1D706})\mathit{Re}_{0}^{-1}\,\unicode[STIX]{x1D70C}W_{0}^{2}/a=\unicode[STIX]{x1D6FC}(n_{C},\unicode[STIX]{x1D706})\,\unicode[STIX]{x1D70C}W_{0}\unicode[STIX]{x1D708}_{0}/a^{2}. & & \displaystyle\end{eqnarray}$$
Accordingly the dimensional pressure gradient in the laminar flow with the same mass flux is
 $$\begin{eqnarray}\displaystyle G_{1}=\unicode[STIX]{x1D6FC}(n_{C},\unicode[STIX]{x1D706}_{1})\,\unicode[STIX]{x1D70C}W_{1}\unicode[STIX]{x1D708}_{0}/a^{2}. & & \displaystyle\end{eqnarray}$$
Hence the pressure gradient increase factor at constant mass flux is
 $$\begin{eqnarray}\displaystyle A(n_{C},\unicode[STIX]{x1D706})=G_{0}/G_{1}=\unicode[STIX]{x1D706}\unicode[STIX]{x1D6FC}(n_{C},\unicode[STIX]{x1D706})/(\unicode[STIX]{x1D706}_{1}\unicode[STIX]{x1D6FC}(n_{C},\unicode[STIX]{x1D706}_{1})). & & \displaystyle\end{eqnarray}$$
At large
 $\unicode[STIX]{x1D706}$
, i.e. large
 $\unicode[STIX]{x1D706}_{1}\simeq \unicode[STIX]{x1D706}_{1pl}$
given by (6.4), the power-law formula (4.6) yields the approximation
 $$\begin{eqnarray}\displaystyle A(n_{C},\unicode[STIX]{x1D706})\simeq A_{pl}(n_{C})=(\unicode[STIX]{x1D706}/\unicode[STIX]{x1D706}_{1pl})^{n_{C}}=(\overline{W}_{bpl}(n_{C})/\overline{W}_{cpl}(n_{C}))^{n_{C}}. & & \displaystyle\end{eqnarray}$$
The Newtonian formula (6.2) is recovered in the limit
 $n_{C}\rightarrow 1$
. For instance,
 $$\begin{eqnarray}\displaystyle A_{pl}(n_{C}=0.5)=1.20. & & \displaystyle\end{eqnarray}$$
Physically, the nonlinear relation between the pressure gradient and the centreline velocity in laminar flows (6.5), in the power-law limit,
 $$\begin{eqnarray}\displaystyle G_{0pl}=\unicode[STIX]{x1D6FC}_{pl}(n_{C},\unicode[STIX]{x1D706})\,\unicode[STIX]{x1D70C}W_{0}\unicode[STIX]{x1D708}_{0}/a^{2}=2a^{-n_{C}-1}\unicode[STIX]{x1D70C}\unicode[STIX]{x1D708}_{0}\unicode[STIX]{x1D706}_{C}^{n_{C}-1}(1+1/n_{C})^{n_{C}}\,W_{0}^{n_{C}}, & & \displaystyle\end{eqnarray}$$
leads to the fact that the pressure gradient increase factor
 $A_{pl}$
is the mass flux reduction factor (5.8) at the power
 $-n_{C}$
. Thus the pressure gradient increase factor in the power-law fluids (6.8) or (6.9) is smaller than in the Newtonian fluid (6.2); this is remarkable.
Note finally that the computation of
 $\unicode[STIX]{x1D706}_{1}$
from the full equation (6.3) and then of
 $A$
from (6.7) shows a fast convergence, as
 $\unicode[STIX]{x1D706}$
increases, to the power-law limit; for instance
 $A(n_{C}=0.5,\unicode[STIX]{x1D706}=1)=1.22$
is already
 $A_{pl}(n_{C}=0.5)$
within 2 %.
7 Concluding discussion
A systematic study of ‘low Reynolds number’ critical EFKW waves with a threefold rotational symmetry in pipe flows of Carreau fluids has been performed. A continuous family of waves has been found and characterized as a function of the shear-thinning index
 $n_{C}$
and the dimensionless characteristic time
 $\unicode[STIX]{x1D706}$
of the Carreau fluid (2.18). Since
 $n_{C}=1$
or
 $\unicode[STIX]{x1D706}=0$
correspond to a Newtonian fluid, this sheds a new light onto some properties of the waves discovered by Faisst & Eckhardt (Reference Faisst and Eckhardt2003), Wedin & Kerswell (Reference Wedin and Kerswell2004): to our knowledge the detailed study of the root-mean-square of the axial velocity (5.9), of the rate-of-strain intensity
 $\unicode[STIX]{x1D6E4}_{2}$
or of the dissipation (5.10) presented in table 2, figures 12 and 14 had never been performed. In the non-Newtonian cases
 $n_{C}<1$
and
 $\unicode[STIX]{x1D706}>0$
, the wave velocity fields are only ‘slightly’ modified by the rheology (figures 11 and 12
a–c), the main effects being the development of a rather homogeneous region around the axis and a compression of the structures towards the wall. When the axial wavenumber
 $q$
is optimized, an asymptotic regime is obtained in the limit
 $\unicode[STIX]{x1D706}\rightarrow +\infty$
, where the fluid can be viewed as a power-law fluid (2.25): the wave velocity field converges to a limit, and it is also the case for its axial wavenumber and phase velocity (figure 9). In line with what is observed in the laminar flows (figure 2), a large viscosity contrast develops between the pipe centre and the pipe wall (figure 14
e–g). It turns out that using the wall viscosity (figure 3
b) to construct the critical Reynolds number, we obtain convergence of this number to a limit
 $\mathit{Re}_{wcpl}$
(figure 15). An analytical approximation for
 $\mathit{Re}_{wcpl}$
(5.18) is introduced and validated (figure 16). It is based on the fact that the critical Reynolds number constructed with the bulk average of the viscosity is roughly constant, and on a laminar formula for this viscosity. At this stage recall that the formula (5.18) and all the study performed here is relevant only for fluids with
 $n_{C}\gtrsim 0.4$
, see the discussion after (3.12). The figure 16 shows a clear stabilizing effect of the shear-thinning rheology, which can be viewed as a part of the explanation of the delay in the transition to developed turbulence noticed in the experiments by Escudier and coworkers. Moreover, assuming that the turbulent flows would be close to the nonlinear wave flows computed here, we predict a moderate pressure gradient increase in Carreau fluids, compare equations (6.2) and (6.9). This effect is reminiscent of the ‘drag reduction effect’ well known in many non-Newtonian fluids.
In a quite different system, Rayleigh–Bénard thermoconvection, a similar asymptotic regime has been found by Jenny, Plaut & Briard (Reference Jenny, Plaut and Briard2015) for strongly shear-thinning Carreau fluids: the onset of thermoconvection rolls becomes subcritical, and the critical Rayleigh number constructed on the bulk average of the viscosity is roughly constant. This proves, generally, the relevance of the bulk averaged mean viscosity in shear-thinning fluids.
It would be interesting to study the instability modes of the waves computed, and to analyse the influence of the shear-thinning rheology onto other wave families. Probably, the other EFKW waves with
 $m_{0}=2$
or
 $m_{0}\geqslant 4$
will present the same behaviour as shear thinning increases, i.e. a similar asymptotic regime as
 $\unicode[STIX]{x1D706}\rightarrow +\infty$
, and in this limit a critical wall-viscosity Reynolds number that increases as
 $n_{C}$
decreases, in proportion to
 $n_{C}/(n_{C}-1/3)$
(stabilizing effect, see (5.18) and figure 16). That however should be checked. Other waves may behave differently. For instance, some waves with
 $m_{0}=1$
like the ones found by Pringle & Kerswell (Reference Pringle and Kerswell2007) in Newtonian fluids may be modified and destabilized by the shear-thinning effects, and be relevant to model not the transition to turbulence but the asymmetrical flow observed experimentally by Escudier and coworkers in non-Newtonian fluids. Moreover, elastic effects, disregarded in our study, could be studied, firstly, within the same ‘nonlinear wave framework’, as it has been done for plane Poiseuille flow in Li, Xi & Graham (Reference Li, Xi and Graham2006). We recognize finally that the ‘nonlinear wave framework’ tells only a small part of the story of the transition to turbulence.
Although the fluids studied here are, when
 $\unicode[STIX]{x1D706}\rightarrow +\infty$
, strongly shear thinning, the waves themselves are only ‘weakly’ non-Newtonian, since their structure with streamwise rolls and streaks is only weakly modified by the rheology: see the figure 11 and the similarity between the two waves on the movie included as online supplementary material. It would be interesting to search for waves that are specifically non-Newtonian. For this purpose, one could start with direct numerical simulations of transitional or turbulent pipe flow of non-Newtonian fluids (we note in this context the work of Rudman et al.
Reference Rudman, Blackburn, Graham and Pullum2004) and use methods similar to the ones used by Duguet, Willis & Kerswell (Reference Duguet, Willis and Kerswell2008b
), Avila et al. (Reference Avila, Mellibovsky, Roland and Hof2013), Willis, Short & Cvitanović (Reference Willis, Short and Cvitanović2016).
Acknowledgement
The computations have been performed on the cluster Asterix – CC ERMIONE of the Institut Jean Lamour and the Lemta. E.P. thanks L. Buhler and F. Kosior for their help with the informatics.
Supplementary movie
A supplementary movie is available at https://doi.org/10.1017/jfm.2017.149.



