Introduction
The Antarctic marine environment is unique in that the surface water contains high levels of cadmium (Cd). Biomagnification through the food web can cause Antarctic marine organisms to accumulate Cd in their soft tissues to concentrations several orders of magnitude above environmental levels (De Moreno et al. Reference De Moreno, Gerpr, Moreno and Vodopivez1997, Negri et al. Reference Negri, Burns, Boyle, Brinkman and Webster2006).
The Antarctic clam Laternula elliptica (King and Broderip), a key species in the Antarctic food chain, is a sentinel organism for environmental monitoring in Antarctic shallow waters, by virtue of its wide distribution, high population density, large body, long life span, and high metal accumulating capacity (Ahn et al. Reference Ahn, Lee, Kim, Shim and Kim1996). By monitoring the levels of contaminants accumulated by biological species, the fraction of chemicals that is bioavailable, and thus potentially toxic, can be measured (Amiard et al. Reference Amiard, Amiard-Triquet, Barka, Pellerin and Rainbow2006). In baseline analyses of metal accumulation in L. elliptica from King George Island, high levels of some heavy metals, particularly Cd and Cu, have been reported (Ahn et al. Reference Ahn, Lee, Kim, Shim and Kim1996, Reference Ahn, Kang and Kim2001). Furthermore, Choi et al. (Reference Choi, Ahn, Ryu, Lee, Lee and Jeong2001) observed immunohistochemical responses to an antibody against metallothioneins (MTs) in the gills, kidneys, and digestive gland of Cd-exposed L. elliptica, indicating the presence of MTs induced by Cd. These studies also found that MTs play an important role in Cd sequestration in the cytosol of L. elliptica kidney and digestive gland. Thus, metal-binding proteins such as MTs, were proposed as useful biomarkers to detect early, sublethal changes in these and other organisms at the molecular or cellular level.
When organisms are exposed to Cd, substantial levels of MTs accumulate in many tissues. MTs are cysteine-rich, low molecular weight proteins, but they contain few aromatic or histidine residue. The proteins typically have a one- or two-domain structure, joined by a short linking region, and bind multiple divalent metal ions (Hartmann et al. Reference Hartmann, Li and Weser1992, Riek et al. Reference Riek, Precheur, Wang, Mackay, Wider, Guntert, Liu, Kägi and Wuthrich1999). However, no catalytic function has been determined for these proteins; rather, MTs are multifunctional cellular proteins that play major roles in the detoxification of toxic non-essential metals (such as Cd and Hg) and in the homeostatic regulation of trace elements (such as Cu and Zn). In metal homeostasis, MTs are involved in several biochemical processes, e.g. providing cells with a reservoir of Cu and Zn in the biosynthesis of metalloenzymes and metalloproteins (Kägi Reference Kägi1991). MTs also play an active role in protecting cells against oxidative stress (Chubatsu & Meneghini Reference Chubatsu and Meneghini1993), the scavenging of free radicals (Sato & Bremner Reference Sato and Bremner1993), and growth and development of the organism (Nemer et al. Reference Nemer, Travaglini, Rondinelli and D′alonzo1984). Nonetheless, despite intensive studies of MTs in a wide range of organisms, the precise biological function of these proteins remains elusive.
In this study, MTs in the Antarctic clam L. elliptica were successfully purified and the spectroscopic properties of MT Cd-thiolate clusters were analysed.
Materials and methods
Animal sampling and cadmium exposure
Laternula elliptica (shell length ≈ 80 mm) specimens were hand-collected by SCUBA divers at depths of 20 to 30 m from Marian Cove, near King Sejong Station, King George Island (62°13′S, 58°47′W) in December 2001. The clams were acclimated to the experimental conditions (~1.0°C) for two days and then exposed to a sublethal concentration of Cd (50 µg L-1) for eight days without feeding.
Tissue preparation
The clams were dissected immediately after their exposure to Cd. Among the various tissues obtained, the digestive gland was selected for study because it is known to accumulate large amounts of Cd (Ahn et al. Reference Ahn, Lee, Kim, Shim and Kim1996). The isolated digestive gland was frozen over dry ice and kept at -70°C until further analysis. In addition, subsamples of the frozen digestive gland were homogenized immediately in five volumes of Tris-HCl buffer (20 mM Tris-HCl [pH 8.0], 0.2 mM PMSF, 0.5 mM DTT) for 15 min at 4°C, followed by centrifugation at 30 000 × g for 1 h at 4°C. The supernatant was treated at 80°C for 10 min to precipitate high molecular weight proteins and again centrifuged at 30 000 × g for 1 h at 4°C. The final supernatant was concentrated by ultrafiltration (Amicon YM3; Millipore, Billerica, MA, USA) and stored at -70°C.
Alkylation and purification of MTs
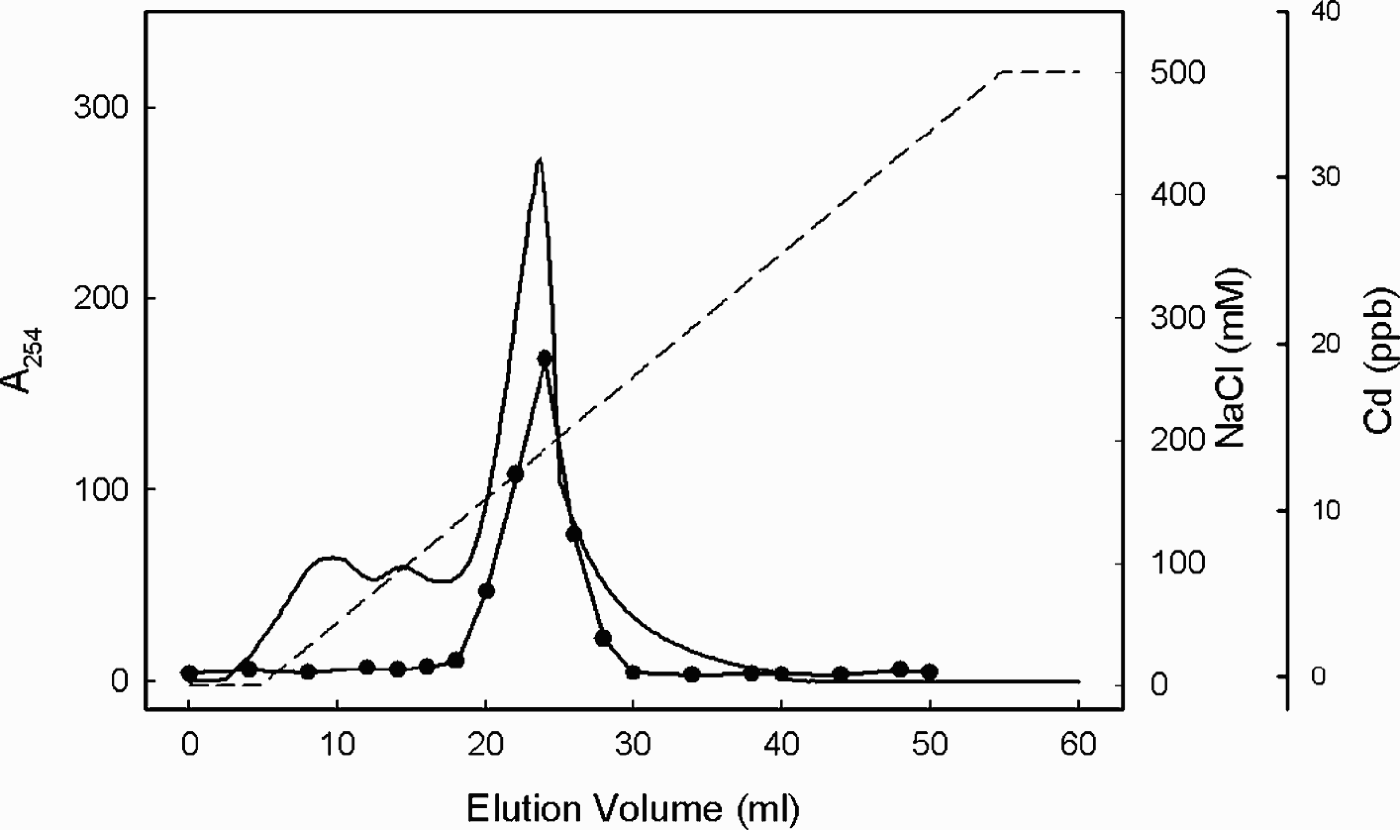
Supernatants were heat-treated and divided in two aliquots. One was incubated for 60 min on ice in buffer containing 20 mM of the thiol alkylating agent N-ethylmaleimide (NEM) to prevent the formation of disulphide bonds, while the other served as a non-treated control. Each sample was applied to a 16 × 600 mm Sephacryl S-100 column (Amersham Biosciences, Uppsala, Sweden) equilibrated with Tris-HCl buffer (20 mM Tris-HCl [pH 8.0], 20 mM β-mercaptoethanol, 0.1 mM PMSF) and calibrated with the following molecular mass standards: bovine serum albumin (66 kDa), carbonic anhydrase (29 kDa), rabbit MT (6.5 kDa), and vitamin B12 (1.35 kDa). Eluted proteins were monitored spectrophotometrically at A 254, and Cd concentrations were measured in the 5 ml fractions collected using inductively coupled plasma-mass spectrometry (Elan 6100; Perkin-Elmer, Norwalk, CT, USA). The fractions were eluted with buffer at a flow rate of 0.5 ml min-1. Cd-rich protein fractions were pooled and applied to a DEAE-Sepharose FF column (1.5 × 3 cm; Amersham Biosciences, Uppsala, Sweden) equilibrated with 20 mM Tris-HCl buffer. Bound proteins were eluted with a linear ionic strength gradient (0–500 mM NaCl [pH 8.0]) at a flow rate of 5 ml min-1. A 254 and the Cd concentration of 5 ml fractions were measured as described above.
Electrophoresis and Western blotting analysis
Proteins eluted from each purification step were assayed for homogeneity by SDS-PAGE in mini-slab gels (70 × 80 × 1 mm). Stacking gels consisted of 0.1% SDS, 5% polyacrylamide, and separating gels of 0.1% SDS, 12% polyacrylamide. The gels were stained with the Coomassie blue G-250 protein staining method (Mitra et al. Reference Mitra, Pal, Basu and Hati1994). Proteins separated by SDS-PAGE (12% gel) were transferred to a polyvinylidene difluoride membrane (Immobilon PVDF membrane, Millipore) according to the method of Towbin et al. (Reference Towbin, Staehelin and Gordon1979). The blotted PVDF membrane was incubated in 4% skim milk in PBS at room temperature for 2 h. After the washing process with PBS containing 0.1% Tween 20, the PVDF membrane was exposed first to monoclonal mouse anti-metallothionein IgG (DAKO, Carpinteria, CA, USA) overnight at 4°C and then to alkaline phosphatase-linked goat anti-mouse IgG (1:5000 dilution, Sigma, St Louis, MO, USA) for 1 h at room temperature. Antibodies were diluted with PBS containing 0.1% Tween 20 and 4% skim milk. The PVDF membrane was washed thoroughly with PBS containing 0.1% Tween 20. The Western blots were visualized with a colour assay using nitro blue tetrazolium (NBT) and 5-bromo-4-chloro-3-indolyl phosphate (BCIP).
Molecular mass determination
The molecular masses of the proteins were determined by matrix-assisted laser desorption ionization time-of-flight mass spectrometry (MALDI-TOF MS) (Amersham Biosciences, Uppsala, Sweden). The apparatus was equipped with a pulsed extraction source, a 337 nm pulsed nitrogen laser, and a curved field reflectron. The acceleration voltage was 20 kV. The matrix, α-cyano-4-hydroxy-cinnamic acid (CHCA), was prepared in 1:1 acetonitrile/water and applied as a thin layer onto the sample plate, followed by the addition of 0.5 µl of sample and another 0.5 µl of matrix. The plate was then allowed to dry at room temperature.
Spectral properties of MT
To prepare apo-MTs, bound metal ions were removed from the purified MTs by acidifying the proteins with HCl to pH 2, followed by chromatography on a Sephacryl S-100 column (16 × 600 mm) equilibrated with 0.1 N HCl. The MTs were reconstituted with Cd by the addition of mole equivalents of Cd and neutralization of the samples to pH 7.0 with 100 mM Tris. Unbound metals were removed with Chelex 100. UV absorption spectra of the reconstituted Cd-MTs were recorded after incubation of the samples at room temperature for 15 min at each Cd concentration with a spectrophotometer (HP8453; Hewlett-Packard, Palo Alto, CA, USA). The protein concentration was calculated using the absorption coefficient of mammalian (62 amino acid) apo-MTs in 100 mM HCl at 220 nm (ε = 48 200 M-1cm-1), as described by Vasak (Reference Vasak1991), since the absorption coefficient for mollusc apo-MTs has not been reported.
Results and discussion
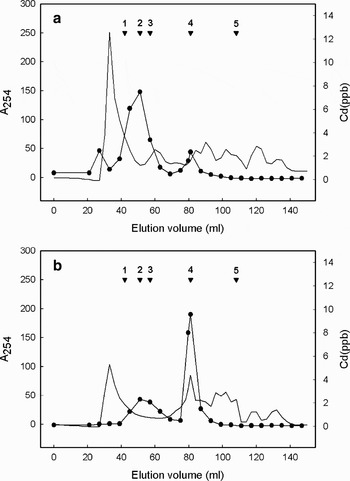
Heat-stable digestive gland proteins from Cd-exposed animals were fractionated by gel permeation chromatography. Figure 1 shows a typical elution profile of the Cd-bound L. elliptica proteinswith the MTs partially resolved into two peaks with molecular masses of c. 10 (Fig. 1a) and 20 kDa (Fig 1b), as judged from calibrated Sephacryl S-100 columns. Since approximately one third of the amino acid residues in MTs are cysteine, it has been suggested that MTs are oxidative proteins involved in the formation of intermolecular disulphide cross links between one or more cysteine residues. In addition, nonoxidative polymerization, brought about by the addition of excess Cd to a concentrated Cd-MT solution and characterized by metal bridging of metallothionein monomers, has been proposed.
a. Gel-permeation chromatography of Laternula elliptica digestive gland extract, and b. of the extract after alkylation on a Sephacryl S-100 column. The A 254 of the eluate was monitored, and 5 ml fractions were collected and analysed for Cd binding. The molecular mass markers were 1: bovine serum albumin (66 kDa), 2: carbonic anhydrase (29 kDa), 3: rabbit MT (6.5 kDa), 4: alkylated rabbit MT (6.5 kDa), 5: vitamin B12 (1.35 kDa). The solid line is A 254 and dot is Cd concentration.

If dimerization was caused by cysteine oxidation, this reaction should be reversed by adding thiol reducing reagents. Thus, to investigate the role of cysteine in MT oxidation, heat treated digestive gland protein was alkylated with NEM. The elution profile of Cd binding MT was influenced by alkylation with NEM (Fig. 1b). The chromatogram pattern after alkylation was consistent with a shift of the molecular mass of the major fraction of Cd-binding MT to 7 kDa, coincident with the rabbit metallothionein standard. Moreover, polymeric MT could be converted back into monomeric MT by incubation with NEM. Although the nature of the reaction leading to the production of this polymer species was not investigated in detail, previous NMR analysis (Zangger et al. Reference Zangger, Shen, Oz, Otvos and Armitage2001) showed that formation of the oxidative dimer is characterized by an intermolecular cysteine disulphide bond involving the α-domain. The same conclusions were recently drawn from a study in which both transient and stable MT dimers were detected by MS and circular dichroism (Hathout et al. Reference Hathout, Reynolds, Szilagyi and Fenselau2002). The function of MTs oligomerization by a Cd bridge in the presence of excess of Cd might be enhancement of the detoxification power of MTs under normal physiological conditions.
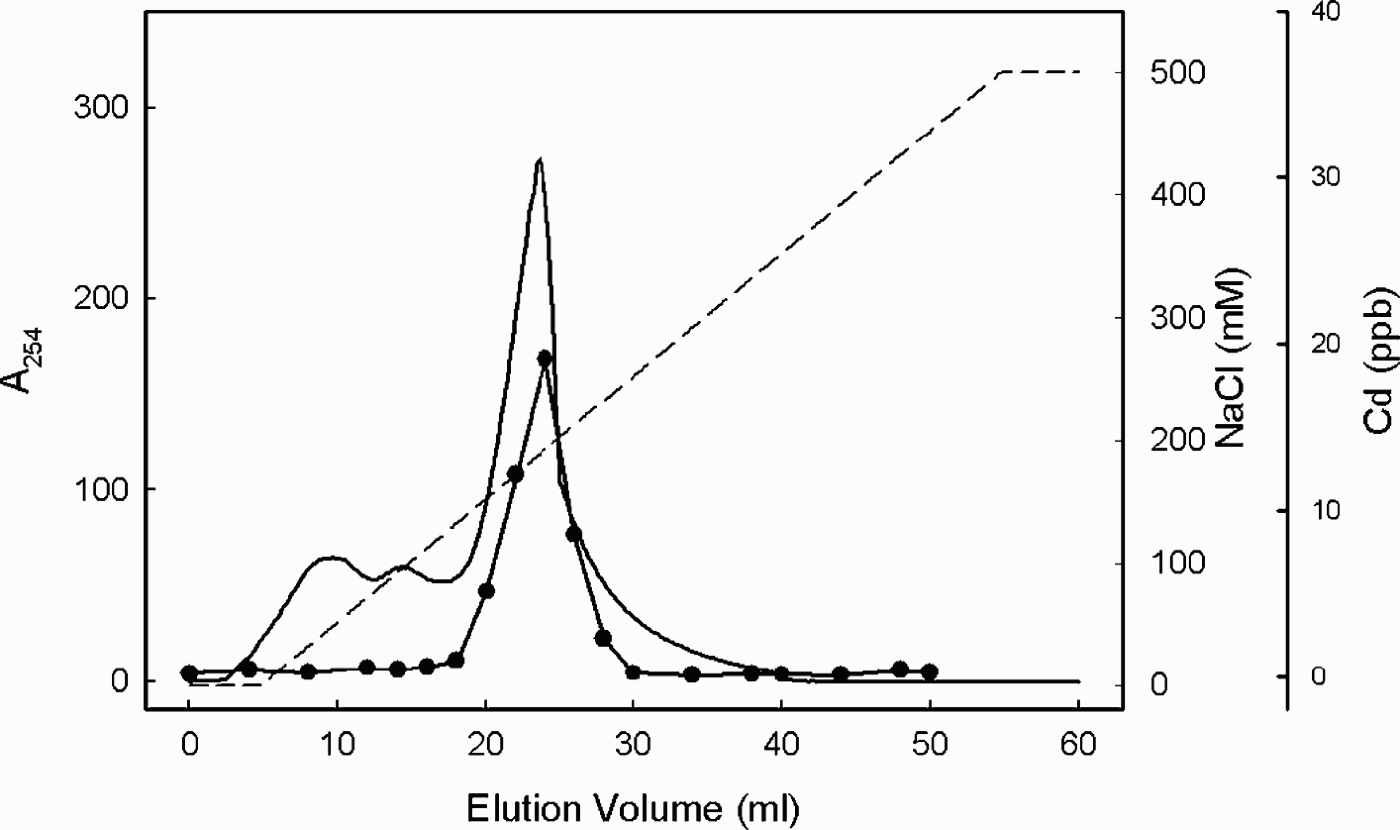
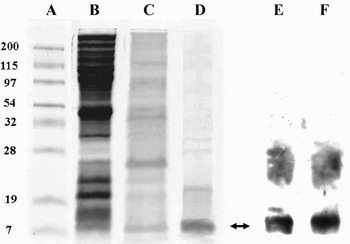
The Cd-containing fractions were further separated on a DEAE-Sepharose anion exchange column which shows that on 12% SDS-PAGE, an aliquot of the Cd-containing fractions gave a single band corresponding to rabbit MT Fig. 2. Figure 3 shows the electrophoretic protein patterns at each purification step. The molecular mass of the protein, as determined by MALDI-TOF MS, was 7.27 kDa. The purified MTs of each purification steps were recognized by monoclonal antibodies to MTs in Western blotting assay (Fig. 3 - lanes E & F). In earlier studies, pre-exposures of animals to a given metal (e.g. Cd, Cu, Zn) resulted in a strong induction of MT isoforms (Unger & Roesijadi Reference Unger and Roesijadi1996, Roesijadi et al. Reference Roesijadi, Hansen and Unger1997). Different MT isoforms have been found to coexist within an organism and are thought to play various physiological roles; for example, one MT may be dedicated to Cd detoxification and another to Cu regulation (Dallinger et al. Reference Dallinger, Berger, Hunziker and Kägi1997). Lemoine et al. (Reference Lemoine, Bigot, Sellos, Cosson and Laulier2000) obtained similar results in the mussel Mytilus edulis, in which genes encoding different MT isoforms were expressed in response to different metals. In that study, Zn exposure induced high levels of MT-10 mRNA, whereas Cd exposure induced two MT mRNAs, MT-10, and especially, MT-20. Thus, the minor 20-kDa Cd-containing fraction seen in Fig. 1b may represent the MT-20 isoform, although characterization of the latter was not attempted in this study.
Anion-exchange chromatography of metallothionein. Pooled peak fractions from a Sephacryl S-100 column were applied to DEAE-sepharose anion-exchange column and elute with a linear gradient of starting buffer (20 mM Tris-HCl [pH 8.0]) and final buffer (20 mM Tris-HCl, 500 mM NaCl [pH 8.0]) at a flow rate of 5 ml min-1. The solid line is A 254 and dot is Cd concentration.
SDS-PAGE and immunoblot analysis of the purified metallothionein from the Laternula ellipica digestive gland. Proteins corresponding to the different purification steps were fractionated by SDS–PAGE on 12% polyacrylamide gel and stained with Coomassie brilliant blue. Lane A = protein standard, lane B = tissue extract, lane C = pooled Cu-containing fractions from Sephacryl S-100 gel-permeation chromatography, lane D = pooled Cu-containg peak from DEAE Sepharose chromatography, lane E = Western blot analysis of purified metallothionein from gel-permeation chromatography, that was the same sample as lane C, lane F = Western blot analysis of purified metallothionein from DEAE Sepharose chromatography, that was the same sample as lane D. Molecular masses are indicated in kDa. The band corresponding to metallothionein is indicated by an arrow.

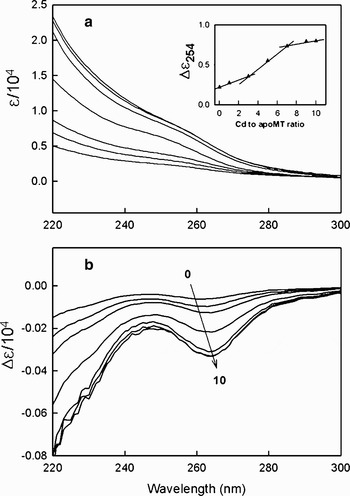
Figure 4 shows the UV absorption spectra obtained for the Cd-bound MTs. The absorption above 220 nm shows a shoulder centred at about 254 nm following Cd addition. This absorbance peaked at 254 nm, which is typical of Cd-thiolate complexes, increased with sequentially increasing molar ratios of cadmium/MT (moles of Cd per mole of MT), and disappeared in the presence of apo-MTs. The lack of absorbance above 250 nm was due to the absence of aromatic amino acid residues in MTs. The difference spectra (Fig. 4b) show that the red shift from 260 to 264 nm may well indicate that the addition of Cd leads to the formation of Cd-thiolate complexes. The red shift observed with increasing Cd content reflects the appearance of bridging thiolate ligands in the protein and is similar to that observed in the spectra of complexes resulting from the tetrahedral tetrathiolate coordination of Cd-MT (Willner et al. Reference Willner, Vasak and Kägi1987). UV absorption attained a maximum when a total of seven equivalents of Cd were bound, and the absorbance at 254 nm showed larger absorbance increments after three equivalents of Cd bound (Fig. 4a insert). Structural studies of various MTs demonstrated that the proteins are monomeric and composed of two globular domains, each containing an encompassing metal thiolate cluster (Hartmann et al. Reference Hartmann, Li and Weser1992). The MTs of mussels (Roesijadi et al. Reference Roesijadi, Kielland and Klerks1989) and sea urchins (Wang et al. Reference Wang, Mackay, Kurasaki and Kägi1994) were shown to bind seven equivalents of metal, while the MTs of several marine crustaceans (Otvos et al. Reference Otvos, Olafson and Armitage1982, Narula et al. Reference Narula, Armitage, Brouwer and Enghild1993) bind six equivalents of bivalent metal. Although assignment of the metal-binding coordination of MTs of the L. elliptica remains conjectural due to the lack of exact structural information, the spectral properties of this species may suggest seven equivalents Cd binding, 3 and 4 coordination of each domain, with different reactivity to Cd binding. This result is supported by a competitive kinetic study that shows that each domains has a different metal binding ability (Park et al. Reference Park, Ahn, Choi, Pyo and Lee2007).
Effect of fractional reconstitution of apoMT with Cd on the UV absorption. a. UV absorption specta by sequentially adding increasing amounts of Cd ions (0, 1, 3, 5, 7, 9 and 10 equivalents of Cd per mole), as shown from bottom to top. Insert, plot of difference absorbance at 254 nm vs Cd-to-apoMT ratio. b. Difference absorption spectra obtained by subtraction of successive spectra of Fig. 4a from top to bottom according to increase amounts of Cd ions (0, 1, 3, 5, 7, 9 and 10 equivalents of Cd per mole).

In conclusion, MTs from the digestive gland of the Antarctic clam L. elliptica were purified and characterized, and the spectral properties of purified Cd-binding MTs were analysed. Our results will enable further studies on the structure/function relationships of MTs and contribute to increasing our knowledge of the intrinsic biological role and evolutionary history of the Antarctic clam.
Acknowledgements
This study was supported by Monitoring on Environmental Changes at the Korean Arctic and Antarctic Stations (PE07040), funded by Korea Polar Research Institute (KOPRI) in the Korea Ocean Research & Development Institute (KORDI). We thank Dr Eva Philipp and two anonymous referees for their considerable comments on how to improve this manuscript.