


1. Introduction
‘Age does not come alone’ is perhaps the ultimate truism. Increasing age brings with it increased likelihood of physical and mental decline. Within a humane society, such decline requires the provision of care to support the well-being and functioning of those affected. Like many other countries where life expectancy has increased over recent decades, the UK is struggling to meet current demand for care services for older people. This demand will increase in the future as the share of older people in the population increases.
Care for older people is delivered through two main channels: the first is unpaid (or informal) care, which is usually supplied by the friends and family of the care recipients. Unpaid carers are motivated to provide care voluntarily without immediate compensation. The second channel is paid (or formal) care, which is delivered through some form of market mechanism. In the UK, care providers are mainly private sector organisations, while the payments these organisations receive come mainly from the care recipient or the state. In the UK at present, local authorities have the main responsibility for providing state support. Both England and Scotland have been exploring the possibility of establishing a ‘National Care Service’, with central organisations replacing the role currently played by local authorities (Department of Health and Social Care, 2025a; Scottish Parliament, 2025).
There are two frameworks that capture the main forms of care provision: these are activities of daily living (ADLs) which are necessary for basic physical functioning and survival (e.g., eating, dressing, bathing, getting in and out of bed, toileting) and instrumental activities of daily living (IADLs) that refer to more complex activities that enable independent living in the community (e.g., preparing meals, cleaning, laundry, taking medication, getting to places, shopping, managing money affairs, using telephone/internet). The prevalence of conditions that require ADL or IADL support generally increases with age. For some conditions, the age gradient is relatively shallow. For others, such as dementia, it is extremely steep. Formal care that is provided on an ongoing basis in someone’s home or in a care home and will likely terminate with the individual’s death is also known as long-term care (LTC). It may also be combined with health care that involves the intervention of trained medical personnel.
Care provision has played an important role in the UK’s political economy in recent years. Politicians have been aware for some time of the implications of population ageing and, in particular, of the difficulties of funding LTC for older people. Care home fees or charges for intensive domiciliary care packages are a significant financial risk for older people. Those whose assets exceed the relatively modest limits set separately by the authorities in England, Scotland, Wales and Northern Ireland are liable for the ‘hotel costs’ of their room and board if they require support in a care home.
Only a small proportion of older adults are resident in care homes. Census estimates show that 2.5% of those aged 65+ and 10.8% of those aged 85+ lived in care homes in England and Wales in 2021 (Office for National Statistics, 2023a). This share has been falling: at the 2011 census, 13.7% of those aged 85+ were care home residents.
Those whose wealth exceeds specific limits are ineligible for local authority support for their care charges and are therefore required to ‘self-fund’. These limits are set by the various governments within the UK. Self-funders face annual costs that average more than £70,000. Industry estimates for the mean weekly charge were £1409 in 2023/24 (Grant Thornton, 2025). For those receiving intensive care support in their own homes, hourly charges of between £30 and £35 per hour can also lead to comparable annual outlays. An exception to this charging regime is that in Scotland, those components of care classed as ‘personal care’ are provided free of charge both in domiciliary and care home settings irrespective of wealth. Costs of board and lodging, also known as ‘hotel charges’, are charged to care home residents in all parts of the UK.
Politicians throughout the UK have failed to develop policies to spread these risks equitably and sustainably. Various proposals have been made by the UK Government that would apply to England, but none has managed to navigate the political process successfully. The associated fiscal burden, driven by increases in the number of old people, has been a major obstacle to policy implementation. The details have also been challenging, given that each policy variant has different distributional implications.
One distributional effect which was a catalyst for the proposals by the 1997 Royal Commission (Royal Commission on Long-term Care, 1997) was that which arises due to the difference in costs faced by those affected by cancer on the one hand and by dementia on the other. The prevalence of both diseases increases with age. Yet those affected by dementia may face charges for social care that very significantly degrade their wealth while those affected by cancer will likely receive their treatment largely free on the National Health Service (NHS).
This seeming injustice lay at the heart of a sequence of political debates that began in 1997 as the demographic implications of the post-war surge in births became clear. The main concern has been around the division of LTC costs between the state and care recipients. Can the state deal with the fiscal implications of insuring citizens against all or part of the risks associated with LTC? While all the major parties acknowledge the need to spread risk more equitably, none of the various reforms that have been proposed since 1997 have been fully implemented.
Providing enhanced insurance against LTC costs is not the only policy area relevant to the care of older people that has had a high profile within UK public policy. The health of the formal care labour market has attracted attention, both in terms of what are generally perceived to be the poor rewards offered to care workers and because of its interaction with migration policy. Because of the weakness of domestic recruitment, organisations supplying care have sought to hire additional care workers from abroad. However, recent UK migration policy aims to restrict access to the UK labour market to higher paid, ostensibly more skilled, workers.
Another issue relevant to care for older people that has been relatively quiescent but is becoming more salient is the level of capital investment in care facilities. Demand for care home places is likely to rise as the number of individuals with high dependency requirements increases. Yet the supply response has been weak. Investment is dependent on expected returns in the sector. Upward pressure on labour costs and downward pressure on care charges have deterred investment in the sector for some time, as has the uncertainty associated with government policy for funding LTC. The issue of how to increase investment in care facilities is largely a policy-free zone.
Another vital area where policy development has been limited is unpaid care. Care from friends and relatives is an important component of the system of support for older people affected by frailty or disability. Any significant decline in unpaid care provision would increase pressure on both social care and the NHS. It could also increase unmet need where local authorities lack sufficient capacity to supply care. On the other hand, unpaid care provision may also reduce labour market participation. Yet it is not clear what policies are in place that might influence the ‘balance of care’—the relative contributions of paid and unpaid components of care provision in domiciliary and residential settings.
These policy issues relating to the care of older people are examined in more detail in subsequent sections of the paper. We consider issues relating to the funding of social care, the labour market for care workers, capital investment in the sector and finally, unpaid care. In some of these areas, such as on funding and on improving terms and conditions for care workers, there is a clear impetus to make progress. However, in relation to capital investment in care facilities and unpaid care, the policy imperative is much less visible. However, given the challenge of meeting the care needs of older people, which is demonstrated in the first part of the paper, it would seem that a more encompassing strategy covering all aspects of the care sector is required.
This article contributes to the existing literature by moving beyond the conventional focus on social care funding mechanisms, to viewing social care through a political economy lens. That is, social care provision and funding are the product of interactions between political objectives, economic incentives and social norms that particularly influence the provision of unpaid care and the passing of wealth from one generation to the next, and a range of policy instruments that influence the supply of labour and capital to the sector. This political economy lens helps explain why the policy response to the social care crisis has remained persistently inadequate.
Before embarking on more extensive analyses of these issues, it is worth noting that the quality of official data relating to adult social care is generally poor. This is true of both care homes and domiciliary care. In some areas, there is no official data, and reliance must be placed on data from bodies such as COReC (the Care and Outcomes Research Centre at the Universities of Kent and York) or from proprietary industry sources. The Office of the Statistical Regulator (OSR) published a critical report on the quality of social care statistics in the UK in 2020 (Office for Statistics Regulation, 2020). It argued that adult social care statistics were less well-resourced and consequently less well developed than those in healthcare; much of the private provision of adult social care goes unrecorded; the creation of harmonised datasets for comparative purposes was problematic and that data quality within and between local authorities, who are major procurers of adult social care, was variable. In the absence of good quality datasets, it is difficult to draw useful inference relating to aspects of the social care of older people.
2. Increase in the oldest old population
Older cohorts in the UK population are growing much faster than are those of the young. This is partly due to the post-war boom in births (the baby-boomers) and increasing life expectancy. The most recent ONS population projections (ONS, 2025) are based on the 2022 population estimates (see Figure 1). The principal projection suggests that between 2025 and 2050, those aged 15–64 will grow by 7.2%, while the numbers aged 65+ will grow by 34.4%. It is the growth in the oldest old (those aged 85+) which has the most significant implications for care costs, and there the growth is even more pronounced. Between 2025 and 2050, the size of this group will more than double, with females increasing by 99% and males by 115%, reflecting the slightly faster growth in life expectancy among males. By 2025, the central expectation is that there will be 3.6 million citizens in the UK aged 85+, and by 2060, there will be 4.2 million. This compares with an estimate of 1.8 million in 2026.
Projected numbers of the oldest old (aged 85+): UK 2025–2050.
Source: Office for National Statistics: Population Projections 2022-based, Principal Projection

Figure 1. Long description
A stacked bar chart with the Y-axis labeled Millions, ranging from 0 to 4 in increments of 0.5. The X-axis lists years from 2025 to 2050. Each bar is composed of two segments: a blue bottom segment representing Females and a red top segment representing Males.
* In 2025, the total is approximately 1.8 million, with females at roughly 1.1 million and males at 0.7 million.
* The data shows a steady linear increase over the 25-year period.
* By 2035, the total reaches approximately 2.6 million.
* By 2050, the total reaches its peak at approximately 3.6 million, with females accounting for roughly 2.2 million and males accounting for roughly 1.4 million.
* Throughout the entire projection, the female population consistently remains larger than the male population, maintaining a similar ratio as the total volume grows.
The increase in the older population is a key driver of projections of the future demand for care. The most comprehensive estimates of this demand are those available for England using the CPEC model developed by the Adult Social Care Research Unit (ASCRU) for the Department of Health in 2020. Their most recently published central projection uses the ONS principal projections (2018-based) for England. These assumed a 41% increase in the population aged 65+ and 72% in those aged 85+ between 2018 and 2038. Although gains in overall life expectancy stalled between 2017–2019 and 2022–2024, life expectancy for those aged 65+ increased by 5.7 weeks for females and 2.6 weeks for males, which suggests that the projected numbers of older people for 2038 are unlikely to be overestimated.
The CEPC model relies on the CARESIM microsimulation model (Morciano et al., Reference Morciano, Curry, Hancock and Wittenberg2022), which estimates care needs and how these are distributed between formal and informal care as well as between care in care homes and care provided in the client’s own home. Such estimates are dependent on a range of assumptions, including marital status, prevalence of disability, receipt of unpaid care and formal care services, home ownership rates and no significant changes in the mechanisms that determine how costs are shared between individuals and local authorities. These assumptions essentially uphold the status quo in terms of delivery and funding mechanisms, which is the most plausible prior, especially given the policy inertia of recent decades.
Another key driver of care needs among older people is the expected period they can expect to live without a limiting health condition, also known as disability free life expectancy (DFLE). In England, for the period 2022–2024, DFLE at age 65 averaged 11 years, while in Northern Ireland and Wales, it stood at 10 years (Office for National Statistics, 2024a). Although there has been some improvement in DFLE in England and Wales, the CEPC model (Hu et al., Reference Hu, Hancock, Wittenberg, Camus, Pauschardt and Coulson2025) suggests that the proportion of those in England aged 65+ who are unable to perform one IADL or have difficulty with at least one ADL without help will increase by 48% from 3.5 million in 2018 to 5.2 million in 2038. Those with severe disability, classed as those unable to perform an ADL without help, will rise by 49% over the same period from 1.7 to 2.5 million. Comparable increases in both publicly and privately funded care will be required due to these demographic pressures. However, the number of self-funders in care homes is expected to increase by 67% due to the growing proportion of care clients who are homeowners and therefore unlikely to be eligible for local authority support because the value of their housing equity exceeds the relevant capital limit.
A principal cause of a requirement for intensive care support for older people is dementia. LTC provided for those with dementia does not necessarily involve substantive healthcare costs: its costs are more likely associated with ADLs and specific issues such as behaviour management. In contrast, the costs associated with cancer, another condition whose prevalence increases sharply with age, are mainly healthcare costs and are therefore covered by the NHS commitment to provide healthcare free at the point of use in the UK. Under current funding arrangements, individuals who die from cancer are likely to experience much smaller reductions in their assets compared to those dying with dementia.
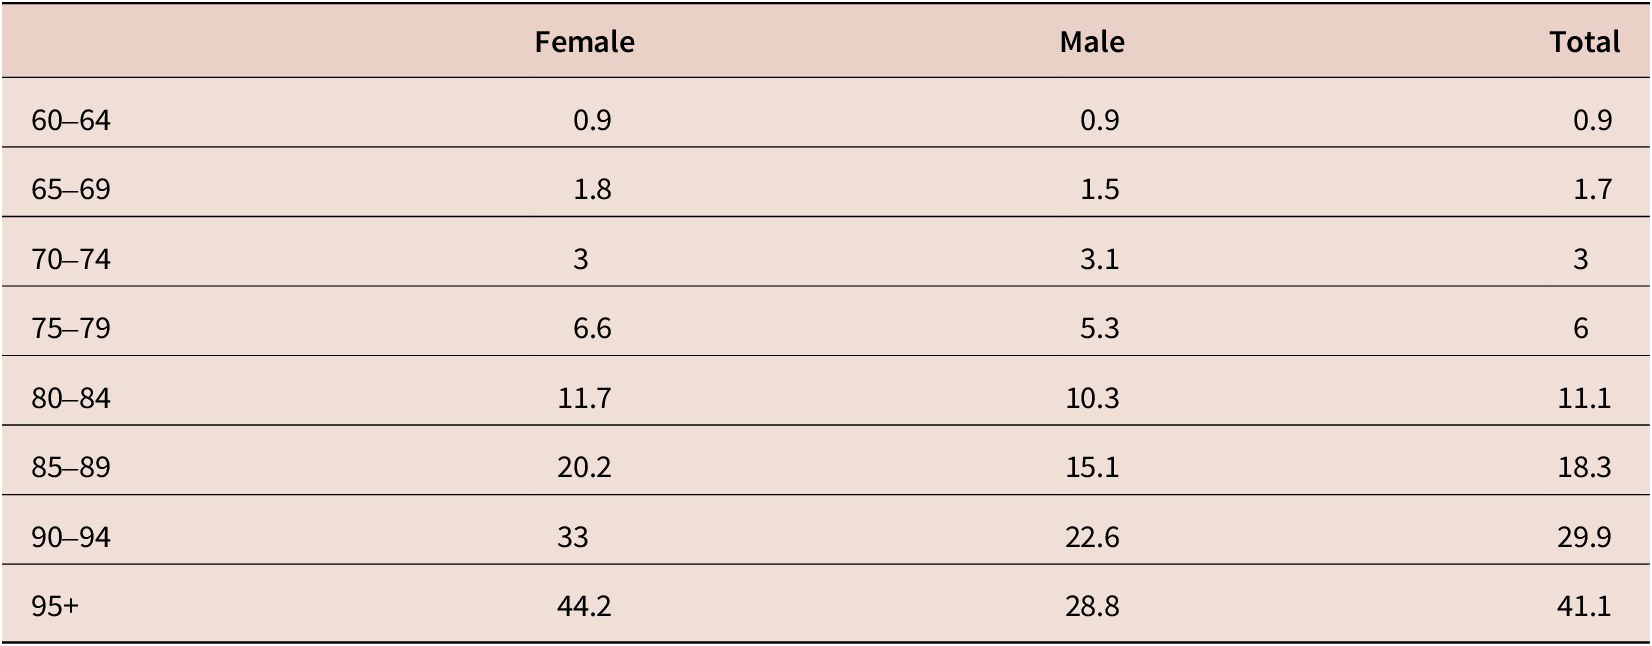
Dementia has one of the sharpest increases in age-related prevalence (see Table 1) (Prince et al., Reference Prince, Knapp, Guerchet, McCrone, Prina, Comas-Herrera, wittenberg, Adelaja, Hu, King, Rehill and Salimkumar2014). This disease is associated with increased, irreversible decline in functioning associated with either IADLs or ADLs. Clearly, ceteris paribus, increases in the number of oldest old, indicates a substantial rise in the number of people in the UK with dementia.
Prevalence of late-onset dementia by age (% of population)

Table 1. Long description
The table presents dementia prevalence across eight age brackets, categorized by Female, Male, and Total population percentages.
* 60 to 64: Female 0.9, Male 0.9, Total 0.9.
* 65 to 69: Female 1.8, Male 1.5, Total 1.7.
* 70 to 74: Female 3, Male 3.1, Total 3.
* 75 to 79: Female 6.6, Male 5.3, Total 6.
* 80 to 84: Female 11.7, Male 10.3, Total 11.1.
* 85 to 89: Female 20.2, Male 15.1, Total 18.3.
* 90 to 94: Female 33, Male 22.6, Total 29.9.
* 95 plus: Female 44.2, Male 28.8, Total 41.1.
The data shows a consistent exponential increase in prevalence with age, with females showing significantly higher rates than males in the oldest age categories.
Dementia is a progressive disease requiring increasing levels of care. Medium dependency includes symptoms such as wandering, agitation and confusion. Care often shifts to residential homes as symptoms worsen, as the person can no longer live independently without daily check-ins or structured environments. Safety risks, declining ADLs and caregiver burnout are frequently triggers for the transition to residential care.
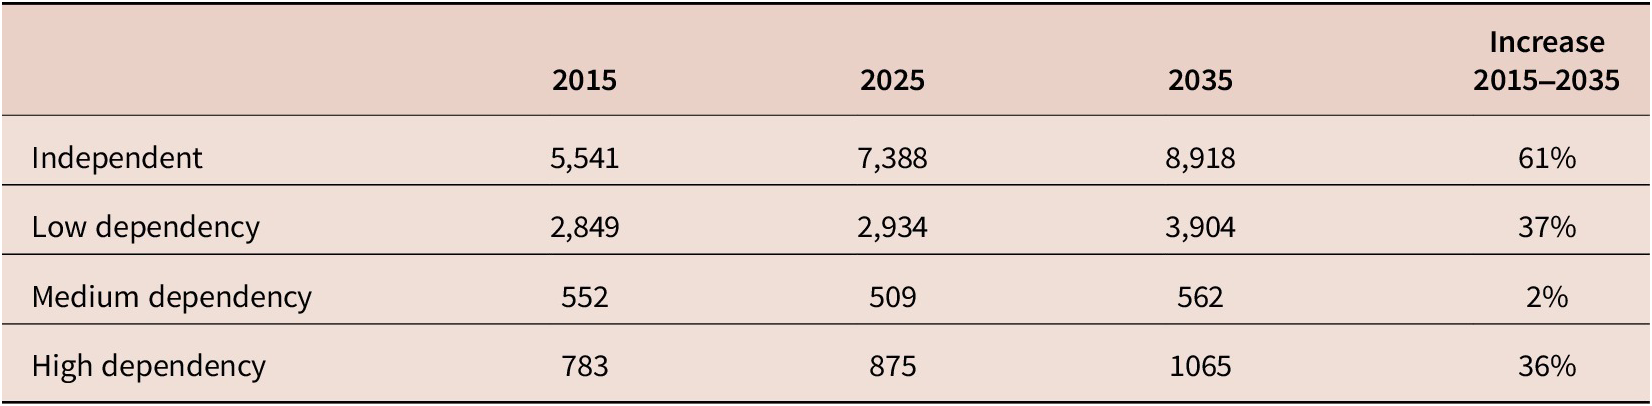
Kingston et al. (Reference Kingston, Comas-Herrera and Jagger2018) use the PACSim model to forecast care needs by level of dependency. The forecast includes those with dementia alone, with dementia and comorbidities and those without dementia. The estimates are shown in Table 2 and imply that by 2035, there will be 1.6 million medium or high dependency individuals in England. Inevitably, this will drive up the demand for appropriate settings, many of which will be residential.
Estimated numbers requiring care by level of dependency (Kingston et al., Reference Kingston, Comas-Herrera and Jagger2018)

Table 2. Long description
The table consists of five columns: Dependency Level, 2015, 2025, 2035, and Increase 2015–2035.
* Independent: 5,541 in 2015; 7,388 in 2025; 8,918 in 2035; representing a 61 percent increase.
* Low dependency: 2,849 in 2015; 2,934 in 2025; 3,904 in 2035; representing a 37 percent increase.
* Medium dependency: 552 in 2015; 509 in 2025; 562 in 2035; representing a 2 percent increase.
* High dependency: 783 in 2015; 875 in 2025; 1,065 in 2035; representing a 36 percent increase.
Whilst technological innovation may mitigate some of the pressures described here, recent evidence suggests that assistive technologies are less effective among those with significant frailty and high needs (Fotteler et al., Reference Fotteler, Mühlbauer, Brefka, Mayer, Kohn, Holl, Swoboda, Gaugisch, Risch, Denkinger and Dallmeier2022). Given that this is the group whose numbers are projected to grow most rapidly, it is unlikely that technological change will offset these pressures entirely, though the recent acceleration of AI technologies and robotics is likely to have some mitigating impact. Nevertheless, in the absence of evidence for such effects, the working assumption should be that there will be a large increase in care needs in the UK over the next few decades, driven primarily by the growth in the number of oldest old. Offsetting reductions in their levels of disability are likely to be unattainable. Care for older people is likely to remain labour intensive and meeting increased needs will require additional investment in supply, implying increased capital investment and further expansion of the workforce. In subsequent sections, we consider some of the issues that this prospect implies and some of the political difficulties that have been encountered in the quest to equate supply with demand in this sector. We begin with the most politically salient of these issues—the overall funding of social care for older people in the UK.
3. Funding LTC for older people
The design of policy relating to the funding of LTC for older people has been characterised by numerous false starts, political indecision and little progress. Since 1997, successive governments have attempted to solve the same problem: how to prevent those care clients who self-fund their care from facing ‘catastrophic’ wealth reductions. Exposure to this risk is a form of market failure: insurance markets that spread risks effectively in many parts of the economy have failed to do so in respect of LTC. This is true both in the UK and internationally. Private sector markets have generally failed to achieve significant scale except in countries where they are supported by stable, predictable government finance (OECD, 2020). Stable and predictable government funding has been notably absent in the UK.
The criteria for being required to self-fund depend on a comparison of the value of assets owned by the care recipient and the relevant ‘capital limits’. The origin of this approach goes back to the National Assistance Act 1948, which treated social care as a form of welfare assistance. It was therefore subject to means testing administered by local authorities. The mechanism established then remains largely intact.
If the asset value exceeds the ‘upper capital limit’, the individual is required to self-fund. If the value is below the ‘lower capital limit’, the local authority will pay all costs. Between the lower and upper limits, care clients are charged a ‘tariff income’ which is linearly tapered between the lower and upper capital limits. Table 3 gives the lower and upper capital limits for each of the home nations, assessed both for residential LTC and for non-residential care. These capital limits vary across the home nations, a topic to which we return, but each of the limits seems low relative to the current value of housing—one of the principal assets an individual is likely to hold.
Capital limits for means testing (2025/26)

Table 3. Long description
The first table covers Care homes (nursing and residential). It has four columns: Nation, Lower capital limit in pounds, Upper capital limit in pounds, and Notes.
* England: Lower limit 14,250; Upper limit 23,250. Capital below 14,250 is disregarded; between limits generates tariff income of 1 pound per 250 pounds; above 23,250 individuals self-fund.
* Scotland: Lower limit 22,000; Upper limit 35,500. Personal care is free, but accommodation costs are means-tested.
* Wales: Lower limit 50,000; Upper limit 50,000. Single capital limit where capital below 50,000 is disregarded.
* Northern Ireland: Lower limit 14,250; Upper limit 23,250. Thresholds mirror England.
The second table covers Non-residential care with the same four columns.
* England: Lower limit 14,250; Upper limit 23,250. Same rules as residential care.
* Scotland: Lower limit 22,000; Upper limit 35,500. Personal care is free; other support may be means-tested.
* Wales: Lower limit 24,000; Upper limit 24,000. Flat capital limit where capital below 24,000 is disregarded.
* Northern Ireland: Lower limit 14,250; Upper limit 23,250. Same as residential care; assessments may include income.
Note that social care policy is not ‘reserved’ to the Westminster Government. The devolved administrations in Wales, Scotland and Northern Ireland can design and fund their own social care systems. They can, and have, used their powers to determine the allocation of funding for those requiring care. Prior to devolution, funding arrangements were uniform across the UK: implementing their own social care policies has had the political side-effect of showing that Scotland and Wales, in particular, can follow a different path from Westminster, though their ability to do so is constrained by resources available, which are largely determined by an annual ‘block grant’ from Westminster.
The Blair government made the initial attempt to address the risks associated with the potentially catastrophic costs of LTC by setting up a Royal Commission into Long-Term Care in 1997. Its main recommendation was that ‘personal care’—washing, dressing etc. for those aged 65+ should be provided free and, like the NHS, paid for from general taxation. ‘Hotel costs’—room and board in a care home would have to be paid for by the care client. Nursing care—care that required the services of a qualified nurse was part of NHS provision and consequently would be free at the point of use.
Richard Lipsey, an economist who was a member of the Commission, objected to this main recommendation on the grounds that it would particularly benefit the wealthy. He proposed a more targeted means-tested support. He also argued that the Commission had underestimated the future costs of the free personal care policy. His argument held sway with the UK government, which rejected the proposal on the grounds of potential future costs. But the devolved parliaments in Scotland and Wales had just been established, and the Scottish Government, perhaps partly motivated by a desire to show it could take a different path from Westminster, decided to go ahead with the Royal Commission ‘free personal care’ proposal. Those care clients in Scottish care homes would continue to pay ‘hotel costs’—costs of accommodation and food—provided their assets exceeded the capital limit set by the Scottish Government but would receive a weekly payment to cover the cost of personal care. This payment was based on an estimate of average weekly personal care costs. Wales did not follow Scotland in offering free personal care. Instead, it mandated a large increase in the capital limit, thus reducing the share of those in care homes who have to self-fund. Each of the home nations agreed to make a weekly payment to care homes to cover the costs of nursing care.
The UK Government revisited the issue in 2010, asking Sir Andrew Dilnot to find a sustainable funding model that would spread risk more equitably. His inquiry (Dilnot, Reference Dilnot2011) proposed a form of partial insurance by recommending a lifetime cap on care costs of £35,000, with the state covering the tail risk if fees exceeded this amount. He also proposed raising the capital limit to £100,000, thus protecting the assets of those with modest levels of wealth. However, although these proposals were legislated in 2014, they were shelved in 2015 due to the severe fiscal constraints in place at that time.
In 2017, the May government proposed that individuals should continue to pay for their care until their assets fell to £100,000. It also proposed that capital limits should be applied to those receiving care at home, rather than only to those receiving care in a care home. This proved very unpopular because it was expected to lead to many more people having to sell their homes to pay for their care. Vilified in the press, the proposal possibly led to the loss of the Conservative Party’s parliamentary majority at the 2017 election.
In 2021, the Johnson Government announced the ‘Health and Social Care Levy’ to ‘fix social care once and for all.’ The proposal was a variant on Dilnot’s proposal with an £86,000 lifetime cap on care costs and an increased capital limit of £100,000 (Seely and Keep, Reference Seely and Keep2021). To pay for these changes, an increase of 1.25% in National Insurance rates, known as the Health and Social Care Levy, would be introduced. In 2023, the Levy was to become a separate tax. This would be a progressive tax, would promote generational equity by being applied to pensioners after 2023 and would help spread the risks associated with LTC. The Treasury estimated the reforms would cost around £5.4 billion over 3 years, with the Levy offsetting this cost. The scheme was introduced in April 2022 but scrapped 6 months later by the Truss government. The 2023 implementation date for the cap was pushed back to October 2025, but this was scrapped in July 2024 by the incoming chancellor, Rachel Reeves. Following this, yet another review was instituted—the Casey Commission—focussing on the development of a National Care Service in England and with the intention to produce a final report in 2028. This implies that the UK Government will have spent at least 30 years considering proposals to spread the financial risks associated with social care but failed to implement a sustainable policy.
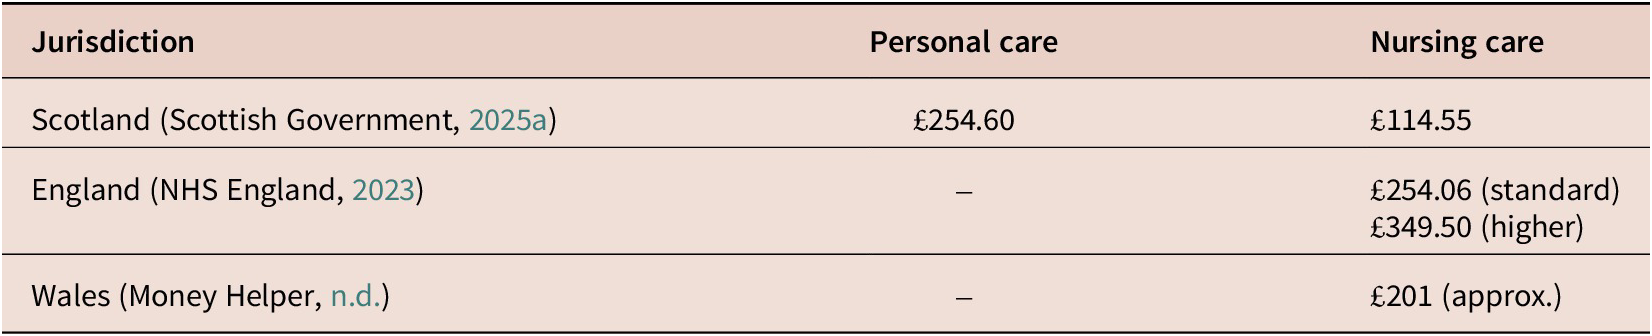
Aside from the differences in capital limits, there are also significant differences across the UK in the financial support for care home residents and those receiving care at home. Inevitably, these differences have distributional consequences. Weekly payments in 2025/26 for personal care and nursing care for those in care homes are shown in Table 4. Those requiring personal care are most generously treated in Scotland, but the difference is eroded if nursing care is required, since both England and Wales make more generous nursing care payments.
Weekly payments for personal care and nursing care in care homes 2025/26

Table 4. Long description
The table consists of three columns: Jurisdiction, Personal care, and Nursing care.
* Scotland (Scottish Government, 2025 a): Personal care is £254.60 and Nursing care is £114.55.
* England (N H S England, 2023): Personal care is not listed (indicated by a dash). Nursing care has two rates: £254.06 (standard) and £349.50 (higher).
* Wales (Money Helper, n.d.): Personal care is not listed (indicated by a dash). Nursing care is approximately £201.
Both England and Wales provide weekly payments to cover nursing care costs. These are substantially more generous than is the case in Scotland (see Table 4). However, it is important to note that provision of personal care at home is means-tested in England and Wales but free in Scotland. Those receiving personal care in their own home would have their costs fully covered, irrespective of their value.
These differences are difficult to reconcile, given that nursing costs are likely to be broadly similar across the UK. They perhaps suggest that the Scottish Government has constrained weekly nursing care payments due to its exposure to personal care costs that are not available in England or Wales.
The assignment of capital limits and the availability of different levels of support for personal and nursing care across the UK reflect differences in political response to the distributional implications and fiscal constraints that the various governments face in providing financial support for LTC. Scotland implicitly accepted the notion that the costs of meeting LTC needs should be met from general taxation and available to all, irrespective of income or wealth. It initially restricted the policy to those aged 65+ but extended it to all those eligible and aged 18+ in 2019. In contrast, the Welsh Government policy of increasing capital limits was intended to benefit those with slightly more wealth, who would consequently find the costs of care most burdensome. In England, increases in capital limits have, as we have seen, been recommended in various reviews, but the political consensus needed to ensure implementation has proved illusory. Changes to the charging regime necessarily benefit a small section of the electorate, most of whom do not anticipate their future need for LTC. In contrast, the costs are evident to the much larger group of voters whose taxes will be increased to pay for care provision. In the absence of a national consensus on the need to insure against catastrophic care costs, it is therefore invariably to the electoral advantage of opposition parties to obstruct policies that extend care provision. The lack of such opposition in the Scottish Parliament in 2001 may have reflected a desire to follow a distinctive path from that in the rest of the UK, as mentioned previously. But it may also have partly derived from the less binding fiscal constraints faced in Scotland, due to the relative generosity of the Barnett Formula.
The inter-generational aspects of the political economy of care are also relevant. Those paying increased taxes to pay for care provision will typically be younger and more numerous voters, while the beneficiaries are fewer in number and mainly older. And those older people are more likely to have greater volumes of housing and pension wealth than the young. Unfortunately, the most recent comprehensive wealth data from the Office for National Statistics cover the period 2020–2022 and are no longer treated as National Statistics (Office for Statistics Regulation, 2025). But the Housing Survey of England suggests that among those aged 16–34, 31% are owner-occupiers, while 79% of those aged 65+ fall into this category. And among this older age group, 74% own their house outright. Provision of care insurance funded by general taxation thus implies net transfers from relatively poorer younger households to older wealthier households. Whereas similar transfers seem to be accepted in respect of health care and the NHS, politicians have failed to overcome such distributional arguments in respect of LTC.
Having explored some of the issues relating to the financing of care provision, we now consider the political economy of the components of the supply of social care to older people.
4. The labour market for care workers
Unfortunately, there are no comprehensive official data on the social care labour market for the UK as a whole. Skills for Care (SfC) maintains the Adult Social Care Workforce Data Set (ASC-WDS) for England, which comes under the oversight of the Office for Statistical Regulation, and its report (Skillsforcare, 2025) is an accredited official statistic. Its most recent report suggests that there were 1.24 million full-time equivalent (FTE) filled posts in social care for adults in 2024/25. The NHS in England employed 1.3 million FTE posts in 2023 (Office for National Statistics, 2024). Measured in FTE, adult social care and the NHS employ around the same number of staff. While the number of posts in adult social care and the NHS are therefore roughly equal and the staff frequently operate together, especially in relation to care of older people, the labour market for care workers is substantially more volatile than that of NHS workers.
Care staff have high rates of turnover. The turnover rate for directly employed staff was estimated at 23.1% for 2024/25, implying that around 335,000 left their posts over that period. In contrast, NHS staff turnover is consistently around 10%–11% (NHS England, 2025). Unsurprisingly, vacancy rates in adult social care are also relatively high. In 2024/25, according to SfC, they were around 7%—equivalent to around 111,000 posts, having fallen from a peak of 10.5% in 2021/22.
Pay rates in adult social care are low. SfC estimates that 23% of care workers received the National Living Wage (NLW)—the minimum wage for those aged over 21—in 2024/25. Median hourly pay for care workers was £12.00, only 56 pence above the NLW at that time. Pay progression is also poor. Care workers with 5 or more years’ experience typically earn only 33 pence more than those with less than a year of experience. Upward pressure from the NLW combined with severe restraints on local authority care contracts means that rewarding workers for experience or taking on new responsibilities has become increasingly difficult. Pay for the bottom decile of the care worker pay distribution increased by 71% between 2016 and 2024/25, following the introduction of the NLW, while pay for the top decile only increased by 55%.
In recognition of the threat that poor working conditions pose to the provision of adult social care, the Scottish Government passed the National Care Service (Scotland) Act in 2025, which establishes a legally binding national pay scale for care workers similar to those in the NHS. In 2025, the Scottish Government mandated a minimum hourly rate of £12.60 for all adult social care workers in the private and third sector and allocated £125 m to local authorities to pay for this uplift (Scottish Government, 2024). England is following a similar route via a ‘Fair Pay Agreement’. The NLW is the current base pay rate for care staff in England.
With terms and conditions relatively poor, many care enterprises have hired workers from abroad who are willing to accept these conditions. To work in the UK, candidates are required to have a work visa granted by the Home Office. Rules governing work visas, and particularly those for which care workers may be eligible, have changed frequently in recent years. Due to labour shortages in the sector, care for older people has become closely affected by changes in UK immigration policy. Migration Observatory (2025) estimates show that from a level of 788,000 in 2019, immigration to the UK rose to 1.4 million in 2023, before falling back to 898,000 in the year to June 2025. Home Office (2025) data show that visas granted for care workers showed a similar pattern.
In 2023, around 89,000 care worker visas were granted. This was peak care worker overseas recruitment. While care worker immigration rose sharply, over the same period 22,900 nurses and midwives were recruited from abroad, in line with past trends. Visas granted to care workers expanded rapidly in 2022 (see Figure 2) before falling sharply in 2024, while the number of visas granted to a more regulated, though consonant, profession did not respond to the marked changes in visa rules over this period.
Care worker visas granted 2021–2024.
Source: Home Office

Figure 2. Long description
The Y axis represents Visas Granted by Home Office, ranging from 0 to 35,000 in increments of 5,000. The X axis lists quarterly intervals from 2021 Q 1 to 2024 Q 1.
* Care Workers (dark blue line): Remains at near-zero from 2021 Q 1 through 2022 Q 1. It begins a sharp exponential increase starting in 2022 Q 2, peaking at approximately 29,500 in 2023 Q 3. This is followed by a steep decline to roughly 3,000 by 2024 Q 1.
* Nurses and Midwives (orange line): Shows a relatively stable trend, fluctuating between 3,000 and 7,500 throughout the period. It starts at approximately 5,000 in 2021 Q 1, reaches a minor peak of about 7,500 in 2022 Q 3, and ends at its lowest point of approximately 3,000 in 2024 Q 1.
The two lines intersect in 2022 Q 3, after which Care Worker visas significantly outpace Nurses and Midwives until the final quarter shown.
Rapid international recruitment also changed the demographics of care sector workers. The proportion of workers with British nationality decreased from 83% to 69% between 2021/22 and 2024/25. The reliance of the care sector on non-British workers increased sharply over this period.
The UK Government response to the generally high levels of net immigration has been to tighten the restriction on the granting of visas. The immigration White Paper (June) 2025 proposed that the existing exemption for care workers and senior care workers would be withdrawn and that they should not be eligible for Skilled Worker visas (McKinney and Gower, Reference McKinney and Gower2025). Applications from abroad for core care worker roles were no longer permitted from July 2025. The government argued that this was part of its manifesto commitment to reduce reliance on overseas workers by developing workforce plans for sectors such as social care (Home Office, 2025).
Reaction from the care sector to this proposal was extremely negative. Employers and unions argued that domestic recruitment could not be ramped up at short notice and that a lack of international recruits would trigger a crisis in the sector. SfC had projected a need for 470,000 additional social care workers by 2040 to keep up with the projected growth in demand by those aged 65+ (Skills for Care, 2025b). Additional restrictions on the supply of care workers will make this target more difficult to achieve.
Recruitment in the care sector has been highly dependent on migration rules in recent years. While the need to increase capacity in social care provision by recruiting more care workers is widely accepted, its realisation has been stalled by the political imperative to reduce immigration. This implies that, with new restrictions on overseas recruitment for care workers, the sector is facing a significant change: it must shift from reliance on migrant labour to building a sustainable domestic workforce, improving conditions and adjusting cost structures—all while meeting rising demand from an ageing population. This seems unlikely without significant improvement in the terms and conditions offered by the sector.
5. Capital investment in social care
The care home sector in the UK is largely privately owned, with around 83%–85% of care home beds operated by for-profit providers. Large corporate chains are important providers within the market, particularly for homes that provide nursing care. The sector has become increasingly financialised (Competition and Markets Authority, 2017a), with private equity playing a substantive role and providers sometimes relying on complex funding models involving high debt and investor returns.
Social care may exist mainly in the private sector, but it has close links with the public sector—both local government and the NHS. The need for increased capacity in the sector has become apparent due to its indirect effects on the provision of services by the NHS. Delayed discharges reduce productivity in the health service by lowering patient throughput. This is attested by the high number of ‘delayed discharges’ from hospitals. NHS England data for March 2025 showed that holdups in social care were responsible for 23% of delays in discharging individuals from an acute hospital for 14 days or more. These are individuals whose health treatment is complete, but who remain in hospital because no appropriate social care setting is available.
Investment in the sector is weak, partly due to the structure of the market for care home places. Local authorities are key players in the market because they are obliged to support care clients whose wealth falls below the capital limit that triggers public assistance towards care costs. Local authorities are therefore major purchasers of care services and use their monopsony power to drive down care charges. The fee they are willing to pay is frequently below cost. In 2023/24, local authority fees were 11% below the self-funder rate (Grant Thornton, 2025). To remain viable, care suppliers therefore charge self-funders above cost to cross-subsidise local authority clients. An alternative strategy that is feasible in relatively affluent areas is to withdraw from supporting local authority clients entirely.
The demand side of the market for intensive care provision therefore has an unusual structure with local authorities having some monopsony power due to their ability to ‘bulk buy’ care provision, whereas self-funders are atomistic, with no ability to influence the market and often lacking in information on charges and fees. The abnormal structure of the market has attracted the attention of the Competition and Markets Authority. Its report (Competition and Markets Authority, 2017b) highlighted lack of pricing transparency and the cross-subsidisation from self-funders to local authorities.
In Scotland, there is a single contract between local authorities and independent care home providers known as the National Care Home Contract. It is instrumental in setting standard fees and contract terms across the whole country. This increases the transparency of the process but adds to the buyer’s control of the market and poses particular problems for providers in high-cost areas. In 2023–2024, the weekly residential care fee across all Scottish local authorities was £719 and £818 if nursing care was included.
Increases in labour costs, such as those associated with the NLW and National Insurance hikes, have deterred investment in social care capacity. Policy uncertainty has added to the risks investors face. Many investors have scaled back expansion plans, particularly in less affluent areas that are heavily reliant on local authority placements. Overall, 56% of councils in England were impacted by provider closures, cessation of trading or contract hand-backs between Nov 2024 and May 2025 (ADASS, 2025). Facing difficult funding settlements, local authorities in less affluent areas have tended to promote domiciliary rather than residential care, partly to reduce costs.
Given the demographic pressures, increased residential care capacity will be required unless there is a very substantial shift from residential to domiciliary care. For example, based on the demographic projections shown in Figure 1 and assuming the proportion of those aged 85+ resident in care homes remained at 10.8% from 2025 to 2045, a further 144,000 additional care home places would be required, more than 6000 per annum. Only if the share of those aged 85+ resident in care homes fell to 6% would existing capacity be sufficient and would imply that the projected increase in the social care labour force would largely be required to provide domiciliary care.
There are no official estimates of the number of care home places available in the UK. Knight Frank (2025) estimated that the supply of places in UK care homes increased by 2.9% between 2014 and 2024 to 480,000, while the UK population aged 65+ grew by 15.4% and the population aged 85+ by 16.4% (Office for National Statistics, 2024b).
The demand for care home places has been moderated by the switch from provision of social care in residential settings to care at home. This partly reflects understandable wishes of care clients to be supported at home rather than in a care home and also by cost-cutting incentives faced by local authorities. However, given the demographic pressures and unless there are further substantial increases in the share of older people supported at home, additional investment in care home places will be necessary.
Capital spending on care facilities is longer term in nature and thus perhaps less politically prescient than shortages of care workers. The structure of the industry is not well understood, partly because it lacks the comprehensive statistical infrastructure that surrounds the NHS. It also has a highly fragmented structure with no clear political voice. Perhaps because of these circumstances, policymakers have not prioritised addressing how the demand for care home places in the future.
6. Unpaid care
At the 2021 Census, 4.7 million people were providing unpaid care to adults in England, 311,000 in Wales and 222,000 in Northern Ireland. A further 600,000 were recorded as providing such care at the Scottish 2022 Census. The total of 5.86 million unpaid carers in the UK dwarfs the numbers employed in both the social care and the NHS across the UK. Unpaid care provides a vital part in supporting older people’s health and well-being, yet it has received relatively little attention in policy debates around population ageing. Nevertheless, issues such as the effect on the labour market of the substitution or complementarity between paid and unpaid care, its impact on the health and well-being of the carer and potential consequences for other demands on public services should be of vital policy interest.
Unpaid care is spread across ADLs and IADLs, with many carers lacking training in their provision. Large-scale surveys such as the UK Household Longitudinal Study (UKHLS) and the Family Resources Survey do not typically distinguish between different forms of care. Time use surveys such as the UK Time Use Survey (UKTUS) use time diaries to give a more nuanced picture of types of care provided. These diaries also provide a more detailed record of the allocation of time to care activities, compared with the large-scale surveys. The UKTUS is also central to the construction of the UK Household Satellite Accounts by the Office for National Statistics, which provide estimates of the value of unpaid services within the household that sit outside the national accounts. Recently, ONS estimates (Office for National Statistics, 2025b) suggest that the GVA of unpaid adult care in the UK was worth £91.1bn, equivalent to 3.5% of GDP. Between 2014 and 2023, the satellite household accounts suggest that the volume of adult social care within households increased by 7%.
A somewhat different picture emerges from estimates produced by Carers UK (Petrillo and Bennett, Reference Petrillo and Bennett2024), who use successive censuses as a basis for valuing the contribution of unpaid care to adults. The census uses a much broader approach to measuring hours devoted to care. There are only three categories—up to 19 hours, 19–49 hours and 50+ hours. Assumptions are made about the number of hours supplied within each band. These are conservative in the sense that assumed mean hours within bands are well below the midpoints of the bands and those claiming 50+ hours are allocated only 50 hours. Nevertheless, the authors suggest that the value of unpaid care to adults in England and Wales in 2021 was £162bn, equivalent to 7.8% of UK GDP in that year and £6bn more than was spent on the NHS in England.
The difference between these estimates of the value of unpaid care is puzzling. Possible explanations include sampling errors in UKTUS, differences in the wording of questions relating to care etc. Note that both the Carer’s UK and the satellite accounts estimate of the contribution of unpaid care to GVA includes care given to all adults, not just those aged 65+. Even though there is a very significant difference between the estimates, it may seem reasonable to conclude that unpaid care provision adds significantly to national production, subsidising the formal economy while potentially limiting opportunities for those who provide it.
Neither of these methods accounts for the opportunity costs of providing care that might include hours reductions, early withdrawal from the labour market and/or wage penalties. Hollingsworth et al. (Reference Hollingsworth, Ohinata, Picchio and Walker2021) find some evidence of increased labour supply when the state increases the supply of paid-for care, while Schmitz and Westphal (Reference Schmitz and Westphal2017) find that care provision reduces the probability of working full-time by around 4%. Neither do they measure indirect costs of caring that relate to both physical and mental health. For example, Schulz and Beach (Reference Schulz and Beach1999) found increased mortality risk among caregivers who found the caregiving experience particularly stressful, while Le and Ibuka (Reference Le and Ibuka2023) found that caregiving led to adverse mental health outcomes, particularly for females.
Females are the predominant caregivers. Evidence for this is provided by the Census. Whereas it only classifies care intensity at three levels, the associated details on age group and gender provide important insights into patterns of caregiving in England and Wales. Figure 3 gives the share of each 5-year age group by gender and intensity that are providing care.
Share of age group providing care by gender, age and intensity of care from 2021 census in England and Wales.
Source: Office for National Statistics (2023b). Unpaid care by age, sex and deprivation, England and Wales

Figure 3. Long description
A stacked bar chart with the Y-axis representing the Percentage of Age Group Providing Care from 0% to 12% and the X-axis representing Age Group of Carer in 5-year increments from 05 to 17 up to 90 plus.
For each age group, two stacked bars are shown: orange-toned for females and blue-toned for males. Each bar is divided into three intensity levels: 19 hours or less (lightest shade), 20 to 49 hours (medium shade), and 50 or more hours (darkest shade).
Key trends include:
* Care provision follows a bell curve, rising from near 0% in the 05 to 17 group to a peak in the 55 to 59 group, then declining.
* At the peak (55 to 59), approximately 10% of females provide care compared to roughly 6.5% of males.
* Females provide a higher total percentage of care than males in every age group until age 80.
* In older age groups (80 to 84, 85 to 89, and 90 plus), the gender gap narrows or reverses, with males in the 90 plus group providing more care (around 3%) than females (around 2%).
* The proportion of high-intensity care (50 or more hours) increases with age, becoming the dominant segment for both genders from age 75 onwards.
Unpaid care is more prevalent among women than men, particularly in early to late middle age. After the age of 65, care is more evenly distributed by gender. Care intensity increases with age. This is particularly true for men, with the relatively young unlikely to provide more than 19 hours of care per week, while for men aged 80+ high intensity (50+ hours) of care is more likely. Middle-aged women are more likely to be ‘sandwich carers’, supporting dependent children and caring for parents. They are also more likely to live in households where at least one person is working. Where they work themselves, they are more likely to be impacted by factors such as impaired career progression, reliance on hours flexibility and general reductions in hours. Impacts include chronic stress, anxiety and depression (Reid and Hardy Reference Reid and Hardy1999). These are also characteristic of the wider carer population (Hirst, Reference Hirst2005).
Although the Care Act 2014 gives carers in England legal rights to assessment and support, evidence from audits, complaints and carers’ surveys shows that provision is highly variable, often minimal and constrained by funding pressures, leaving many carers—particularly working-age and sandwich carers—without effective support. The evidence suggests that for caregivers to maintain contact with the labour market, formal care services should be flexible and acceptable to care recipients (Brimblecombe et al., Reference Brimblecombe, Pickard, King and Knapp2017). Recent evidence suggests that, despite the Care Act 2014,
inadequate funding limits its effectiveness. Increased economic hardship, insufficient Carer’s Allowance and rising unmet care needs disproportionately affect disadvantaged groups, younger carers and women, worsening mental and physical health. (Taylor et al., Reference Taylor, Wainwright and Vseteckova2025)
The Carer’s Allowance is a UK-wide benefit which currently pays £83.30 per week. Eligibility conditions include providing more than 35 hours of care per week for someone receiving the daily living component of PIP or Attendance Allowance and earn less than a weekly earnings threshold.
Among the home nations, Scotland has perhaps the most explicit and comprehensive unpaid-carer policy architecture due to the Carers (Scotland) Act 2016. Carers have a statutory right to an Adult Carer Support Plan (Scottish Government, 2025b) as specified in the National Carers Strategy (2023–2030) (Scottish Government, 2022). This sets out commitments on, for example, well-being, income and employment and respite breaks. The Scottish Government has also supplemented Carer’s Allowance by £587, paid in two installments.
Rationing has led to a tightening of assessment procedures associated with eligibility for personal care. Those with ‘moderate’, rather than ‘substantial’ or ‘critical’ are now less likely to receive care. The outcome is a growth in unmet need. Based on data from the English Longitudinal Study of Ageing, Age UK (Reference Age2024) estimates that there are 2 million older people in England with unmet care needs. Local authorities have increased pressure on unpaid carers to make up the shortfall (Carers UK, 2018). Downward pressure on costs leads to supply-side instability with high turnover among many small providers, which reduces opportunities for improved co-ordination.
7. Conclusion
Adult social care provision in the UK faces significant challenges caused by population ageing coupled with the limiting conditions whose prevalence increases with age. Meeting this demand without escalating levels of unmet need requires a coherent policy framework that jointly addresses the various components of care supply—paid and unpaid care provision and the capital investment necessary to support those with significant care needs. The political economy of implementing this framework is extremely challenging. Different approaches to equity generate diverse approaches to funding: if one argues that the private costs facing a dementia sufferer should be no different from those of someone diagnosed with cancer, then a more universal approach to funding is called for. On the other hand, if one argues that poorer households should not be expected to contribute to the financing of social care for the wealthy via general taxation, then a more targeted approach is implied. Similarly, there is a case that the young should not be expected to subsidise the old given that their access to higher education and the housing market is more costly than that of previous generations. Between the fully public and the fully private approaches, there are a myriad of variants of targeted support that will benefit some parts of the electorate at the expense of others. In each case, the resulting loss aversion is likely to lead to stasis.
The UK’s fiscal difficulties have also posed tough budgetary and political choices for the UK Government. Reducing the funding available to local government is a relatively easy political choice that rebalances political power to the centre from the periphery but indirectly makes the provision of social care more difficult because local authorities are the main source of funding for those unable to meet their care costs.
Policy formation is also hampered by the weakness of social care data and the anomalous status of some aspects of care provision—such as the value of unpaid contribution made by friends and family in supporting those with care needs, which lies outside the national accounts. This is a vital, but poorly understood, component of overall care provision that makes it difficult to predict how it is likely to evolve as care needs increase.
Attracting sufficient labour into providing care has been a consistent challenge. Population ageing will increase demand for care workers, which will be rendered more difficult to achieve given recent changes to migration policy. And investment in the provision of care facilities is failing to match likely future demand unless there is a substantial switch to providing care at home rather than in care facilities. Local authority funding is also likely to be influential in how the ‘balance of care’ evolves. However, uncertainty over its future direction will likely inhibit the private sector from significant investment in residential care facilities.
The UK’s record in establishing successful policies relating to social care is not strong. There has been a long record of failure by successive UK Governments to mitigate the financial risks associated with LTC provision. The priority to offset the distributional consequences of what can be ‘catastrophic’ care costs has long been recognised but several initiatives, each presenting a different solution, have failed to become established policy. The issue of funding is a distributional one that will largely affect the beneficiaries of the person receiving care. Issues relating to the supply of care, with their implications for the availability of labour and capital, are more fundamental. If these issues remain unresolved, the ageing population will inevitably drive up demand for care, making rising levels of unmet need increasingly likely.




 Open access

