I. INTRODUCTION
Zinc oxide (ZnO) with direct wide band gap energy of 3.37 eV has been widely studied for optoelectronic devices,Reference Abdullah, Norazia, Shaari and Mandeep1 chemical sensors, piezoelectric transducers, transparent electrodes, photocatalysts, electroluminescent devices, ultraviolet laser diode applications, optical and electronic applications,Reference Ilican, Caglar and Caglar2, Reference Peng, Chen, Wang, Hu, Yu and Zhu3 field-emission, high sensitivity gas sensors, biosensors, dye-sensitized solar cells (DSSCs),Reference He, Zheng, Tang, Zhao and Lu4 and antibacterial purposes.Reference Akhavan, Azimirad and Safa5 ZnO also has large exciton-binding energy at room temperature (60 meV), excellent thermal stability, high mechanical strength and high chemical stability.Reference Abdullah, Norazia, Shaari and Mandeep1, Reference Peng, Chen, Wang, Hu, Yu and Zhu3 It can be synthesized and fabricated as a thin film using various methods such as chemical bath deposition (CBD), spray pyrolysis, sol–gel spin coating, pulsed laser deposition (PLD) and chemical vapor deposition (CVD).Reference Ilican, Caglar and Caglar2 For growing 1-dimensional (1D) ZnO nanostructures for DSSCs, CBD has been considered as an efficient and low-cost technique to synthesize and fabricate the ZnO thin film. CBD also involves very simple experimental work and produces very small crystal size with high porosity suitable for depositing nanocrystalline films.Reference Hodes6
Meanwhile, carbon nanotubes (CNTs) have been one of the most efficient materials due to their superior electronic conducting properties, good thermal/chemical stability, high mechanical strength, high aspect ratio and large effective surface area.Reference Sun, Gao and Liu7–Reference Centi and Perathoner10 Originally discovered in 1991,Reference Peng, Chen, Wang, Hu, Yu and Zhu3, Reference Huang, Yeh, Chang, Hsieh, Ku and Lai11 CNTs can be imagined as rolled up sheets of graphene-formed single-walled carbon nanotubes (SWCNTs) or multiwalled carbon nanotubes (MWCNTs).Reference Centi and Perathoner10 CNTs have been implemented in various applications including photonics, electronic and acoustic devices, chemical and gas sensors,Reference Peng, Chen, Wang, Hu, Yu and Zhu3 polymer electrolyte membrane fuel-cellReference Centi and Perathoner10 and DSSCs.Reference Zeng, Nian and Lee9 For improving the development of ZnO thin films application in DSSCs, an alternative was proposed to combine two materials in one thin film. Recently, a combination of ZnO and CNTs as a nanocomposite thin film has attracted much attention in improving the devices efficiency. Zhu et al.Reference Zhu, Wei, Wang and Wu12 stated that a combination of CNTs and electron donors help in harvesting solar energy and convert it into electricity. Therefore, it has been introduced in the organic photovoltaic devices and photoelectrochemical solar cells developed by them. Well-spaced and symmetric structures of SWCNTs and one-dimensional ZnO nanotubes produced great thin films to react over a broad solar spectrum. In DSSC applications, Zeng et al.Reference Zeng, Nian and Lee9 fabricated ZnO and vertically aligned CNTs as a nanocomposite thin film by implementing thermal chemical vapor deposition method. The obtained thin film consists of vertically aligned CNTs, which increase the contact area between ZnO nanostructures and the dye. Efficient electrical conductivity and high surface area of the thin film have increased the DSSC power conversion efficiency up to 1.94%. Moreover, Chang et al.Reference Chang, Cheng, Yu, Yao, Lee and Ko13 have successfully synthesized and fabricated ZnO-MWCNTs using sol–gel method where mesoporous thin films were fabricated as photoelectrode of DSSCs. High specific surface area of the nanoparticles thin film and conductive path provided by the MWCNTs have increased the solar cell efficiency up to 2.70%. Meanwhile, Akhavan et al.Reference Akhavan, Azimirad and Safa5 combined two popular methods; sol–gel and dip-coating to synthesize and fabricate the thin films of functionalized and unfunctionalized MWCNTs-ZnO. The formation of carbonaceous bonds between ZnO and MWCNTs nanocomposite thin film detects the photoinactivation of Escherichia coli (E. coli) bacteria. Photocatalytic performance of the thin film has improved due to efficient charge transfer through Zn–O–C atoms.
In this article, the synthesis of ZnO/nonacid-treatment SWCNTs using CBD method was proposed as a simple and low-cost method as compared with other methods. The produced thin films are characterized using various analytical methods including x-ray diffraction (XRD), field-emission scanning electron microscopy (FESEM), energy-dispersive x-ray (EDX) unit, transmission electron microscopy (TEM) and Fourier transform infrared spectroscopy (FTIR). Consequently, the structural and chemical properties of the nanocomposite thin films were evaluated and compared in terms of improving their application for DSSCs.
II. EXPERIMENTAL DETAILS
A. Preparation of ZnO-SWCNTs nanocomposite thin films
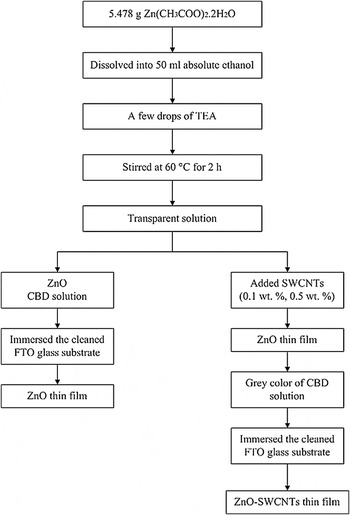
ZnO-SWCNTs nanocomposite thin films were prepared using a CBD method. 5.487 g of zinc acetate dihydrate [Zn(CH3COO)2⋅2H2O] was dissolved into 50 mL absolute ethanol (C2H5OH) before adding a few drops of triethanolamine (TEA). Same solution of similar concentration was also prepared in another beaker. The two solutions were transparent after 2 h of continuously stirring at 60 °C. Non-acid treatment SWCNTs were added into the first and second solutions by 0.1 and 0.5 wt%, respectively. The mixtures were then continuously heated and stirred at 60 °C for 8 h to dissolve all compounds as CBD solutions. The solutions now turned into gray in color due to the carbon effects. In the meantime, fluorine-doped SnO2 (FTO) glass sheets were cleaned for 10 min in an aqueous solution of acetone and methanol using an ultrasonic cleaner, rinsed with deionized (DI) water and dried on hotplate for 10 min at 80 °C. The cleaned FTO glass sheets were then immersed horizontally in the prepared CBD solutions. The beakers were kept in the oven at 60 °C. After 24 h deposition time, the FTO glass sheets covered with ZnO-SWCNTs thin films were taken out from the solutions, rinsed with DI water and dried in air at room temperature. The obtained thin films were then annealed in air at 400 °C for 30 min. Figure 1 summarized the process taken to prepare the ZnO and ZnO-SWCNTs thin films.
Flowchart of preparing the ZnO and ZnO-SWCNTs thin films.

B. DSSC fabrication
The annealed thin films were immersed in 0.5 mM ethanolic N719 dye solutions to prepare for the photoanode of ZnO and ZnO-SWCNT-based DSSCs. After 24 h immersion time, the photoanode was rinsed in ethanol to remove any excess dye. The platinum counterelectrode was prepared by depositing a thin layer of platinum paste onto the cleaned FTO substrate by screen-printing technique. The platinum layer was then dried at 100 °C before annealing it at 400 °C for 1 h. The photoanode and counterelectrode were sealed together with a parafilm layer as one unit of a solar cell. The inner space of the cell was then injected with iodolyte MPN 100 (Solaronix SA).
C. Characterizations
Crystallinity and orientations of the annealed ZnO-SWCNT thin films were characterized using x-ray diffractometer (XRD; Siemens Bruker model No. D-5000, TX) with Cu Kα irradiation (λ = 1.5406 Å) and Bragg angle, 2θ ranged from 20° to 60°. Structural morphologies of the films were observed by field emission scanning electron microscopy (FESEM; Carl Zeiss model SUPRA 55VP, Göttingen, Germany) equipped with energy-dispersive x-ray (EDX) unit. A transmission electron microscopy (TEM; Phillips model No. CM21, Helmholtz-Zentrum, Berlin, 20–200 kV) was used to determine the internal structure of ZnO-SWCNTs. Fourier transform infrared spectras were recorded by a spectrometer (FTIR; Perkin-Elmer model Spectrum BX) to determine the bond position inside the thin films. The photocurrent density-voltage (J-V) curves of the DSSCs were recorded using an electrochemical impedance spectroscopy (EIS) unit supported with GAMRY-Physical Electrochemistry (PHE200) interface. The measurements were conducted under 1000 W/m2 illumination (1.5 AM) of OSRAM halogen lamp (50 W).
III. RESULTS AND DISCUSSION
A. XRD analysis
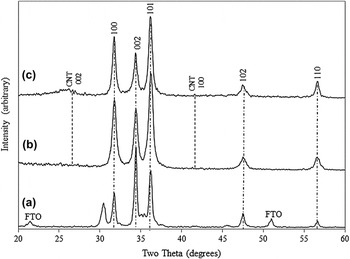
XRD analysis was conducted to investigate the crystal structure and orientation of pure ZnO and ZnO mixed with 0.1 and 0.5 wt% SWCNTs as shown in Fig. 2. The three diffraction peaks match very well with the databases of ZnO and ZnO-SWCNTs given by Joint Committee on Power Diffraction Standards (JCPDS) No. 01-089-0510 and 00-048-2316, respectively. The diffraction angles at 2θ = 31.63°, 34.38°, 36.18°, 47.4°, and 56.55° attribute to (100), (002), (101), (102), and (110) hkl planes of ZnO hexagonal wurtzite structure. Moreover, carbon peaks at 26.1° and 41.5° correspond to the hkl planes (002) and (100), respectively. However, the peak at 41.5° was not clear due to higher amount of ZnO mixed with SWCNTs. The prominent peak (002) of pure ZnO was selected as preferential orientation along c-axis. From the XRD patterns, ZnO nanostructures was crystallized very well as referred to the standard XRD pattern which proved complete deduction of Zn(OH)2 phase and turned into pure zinc oxide.Reference Baviskar, Zhang, Gupta, Chand and Sankapal14 Meanwhile, the XRD patterns of ZnO mixed with SWCNTs (0.1 and 0.5 wt%) showed stronger peak at (101) indicate faster crystallization on that plane as compared with the other planes. The crystallite sizes or grain sizes of the three thin films were calculated using Debye-Scherrer’s equationReference Shakti and Gupta15, Reference Rani, Suri, Shishodia and Mehra16:
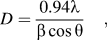 $$D = {{0.94\lambda } \over {\beta \cos \theta }}\quad,$$
where, D is the crystallite size, λ is x-ray wavelength (1.5406 Å), β is full width at half maximum (FWHM) of the observed peak and θ is the diffraction angle.
XRD patterns of (a) pure ZnO; (b) ZnO, 0.1 wt% SWCNTs; and (c) ZnO, 0.5 wt% SWCNTs.

As listed in Table I, pure ZnO sample has larger value of crystallite size (D = 24.256 nm) as compared with ZnO doped with 0.1 and 0.5 wt% SWCNTs thin films; D = 14.69 and 17.765 nm, respectively. Furthermore, lattice constants of the hexagonal wurtzite structure of ZnO can be reconfirmed by the following equationsReference Shakti and Gupta15:
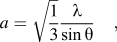 $$a = \sqrt {{1 \over 3}} {\lambda \over {\sin \theta }}\quad,$$
 $$c = {\lambda \over {\sin \theta }}\quad.$$
Structural parameters of ZnO/SWCNT nanocomposite thin films.

The calculated values of a and c have decreased as compared with the standard values of a = 3.2488 Å and c = 5.2054 Å (JCPDS No. 01-089–0510). On the other hand, ZnO-SWCNTs nanocomposite thin films have formed monoclinic structures with unequal length vectors of a = 25.2878 Å, b = 6.2981 Å, and c = 6.9747 Å (JCPDS No.: 00-048–2316). The results indicate that ZnO mixed with SWCNTs have altered the main structures of ZnO to accommodate the existence of carbon compound. Furthermore, dislocation density, δ which represents the number of defects in the thin films were determined by the formulaReference Ilican, Caglar and Caglar2, Reference Baviskar, Zhang, Gupta, Chand and Sankapal14:
 $$\delta = {1 \over {D^2 }}\quad.$$
From Table I, the dislocation density of pure ZnO was measured as less than that of ZnO-SWCNTs nanocomposite thin films. The carbon compounds have increased the amount of defects on the thin films and modified the surface structures. Zn-O-C bond length, L can also be calculated given byReference Ilican, Caglar and Caglar2:
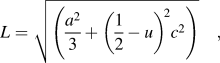 $$L = \sqrt {\left( {{{a^2 } \over 3} + \left( {{1 \over 2} - u} \right)^{\!2} c^2 } \right)}\quad ,$$
where u is the wurtzite structure parameter as presented inReference Ilican, Caglar and Caglar2:
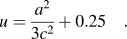 $$u = {{a^2 } \over {3c^2 }} + 0.25\quad.$$
Moreover, from the XRD peak intensities, an average texture or a preferential crystal orientation of ZnO and ZnO-SWCNTs can be obtained as a texture coefficient, TC(hkl) Reference Ilican, Caglar and Caglar2, Reference Gan, Li, Gao, He and Zhuge17, Reference Karst, Rey, Doisneau, Roussel, Deshayes, Consonni, Ternon and Bellet18:
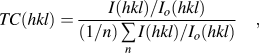 $$TC(hkl) = {{{{I(hkl)} \mathord{\left/ {\vphantom {{I(hkl)} {I_o (hkl)}}} \right. \kern-\nulldelimiterspace} {I_o (hkl)}}} \over {(1/n)\mathop\sum\limits_n {{{I(hkl)} \mathord{\left/ {\vphantom {{I(hkl)} {I_o (hkl)}}} \right. \kern-\nulldelimiterspace} {I_o (hkl)}}} }}\quad,$$
where I(hkl) represents the XRD intensity of the reflection from (hkl) plane, I o(hkl) represents the intensity of the XRD reference of the randomly oriented grains and n represents the number of considered peaks. If TC(hkl) ≈ 1 for all the considered (hkl) planes, then the films are in randomly orientation similar to the JCPDS reference. A value greater than 1 revealed the abundance of grains in a given (hkl) direction. Meanwhile, values 0 < TC(hkl) < 1 signify less amount of grains oriented in that direction.Reference Ilican, Caglar and Caglar2 Karst et al.Reference Karst, Rey, Doisneau, Roussel, Deshayes, Consonni, Ternon and Bellet18 mentioned that if TC(hkl) equals to 5, the texture of the grains are in perfect orientation.
From Table II, ZnO mixed with SWCNTs (0.5 wt%) confirmed higher amount of ZnO-SWCNTs grains when the texture coefficient reached 3.2995 [carbon peak at (002)]. However, peaks (100), (002), (101), and (110) show lack of grain orientation except for peak (102) with TC (hkl) around 1.16. Although the measured amounts of texture coefficient for all peaks are not consistent, the results revealed the crystal orientation when the films were annealed at 400 °C. Some authors claimed that (002) plane was a favored orientated growth of ZnO and the amount of TC (hkl) gained from their experimental work also was greater than 1 and 4.Reference Gan, Li, Gao, He and Zhuge17, Reference Karst, Rey, Doisneau, Roussel, Deshayes, Consonni, Ternon and Bellet18
Texture coefficient, TC (hkl) and degree of preferential orientation, σ relative to standard power sample determined by XRD analysis.

Beside the above parameters, the degree of preferential orientation or σ can be approximated from the standard deviation of all the TC (hkl) values given byReference Karst, Rey, Doisneau, Roussel, Deshayes, Consonni, Ternon and Bellet18:
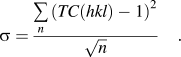 $$\sigma = {{\mathop\sum\limits_n {\left( {TC(hkl) - 1} \right)^2 } } \over {\sqrt n }}\quad.$$
Karst et al. identified that σ equals to zero as a randomly oriented sample and  $\sqrt {n - 1}$ gives ideally oriented sample, which strongly depends on the number of considered peaks. From Table II, although the measured values of σ are less than the ideal values estimated by Karst et al.,Reference Karst, Rey, Doisneau, Roussel, Deshayes, Consonni, Ternon and Bellet18 the highest σ indicates perfect orientation of ZnO-SWCNTs especially for ZnO doped with 0.5 wt% SWCNTs.
B. Surface morphological analysis
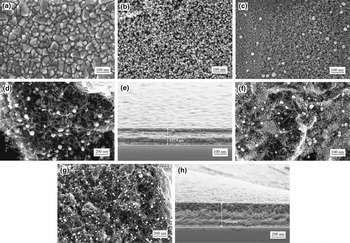
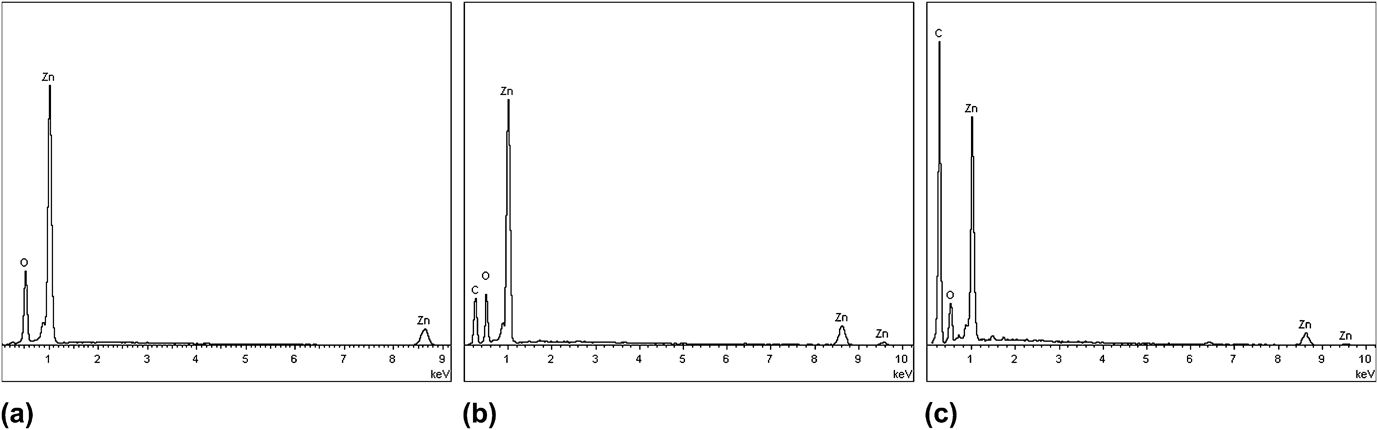
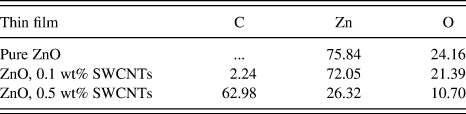
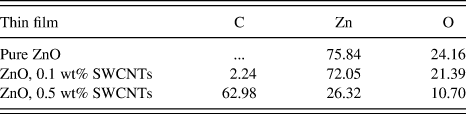
Figure 3(a) shows plain or undoped substrate that consists of only fluorine-doped tin oxide layer. Moreover, Fig. 3(b) represents homogeneous growth of ZnO nanorods and hexagonal structures in disorder length and size after 24 h of immersion time. Although the particle size of the pure ZnO nanostructures are not measured, the FESEM images matched with the XRD analysis of pure ZnO in terms of their crystal structures. Rough surface of ZnO nanostructures can be traced on the thin film surface area with high porosity, which might help the dye loading of DSSCs. Consequently, the weight percentage of zinc and oxygen were measured by EDX spectrum about 75.84 and 24.16%, respectively, as shown in Fig. 4(a). Furthermore, Fig. 3(c) shows the FTO glass sheet covered with small formation of ZnO nanoparticles and SWCNTs (0.1 wt%). Meanwhile, Fig. 3(d) shows very clear appearances of SWCNTs entangled between the ZnO nanoparticles. The weight percentage of zinc, oxygen and carbon were estimated about 72.05, 21.39, and 2.24%, respectively. Figure 4(b) of EDX spectrum confirms the existence of Zn, C, and O on the thin film. Although, the amount of SWCNTs is small, the compositions of ZnO nanoparticles and SWCNTs produce very high specific surface area and rough surface. Chang et al.Reference Gan, Li, Gao, He and Zhuge17 mentioned that higher amount of ZnO created a lot of hydroxyls groups that can interact with the carboxylic groups of CNTs. Rough structures of ZnO and SWCNTs were also confirmed by the XRD analysis whereas the disorderly constant texture coefficient values indicate that the compounds are not uniformly distributed on the thin film. Consequently, in the present work, nonacid treatment SWCNTs did not provide carboxylic groups (-COOH) to interact with ZnO particles. Strong interactions of ZnO and acid-treatment CNTs produced better dispersion form of CNTs and reduced microcrack formations.Reference Chang, Cheng, Yu, Yao, Lee and Ko13 In addition, the thickness of the film was measured to be about 632.5 nm as presented in Fig. 3(e). There were two layers of ZnO-SWCNTs thin film, which create rough surface and unbalanced texture coefficient.
FESEM images of (a) plain FTO; (b) pure ZnO; (c–d) FTO covered with ZnO, 0.1 wt% SWCNTs; (e) thickness of ZnO, 0.1 wt% SWCNTs; (f–g) FTO covered with ZnO, 0.5 wt% SWCNTs; and (h) thickness of ZnO, 0.5 wt% SWCNTs.

EDX analysis graph of (a) pure ZnO; (b) ZnO, 0.1 wt% SWCNTs; and (c) ZnO, 0.5 wt% SWCNTs.
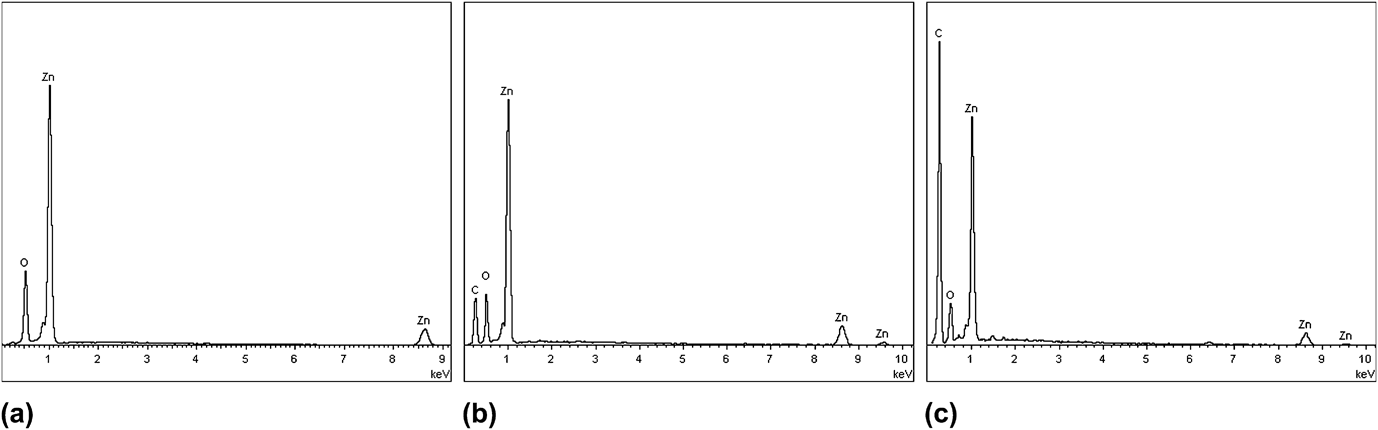
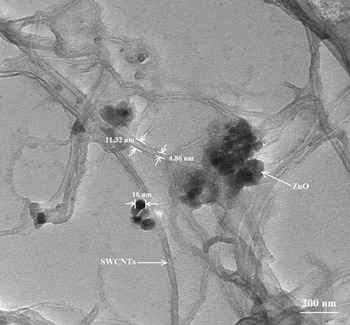
Moreover, Figs. 3(f) and 3(g) shows very thick layer of ZnO and SWCNTs on the FTO glass substrates. Figure 3(h) estimates the thickness of the film to be about 1256 nm or double the thickness of ZnO doped with 0.1 wt% SWCNTs. Higher amount of SWCNTs (0.5 wt%) into ZnO solution created high texture coefficient as confirmed by the XRD analysis. However, higher amount of SWCNTs and higher texture coefficient on the carbon plane are not recommended for DSSCs application. Higher amount of carbon created thicker structures which may not improve the thin films performance in terms of their electrical and optical properties as reported by Ko et al.Reference Ko, Kim and Yu8 In addition, Yen et al.Reference Yen, Lin, Liao, Weng, Huang, Hisao, Ma, Chang, Shao, Tsai, Hsieh, Tsai and Weng19 reported that higher loading of CNTs increased the light adsorption in the DSSC, therefore reduced the cell efficiency. From our observation, the SEM images also show inhomogeneous distribution of SWCNTs and ZnO nanostructures with low surface area, which are not suitable for dye loading capabilities. This effect has also been reported by Zeng et al.Reference Zeng, Nian and Lee9 (2010) when they found that not all ZnO nanostructures attached to the CNTs. Figure 4(c) shows the EDX spectrum of ZnO doped with 0.5 wt% SWCNTs which confirmed higher amount of carbon about 30% as compared with the ZnO-SWCNT (0.1 wt%). The amount of oxygen was found to be too low to accommodate on the surface structures about 10.70%. Therefore, too much carbon compound creates a space constraint inhibiting the growth of other good particles. Table III summarizes the overall weight percentage of the corresponding elements inside the thin films. Figure 5 shows the TEM images of ZnO/SWCNTs sintered at 100 °C for 24 h. The carbon nanotubes have very clear dimensions with inner and outer tube diameters that were measured to be about 4.86 and 11.32 nm, respectively. A black spot also appear between ZnO and CNTs with a diameter measured about 16 nm. In addition, the ZnO particles were surrounded with individual and bundles of non acid-treatment SWCNTs. From our observation, the non acid-treatment SWCNTs are not well dispersed in the ZnO nanoparticles at 100 °C.
TEM image of ZnO/SWCNTs.

Weight percentage of carbon, zinc and oxygen.
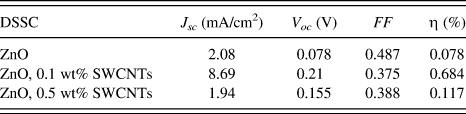
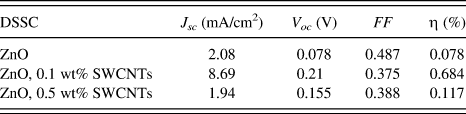
Photovoltaic performance of ZnO and ZnO-SWCNTs.
C. Chemical properties
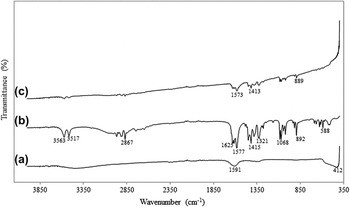
Figure 6 shows the FTIR transmittance spectra of pure ZnO and ZnO-SWCNTs in the range of 4000 to 400 cm−1. For pure ZnO spectra [Fig. 6(a)], there are two bands with very low transmittance at wavelength number 412 and 1591 cm−1 corresponding to Zn-O bonding that indicates the formation of ZnO wurtzite crystal structure. In FTIR spectrum of ZnO mixed with 0.1 wt% SWCNTs [Fig. 6(b)], there are a few bands with narrow and low intensities such as at 1625 cm−1 attributes to C=O bonding effect, at 1577, 1415, and 1321 cm−1 attribute to carbonate v 3 asymmetric stretching mode, at 892 cm−1 attribute to carbonate v 2 bending mode, and at 1068 cm−1 attribute to carbonate v 1 stretching mode. Ariyanto et al.Reference Ariyanto, Abdullah, Syarif, Yuliarto and Shaari20 and Bitenc et al.Reference Bitenc, Marinsek and Orel21 also reported the same splitting of carbonate groups of v 3, v 2, and v 1. Moreover, Zn(CH3COO)2⋅2H2O bonding was reflected at band 2867 cm−1 corresponds to CO2 bonding. Meanwhile, H2O molecule was also traced at 3517 and 3563 cm−1 as it adsorbed on the thin film surface area.Reference Ariyanto, Abdullah, Syarif, Yuliarto and Shaari20, Reference Samadi, Shivaee, Zanetti, Pourjavadi and Moshfegh22 As a comparison, at higher content of SWCNTs, the FTIR spectra in Fig. 6(c) shows less peaks of carbonate bonding at 1573, 1413, and 889 cm−1. Furthermore, at 356 and 2867 cm−1, the transmittance spectra are getting smaller due to higher amount of carbon coated to the ZnO compound.
FTIR spectra of (a) pure ZnO; (b) ZnO, 0.1 wt% SWCNTs; and (c) ZnO, 0.5 wt% SWCNTs.

D. Photovoltaic performance of the DSSCs
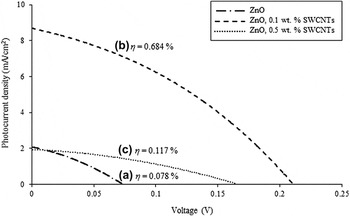
Figure 7 shows the photocurrent density-voltage (J-V curve) measurements of ZnO and ZnO doped with non acid-treatment SWCNTs (0.1 and 0.5 wt%). The short-circuit photocurrent density (J sc), open-ciruit photovoltage (V oc), fill factor (FF) and power conversion efficiency (η) of the ZnO-based DSSC were measured as 2.08 mA/cm2, 0.078 V, 0.487, and 0.078%, respectively (Table IV). Table I compares the photovoltaic performance for three samples. In the case of ZnO-SWCNTs (0.1 wt%), J sc, V oc, and η increased up to 8.69 mA/cm2, 0.21 V and 0.684%, respectively. However, incorporation of 0.5 wt% SWCNTs decreased the J sc to 1.94 mA/cm2 and about 15.1% for V oc. Thus, we found that greater amount of CNTs did not improve the dye absorption effect on the thin film but led to serious competitive light harvesting and unwanted aggregations of SWCNTs with ZnO nanostructures.Reference Sun, Gao and Liu7 The FESEM images of Figs. 3(f) and 3(g) also proved the aggregation of the thin film surface area. Moreover, very thick layer of ZnO-SWCNT (0.5 wt%) also inhibited the DSSC's power conversion efficiency to 0.117%. On the other hand, Chindaduang et al.Reference Chindaduang, Duangkaew, Pratontep and Tumcharern23 (2009) reported that higher amount of CNTs also decrease the η due to depletion of dye absorption by reducing the electron injection to the conduction band of ZnO-CNTs layer and photovoltaic performance of the DSSC.
Photovoltaic performances of (a) pure ZnO; (b) ZnO, 0.1 wt% SWCNTs; and (c) ZnO, 0.5 wt% SWCNTs.

IV. CONCLUSION
In summary, we have successfully fabricated ZnO-SWCNTs nanocomposite thin films by chemical bath deposition method. The most obvious finding included the structural characteristics of ZnO-SWCNTs nanocomposite thin films where their crystallite sizes varied from 14.69 to 17.76 nm smaller than the crystallite size of pure ZnO (24.26 nm). Although, the addition of SWCNTs in the ZnO solution has reduced the crystallite size, carbon compound has increased the surface area of the thin films. FESEM images revealed the morphological properties of ZnO nanoparticles and the presence of SWCNTs. TEM images discovered very clear inner and outer diameter of nonacid treatment SWCNTs. FTIR analysis showed sharp and strong peaks at 412 and 1591 cm−1 that indicated Zn-O bond formation of pure ZnO. Higher loading of carbon reduces the FTIR transmittance spectra. The J-V curves provided useful information on the effectiveness of incorporating SWCNTs in the ZnO photoanode. High loading of SWCNTs (0.5 wt%) was found to inhibit the ZnO-CNTs-based DSSC performance where η reduced to 0.117%. The solar cell incorporating low amount of SWCNTs (at 0.1 wt%) generated the highest η with J sc = 8.69 mA/cm2, V oc = 0.21 V, FF = 0.375, and η = 0.684%. Although the current results did not show very significant finding in the improvement of solar cell efficiencies, the authors suggest low loading of SWCNTs to generate a thin film with high surface area. Implementing SWCNTs in the photoanode has also effectively supported the electron injection and reduce the charge recombination in the solar cell. In the future, an optimization on the weight percentage of SWCNTs is highly recommended to investigate the performance of DSSC.
ACKNOWLEDGMENTS
This work was supported by (Project No.: UKM-DLP-2011-056) and Photonic Technology Laboratory, Department of Electrical, Electronic & Systems Engineering, Universiti Kebangsaan Malaysia, Bangi, Selangor, Malaysia.