

Introduction
US citizens enjoy high levels of civil liberties and political rights. Freedom House gives the US its highest score on both civil liberties and political rights and has done so consistently since the series began in 1973 (Freedom House, 2008). US standards of living are the highest, or among the highest in the world (WorldBank, 17 October 2008), yet despite these political and economic conditions, Americans are famous for their distrust in politics and government. More than 30 years ago, the authors of Crisis of Democracy were even pessimistic about the future of democracy in the US (Crozier et al., Reference Crozier, Huntington and Watanuki1975). They claimed that the demands of an ever-expanding number of participants were overloading government and that the government could not respond effectively or efficiently to the demands, thus contributing to the de-legitimization of governmental authority.
Since then, this widespread sense of ‘doomed democracy’ has met some resistance and some see the sense of crisis as simply part of a cycle of optimism and pessimism over popular support for democracy. During the 1980s, modern states adapted to citizens’ demands as eighties’ affluence dampened radicalism (Norris, Reference Norris2004: 89). Other studies suggest that citizens have not even lost confidence in all institutions across the board (Newton, Reference Newton, Norris, Pharr and Putnam2000: 84). But this theme has re-emerged over the years, with recent research claiming, for example, that Americans have lost confidence in government (Nye et al., Reference Nye1997); that the Angry American or voter rage at the government is changing the nation (Tolchin, Reference Tolchin1999); and that citizens regard Congress as Public Enemy (Hibbing and Theiss-Morse, Reference Hibbing and Theiss-Morse1995).
The AsiaBarometer survey (2008) allows us to revisit these issues and investigate any changes to long-term trends that have occurred in US attitudes toward politics and government. The AsiaBarometer survey included the US because of its importance to Asian nations in international security and trade. The field work took place in the summer of 2008, before the election of Barack Obama, and the – perhaps temporary – upsurge in enthusiasm for politics and participation that came along with that election. During that summer, the situation looked grim: in the post-9/11 world the US was struggling to achieve its goals around the world and was in the initial stages of what would develop into a major worldwide financial crisis. The scale of the impending economic meltdown was not known during the field-work period, but during the 12 months before the survey was conducted, the number of unemployed persons had increased by 1.6 million, reaching 8.8 million and producing an unemployment rate of 5.7% by the middle of the field work period (July). The August level of the Consumer Price Index for All Urban Consumers (CPI-U) was 5.4% higher than a year earlier, during the first eight months of 2008, the CPI-U rose at a 5.1% seasonally adjusted annualized rate (SAAR) (as compared with a 4.1% increase for the 12 months ending December 2007) (Bureau of Labor Statistics, October 2008). The food index and almost all the energy indices rose at a faster rate in the first eight months of 2008 than they had in 2007 (Bureau of Labor Statistics, August 2008). In sum, people were losing jobs and prices were rising.
At that point, were citizens satisfied with the functioning of US democracy in general and with politics and government in particular? Or had these first rumbles of the economic meltdown decreased satisfaction with the work done by the government and depressed the levels of trust? I also examine citizens’ attitudes toward economic policy and big business since at the time the survey was conducted, although the full brunt of the crisis was yet to come, it was clear that the economy was experiencing difficulties. Finally, how do citizens see their own role in terms of participation in the political process?
In this paper, I proceed as follows: first, I look at how citizens see themselves, and then turn to how they see the political system. I examine citizens’ support for democracy as a system and then I turn to their dissatisfaction with the workings of government and politics by examining their trust in institutions of government and satisfaction with economic policy output. I also examine attitudes toward the financial world and their connection to evaluations of government. Finally, I turn to citizen behavior – how do they see their own role in the political process?
Data
The AsiaBarometer conducted face-to-face interviews in each of the target countries. Multistage stratified random sampling and quota sampling were used to obtain random samples of approximately 1,000 adults aged 20–69 in each country (in the US n = 1,002). For further details of this on-going comparative research project, see https://www.asiabarometer.org/. For the exact question wording of the variables I use in this paper, please see Appendix A.
Identity
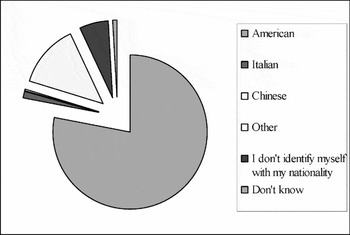
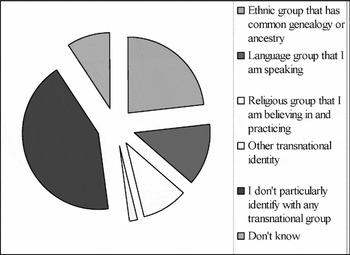
US citizens are highly diverse in terms of their countries of origin, their languages, cultures, ethnicities, race, and religions. Despite this diversity, Americans identify with their country and are committed to their nation. A huge 93% responded that they were either proud or very proud of being American. Most US citizens are immigrants or the descendants of immigrants, but when asked about their heritage – ‘Throughout the world many people identify themselves by their nationality. For example, Korean, Indian, etc. Which of the following nationalities do you think yourself of?’ – 78% responded that they identified themselves as American (see Figure 1). One aspect of US culture stresses citizens’ pride in their respective cultural heritages, but when asked, which ‘transnational groups’ they belong to, only 23% identified with a transnational group such as an ethnic-, linguistic-, or religious-based group, whereas almost 43% did not (Figure 2). This may be partly an artifact of the question and response categories, but, for some, the melting pot idea, the analogy commonly used to describe the US as a society in which people of different cultures, nationalities, races, and religions come together to form a single nationality – that is, the ingredients of the pot combine to make one dish – trumps the idea of citizens identifying with their own or their forebears’ nationality.
The triumph of the melting pot.

Transnational identity among US citizens.

Political culture in the US
It is difficult to describe succinctly but accurately the political culture of such a diverse nation. In his now classic formulation, David Easton (Reference Easton1965) distinguishes between the objects of support (the political community, the regime, and the incumbents) and the types of support (diffuse support that is comprised of fairly fixed, deep-rooted attitudes toward politics and specific support that is more akin to an evaluative attitude).
The theoretical distinctions between beliefs about the fundamental political system, as opposed to policy preferences or political action, are well-trodden academic ground, whatever terminology researchers choose to use, but, in practice, researchers sometimes ignore the differences, which can be misleading (Dalton, Reference Dalton and Norris1999). Following Easton's definitions, I measure diffuse support as support for the democratic system, and specific support as trust in the government and satisfaction with policy output. It is reasonable to expect that they are interrelated: citizen's support even for the fundamental political system might decline in response to perceived serious incompetence of the incumbents or the continual enactment of policies s/he opposes. After examining citizens’ levels of diffuse and specific support, I then confirm whether this is the case.
Diffuse support for the democratic system
Americans overwhelming prefer democracy as their desired political system but at the same time many expressed dissatisfaction with its workings in practice. When asked, ‘Please indicate for each system whether you think it would be very good, fairly good or bad for this country’, 93.2% chose a ‘democratic political system’ as good or fairly good and 78.9% think that democracy is preferable to any other kind of government. These findings are in line with previous cross-temporal research that shows overwhelming support for democracy (Klingemann, Reference Klingemann and Norris1999) and clearly show that democracy as a system is not ‘troubled’. In fact, the opposite may be true: support is strong and citizens are concerned about an absence of democracy. The survey also asks respondents which issues cause them great worry, and 26% chose ‘lack of democracy’ (although it is not clear whether respondents were thinking of a lack of democracy at home or abroad).
Dissatisfaction with democratic practices
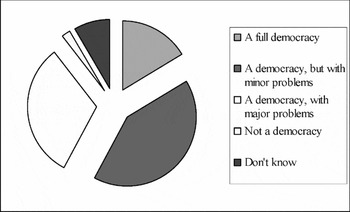
Despite the overwhelming preference for democracy, when asked how satisfied or dissatisfied people are with various aspects of their lives, only half of the respondents expressed satisfaction with the democratic system, more than a quarter (27%) were not satisfied and 22% responded that they were neither satisfied nor dissatisfied. This is an important indicator since it points to the perceived discrepancy between democratic norms, which most people deem desirable, and their dissatisfaction with the actual democratic process (Thomassen, Reference Thomassen, Klingemann and Fuchs1995). Similarly, when asked how much of a democracy the US is, over 70% saw it as a democracy with some problems, and only 16% saw it as a full democracy (see Figure 3).
Americans see problems with their democracy.

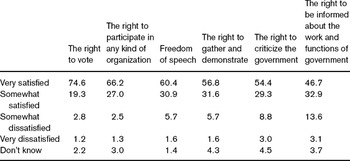
It is not completely clear why people are so dissatisfied overall with democracy as a system, a later question asks respondents how satisfied they are with a broad range of specific democratic rights in the US, and on all issues a majority were satisfied (Table 1). Overall, an overwhelming majority were satisfied with the right to vote, the right to participate in any kind of organization, freedom of speech, the right to gather and demonstrate, and the right to criticize the government. On only one issue – the right to be informed about the work and functions of government – were fewer than half ‘very satisfied’, and, even then, people were mostly fairly satisfied, rather than dissatisfied. But this finding implies that people want more transparency in government.
US satisfaction with a broad range of democratic rights

Source: AsiaBarometer (2008).
Some researchers see citizens’ overall growing levels of dissatisfaction not as a cause for concern, but as the existence of ‘critical citizens’ (Norris, Reference Norris1999) or ‘dissatisfied democrats’ (Klingemann, Reference Klingemann and Norris1999). Russell Dalton (Reference Dalton and Norris1999) describes citizens’ dissatisfaction with the working of the system or the performance of politicians as a sign of the vitality of democracy and at the same time as an objective and critical reading of politics by the public. Hardin (Reference Hardin, Pharr and Putnam2000) suggests that trustworthiness, rather than trust, is the crucial issue at stake. The government may be less trustworthy than it used to be, thus causing declines in citizens’ trust, rather than citizens’ changed levels of credulity or psychological makeup causing the decline (Hardin, Reference Hardin, Pharr and Putnam2000; Newton and Norris, Reference Newton, Norris, Pharr and Putnam2000).
Discontent with incumbents has limited political implications, and may result in voting for the opposition at the next election or participating in some other form of political action, whereas discontent with the system may be more portentous: when this is high, the democracy itself may be at risk.Footnote 1 Dalton argues that ‘Americans’ dissatisfaction with the government now extends beyond just the incumbents in office to the institutions themselves’ (Dalton, Reference Dalton1996) – although there is bound to be some overlap. When asked about trust in Congress or other institutions, evaluations of incumbents inevitably color these judgments, but support for basic the democratic system remains strong. Responses to the AsiaBarometer indicate that despite overall complaints, people are very satisfied with a number of specific rights.
The economy and trust in government
By 2008, the worst economic catastrophe in decades had begun its devastation. As I outlined in the introduction, unemployment was rising and life was becoming more expensive. The crisis itself was rooted in the biggest housing and credit bubble crisis in history and resulted in falling house prices and trouble for the banks that depended on these housing loans in a pyramid of complicated debt products. At the beginning of September, the nation's two largest mortgage finance lenders – the Federal National Mortgage Association, nicknamed Fannie Mae and the Federal Home Mortgage Corporation, nicknamed Freddie Mac were taken into public ownership amid fears that their collapse could have endangered the global financial system (Scruton, Reference Scruton2008), reversing years of insisting that the two were private enterprises.
Hardin suggests that declining trust may be evidence of belief that governmental performance falls short of past performance and focuses on the possibility that the government's agenda may have changed in ways that make it seem less competent relative to the problems it faces (Hardin, Reference Hardin, Pharr and Putnam2000).
Unsurprisingly, in 2008, confidence in Congress was tied up with evaluations of incumbents and also with citizens’ perceptions of the health of the economy. Correlations show that people who trusted Congress were much more likely than those who did not to think that the government was not handling the economy well, suggesting that people do not interpret this question as trust in the institution, but that trust is at least somewhat tied to the current officeholders.
US citizens’ confidence in Congress has fallen slightly over time and within this decline large fluctuations are noticeable. Over the past 23 years, according to findings from the General Social Survey (GSS), most citizens had either ‘only some’ or ‘a great deal’ of confidence in Congress during the years 1973–2006, and a minority – ranging from almost 16% in 1973 to a whopping 44% (in 1996) – had hardly any confidence. At the other end of the scale, a smaller minority (almost 24% in 1973 and a mere 6.6% in 1993) have a great deal of confidence.Footnote 2
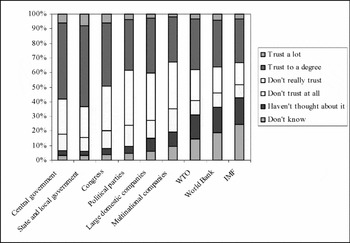
In 2008, the AsiaBarometer asked citizens about their trust in central government. Most people trusted government and over half trusted Congress (63% and 54% respectively), whereas more people (67%) trusted state and local government. In all cases, a minority of people either didn't trust at all and a smaller minority trusted a lot (Figure 4). These figures show that a slim majority trust government, which seems more or less in line with long-term trends. The US's struggle with the economy and to achieve its international goals had not at that point excessively depressed levels of trust. To understand more clearly who trusts government, I return to this issue in the multivariate analyses below.
US levels of trust in elected bodies, financial institutions, and companies, 2008.

Satisfaction with policy output
People's evaluations of government can also be gauged by asking how they think the government is dealing with various policy issues. People may not be aware of the exact economic indicators, but they can tell if their jobs are threatened or they have less money in their wallets. The AsiaBarometer asked respondents which issues caused them great worry. Of the respondents 48% chose economic problems in the US, 46% chose unemployment, and 34% selected global recession (they were given a ‘show card’ and could select multiple answers).
Not only were people very worried, their evaluations of policy output were harsh. The survey also asked how well people thought that the government was dealing with various policy issues. Of all the policy areas, more people felt that the government was not dealing well with the economy than any other issue. On the non-economy-related issues, too, few people were impressed with the government's performance. A majority of citizens felt that the government was dealing well or fairly well with only three issues: public services, crime, and religious conflict (Figure 5).
US citizens’ critically evaluate of policy output.

Citizens continue to hold government responsible for some aspects of their economic and social well-being,Footnote 3 yet, at the same time, they remain suspicious of government. McClosky and Zaller (Reference McClosky and Zaller1984) refer to clear and contested capitalist norms and clear and contested democratic norms to describe the areas in which citizens want government intervention in the market and in their lives and those in which they do not.
Americans’ ambivalent attitudes toward the services provided by government were also very conspicuous. Although people were worried about the economy and dissatisfied with policy output, when asked about what they personally sought from government, most preferred self-reliance to turning to the government. The AsiaBaromoeter asked ‘If the main breadwinner of your household should die or become unable to work due to illness, how would your household maintain the household budget?’ Only 11% responded that they would get social welfare payments, whereas a full 65% responded that another adult member of the family would become the main breadwinner.
Trust in companies and banks
Turning to the financial world, the GSS has asked citizens about their levels of confidence in banks and major companies since the mid-1970s. During that whole period, most people had ‘only some’ confidence in both banks and large companies. The mid-1970s was the high point in terms of the numbers of people with ‘a great deal of confidence’ and, in contrast, the early 1990s were a low point, after which some people regained confidence. For large companies, the early 1970s and mid-1980s were high points and the noughties a low point. Similarly, in 2008, when the AsiaBarometer asked people how much they trusted domestic and multinational companies, slightly fewer than half of all respondents trust domestic companies and just over 40% trusted multinationals (see Figure 4 above). Interestingly, more people trusted elected institutions than they did the banks and companies. Although popular wisdom has it that the US is an entrepreneurial country in which unfettered capitalism flourishes, these findings confirm previous research that Americans remain ambivalent toward business and their suspicions of big business are clear in the low levels of trust they have in business.
Part of this may stem from doubts about the ethics of big business. David Vogel (Reference Vogel1992), for example, argues that no other capitalist nation come close to the US in the persistence and intensity of public concern about the morality of business conduct, largely because Americans have high expectations of business conduct. When practices fall short of expected standard, this presumably depresses trust.
Individual-level influences on trust
What are the individual level influences on trust in politics and in big business? Are the factors identified in previous research still important? Previous research points to social capital, efficacy, and some political values as among the important influences. Social capital has been defined in various ways, but basic definitions center on the norms and trust within a group as producers of a resource that can be used for the public good or for the benefit of individuals (Putnam, Reference Putnam2000). I used interpersonal trust as the measure, assuming that people who trust others are also more likely to trust government. Similarly, a strong sense of efficacy, that is a belief that citizen action can influence the trajectory of politics, may mean that citizens have more trust in government, as citizens think that they can effectively oversee Congress and government. Satisfaction with policy output probably also contributes to trust.
Analyzing individual level influences on trust
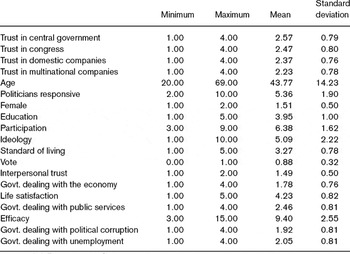
I estimated four regression models, with trust in the central government, trust in congress, trust in domestic companies, and trust in multinationals as the dependent variables. As independent variables, I included social capital, efficacy, satisfaction with policy output, political attitudes, and sociodemographic indicators (see Appendix A for the questions and recodes, Appendix B for descriptive statistics, and Appendix C for information on the variables I use).
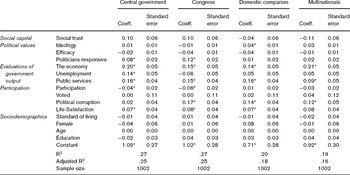
Several points stand out in the analyses of the individual level influences on trust in the government and Congress (see Table 2). First, interpersonal trust and trust in institutions, two items that are often used to measure social capital, are not related. Just because a person trusts other people, s/he is no more likely to trust the government or Congress. This makes sense. People consider other people to be trustworthy, but do not extend this feeling to the government, possibly because they know that members of the government have behaved in an untrustworthy way in the past, that is past political scandals and a failure to meet expectations may contribute to the lack of trust. Particularly since evaluations of government output are associated with trust, citizens who feel the government to be handling various issues well are more likely than are others to trust the government and Congress, with evaluations of government performance on the economy generally producing the largest effect. Similarly, and unsurprisingly, those who feel that politicians are responsive are more likely to trust the government and Congress. Political participation and voting had little influence on trust in the government, but those who had participated were less likely to trust Congress, suggesting that the participation is protest activity, rather than a supportive activity. Third, some previous research on authoritarianism implies that some of those who identify as right-wing may trust government more than their left-wing counterparts (see Devos et al., Reference Devos, Spini and Schwartz2002). My findings imply that ideology is not related to trust in governmental institutions. This may be because, in the US, right-wing ideologies can encompass a distrust of government and authority, rather than the submissive tendencies of authoritarians that are associated with rightist ideologies in some nations. Fourth, the sociodemographic variables are not related to trust, suggesting that basic individual life experiences do not directly influence trust in politics.
Influences on trust in government and big business

Notes: Cells are the unstandardized coefficients from ordinary least squares regression analysis, with the standard error to the right.
* p ≤ 0.05.
Source: AsiaBarometer (2008).
In sum, for US citizens, trust in political institutions is not related to socioeconomic circumstances, but correlates with evaluative judgments of policy output and politicians’ performance. Similar findings have been noted in previous cross-national findings, in which the authors imply that a loss of trust may be a function of ‘critical citizens’ who believe that the government does not live up to expectations, rather than cynicism (see, for example, Newton and Norris, Reference Newton, Norris, Pharr and Putnam2000).
Turning to trust in companies, recall from Figure 4 that people who trust companies are a minority. My findings here show that trust in companies relates to some general political values and evaluations. Right-wing citizens have more trust in domestic, but not multinational, companies. People who feel that the government is handling the economy, public services, and political corruption well are more likely than others to trust companies. On the other hand, most sociodemographics – age, education, gender, and perceived standard of living – make no difference to whether an individual trusts or does not trust companies.
Political participation
Russell Dalton comments in his study of citizen politics in Advanced Western Democracies that:
[d]emocracy should be a celebration of an involved public. Democracy requires an active citizenry because it is through discussion, popular interest, and involvement in politics that societal goals should be defined and carried out . . . Without public involvement in the process, democracy lacks both its legitimacy and its guiding force (Dalton, Reference Dalton1996).
I now look at the extent to which democracy conforms to this ideal. As I discussed earlier, a high level of diffuse support for the democratic process exists, but this support is not fully reflected in participation levels.
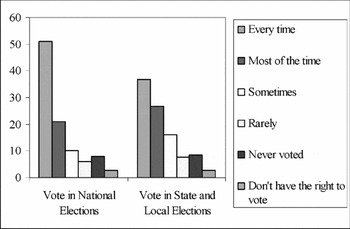
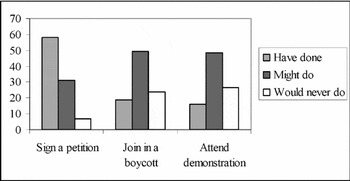
My definition of political participation adheres to what has now become a fairly standard definition: ‘legal activities by private citizens that are more or less directly aimed at influencing the selection of government personnel and/or the actions they take’ (Verba et al., Reference Verba1978). Verba et al. (Reference Verba and Nie1972, Reference Verba1978), in their classic investigations of participation, identified four modes of political participation: voting, campaign activity, communal activity, and contacting officials on personal matters. I examine voting and protest activity since the AsiaBarometer asked about these two modes. In Verba et al.'s typology, both produce collective outcomes, but protest activity is clearly the more difficult political act because it requires more individual initiative, may involve cooperation among the participants, and can place the participant in conflict situations. The contemporary participation rates of US citizens reflect the levels of difficulty, to some extent – signing a petition and voting, the ‘easier’ acts, have the highest rates (although local election rates are low), whereas few have attended demonstrations (see Figures 6 and 7).
Low reported voting rates in national and local elections.

Moderate participation rates in protest politics.

Analyzing who votes and who participates
In this section, I analyze the individual-level factors that influence vote turnout and political participation to confirm whether the factors that previous work identifies as influential continue to be so.
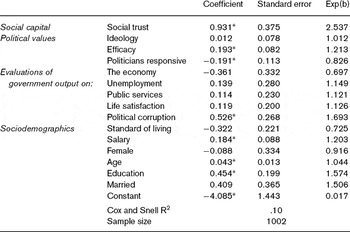
I conducted two regression analyses in which I examine the individual level influences on voting in the first model and on protest activity in the second. In the first model, I used voted in a national election (recoded 1 if the respondent has ever voted, 0 otherwise) as the dependent variable and I estimate a logistic regression analysis since the dependent variable, vote turnout, is binary. I included the same independent variables as I did in the earlier regression analyses of trust (see the appendices). In the second model, I created an additive scale from the three measures of political participation (signing a petition to improve conditions, joining in boycotts, attending lawful demonstrations), for which high values represent ‘have done’ and low values ‘would never do’ (a reliability analysis – Cronbach's alpha of 0.75 confirmed that this is justifiable) and estimate an OLS model.
Almost 40 years ago Wolfinger and Rosenstone (Reference Wolfinger and Rosenstone1980) found that older people and the more educated were more likely to vote than others. Other demographic variables such as marriage and income all mattered, but only a little (they used census data to look at registration laws and race). In addition, they found that policy attitudes and ideology made little difference to whether someone voted or not (although conservatives had a slight edge).
Despite the huge changes in the political, economic, and social environment, findings from the AsiaBarometer indicate that little has changed since then (see Table 3). The educated and the wealthy are more likely than their less educated and less wealthy counterparts to vote, but being female or married makes no difference (the AsiaBarometer did not ask respondents’ race). Social trust is important: those who trust others vote, as do those with high levels of efficacy. Those who felt that politicians were responsive were less likely than others to vote, holding other attributes constant, including satisfaction with government output.
The individual level influences on vote turnout

Notes: Cells are the coefficients from logistic regression with standard errors to the right.
*p ≤ .1
Source: AsiaBarometer (2008).
As some political theorists have noted, since the wealthy and the more educated disproportionately turn out to vote, politicians may pay more attention to their interests than to the interests of those who do not vote, undermining democratic inclusiveness. However, people also participate when politicians, political parties and other networks mobilize them to do so (Rosenstone and Hansen, Reference Rosenstone and Hansen1993) and in some circumstances this can counteract the disproportionate participation of the wealthy and educated (Verba et al., Reference Verba1978). And while understanding the individual level influences on voting and participating is important, they only explain a small part of vote choice, as the amount of variance explained by these models is not great.
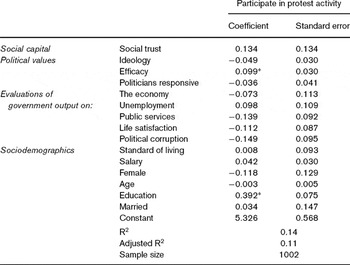
Turning to the individual level influences on protest activity, echoing much previous work, findings from the AsiaBarometer survey show that education continues to be an important influence on political participation (see Table 4). As with voting, the more educated are more likely to participate in protest politics than are their less educated counterparts. Verba, Schlozman, and Brady claim that education enhances political participation because it bestows the resources – that is, the civic skills, time and money – that are necessary for participation (Reference Verba, Schlozman and Brady1995: chapters 9–11). Unsurprisingly, efficacy mattered; those who thought they could make a difference were more likely than others to participate. Age, gender, and marital status did not correlate with engaging in protest activity.
The individual level influences on protest activity

Source: AsiaBarometer (2008).
Notes: Cells are the coefficients from ordinary least squares regression.* p ≤ .1
Discussion
The new findings from the AsiaBarometer confirm patterns noted in previous work. Much research suggests that US citizens are losing trust in their government, and some researchers argue that declining trust fundamentally undermines democracy. But this is only one part of the story. In the US, in common with the vast majority of Western European countries, most citizens adhere to democratic ideals and approve of democracy as the best form of government (Norris, Reference Norris2004: 89; Klingemann, Reference Klingemann and Norris1999: 47). Diffuse support for the system is high, while, at the same time, people are critical of government and policy output. Previous work suggests that particularly economic performance and demands for that performance have contributed to dissatisfaction with government (Newton and Norris, Reference Newton, Norris, Pharr and Putnam2000; Lawrence, Reference Lawrence, Nye, Zelikow and King1997). My findings imply that this continues to be the case; certainly citizens who are satisfied with government policies on the economy, unemployment, and public services are more likely than are others to trust the central government. The importance of economic evaluations may have been slightly magnified since the survey took place at the beginning of the financial crisis.
As we have seen, Americans remain ambivalent toward politics and government. Citizens overwhelmingly support democracy and are satisfied with a broad range of democratic rights, but, at the same time, they complain about the workings of their democratic system and many distrust government.
Disappointment with government output may well contribute to the low levels of trust. Human development in the US falls short of its economic development; despite its preeminent economic status, the United States is only the 12th ‘most livable’ country according to the Human Development Index (HDI) that ranks countries according to life expectancy, literacy, education, and standards of living. Even this index, as well as other economic indicators, masks the variation that exits between women and men, non-whites and white, young and old, and geographic locations (Burd et al., Reference Burd-Sharps, Lewis and Martins2008). To some extent, the objective gaps may be reflected in the ambivalence in public opinion toward government and expectations of governmental output. Similarly, although US citizens support capitalism as a system (with some government oversight), they distrust big business.
While the findings from the AsiaBarometer are not new, they are still striking and tell us much about contemporary attitudes toward politics. Although US citizens are distrustful of government and business, they do not want to see either system replaced. Given these findings, expressions of dissatisfaction with democracy may be expressions of general cynicism, since they are not concrete complaints and do not reflect a desire for changes in the fundamental system. Distrust of Congress and government are not signs that the system or institutions of government are in trouble, but may indicate citizens’ cynicism and critical evaluations of the performance of office holders, particularly their handling of the economy.
About the author
Gill Steel received her Ph.D. in political science from the University of Chicago. She is an Assistant Professor in the Department of Social Psychology in the Graduate School of Humanities and Sociology at the University of Tokyo. She has published articles on public opinion and voting behavior, co-edited the book Reform in Japan: Assessing the Impact and co-authored the book Changing Politics in Japan.
Appendix A: Question wording and recodes
I recoded each variable so that high values corresponded with more or greater frequency. I recoded don't knows and haven't thought about it to missing values.
Identity
Q20 Throughout the world many people identify themselves by their nationality. For example, Korean, Indian, etc. Which of the following nationality do you think yourself of? (SA)
1 American
2 Italian
3 Chinese
4 Other
5 I don't identify myself with my nationality
99 Don't know
Q21 Throughout the world, some people see themselves as belonging to a transnational group. Which of the following transnational groups do you identify with? (SA)
1 Ethnic group that has common genealogy or ancestry
2 Language group that I am speaking
3 Religious group that I am believing in and practicing
4 Other transnational identity (Specify:)
5 I don't particularly identify with any transnational group
9 Don't know
Satisfaction with Democracy
Q44 In your opinion how much of a democracy is [YOUR COUNTRY] today? (SA)
1 A full democracy
2 A democracy, but with minor problems
3 A democracy, with major problems
4 Not a democracy
9 Don't know
Worries
Q27 Which, if any, of the following issues cause you great worry? Please choose all issues that cause you serious worry. (ROTATE card) (MA)
Q18 If the main breadwinner of your household should die or become unable to work due to illness, how would your household maintain the household budget? Select up to two of the following measures. (2MA)

Trust in Institutions
Q31 Please indicate to what extent you trust the following institutions to operate in the best interests of society. If you don't know what to reply or have no particular opinion, please say so. (SA for each institution)
Social Trust
(Show card)
Q12 Generally, do you think people can be trusted or do you think that you can't be too careful in dealing with people (that it pays to be wary of people)? (SA)
1 Most people can be trusted
2 Can't be too careful in dealing with people
9 Don't know
Ideology
(Show card)
Q55 In political matters, people talk of ‘the left’ and ‘the right’. How would you place your views on this scale, generally speaking? (SA)
Satisfaction with government
Q33 How well do you think the [YOUR COUNTRY'S] government is dealing with the following issues? (SA for each statement)
Political Participation
Q35 How often do you vote in each of the following elections? Please answer for each type of election. (SA for each election type.)
Protest Activity
Q51 Now I'd like you to look at this card. I'm going to read out some different forms of political action that people can take, and I'd like you to tell me, for each one, whether you have actually done any of these things, whether you might do or would never, under any circumstances, do it. (SA for each action)
Efficacy
(Show card)
Q36 I am going to read out some statements about society and politics. Please indicate how much you agree or disagree with each statement. (SA for each statement)
Politicians Responsive
36f Generally speaking, the people who are elected to the [NATIONAL PARLIAMENT] stop thinking about the public once they're elected.
Q36g Government officials pay little attention to what citizens like me think.
Demographics
F1 Please indicate your gender.
1 Male
2 Female
F2 What is your age? years old
(Show card)
F3 What is the highest level of education you have completed? (SA)
In the United States, the code 3 read ‘High school/technical school’, the code 4 was ‘Junior/community college’, and the code 5 was ‘College/university/graduate school’.]
(Show card)
F5 What is your marital status? (SA)
1 Single
2 Married (Including de facto marriage)
3 Divorced/separated
4 Widowed
5 Other
9 Don't know
(Show card)
F8 What was the total gross annual income of your household last year? (SA)
1 $30,000 and under
2 $30,001–$400,00
3 $40,001–$50,000
4 $50,001–$60,000
5 $60,001–$80,0006
6 $80,001–$100,000
7 $100,001–$125,000
8 $125,001–$150,000
9 $150,001–$200,000
10 Over $200000
98 Refused
99 Don't know
Standard of Living
(Show card)
Q9 How would you describe your standard of living? (SA)
1 High
2 Relatively high
3 Average
4 Relatively low
5 Low
9 Don't know
Q9 Please tell me how satisfied or dissatisfied you are with the following aspects of your life. (SA for each)
Descriptive statistics

Source: AsiaBarometer (2008).
Appendix C
Social capital. ‘Generally, do you think people can be trusted or do you think that you can't be too careful in dealing with people (that it pays to be wary of people)?’ (1 = you can't be too careful in dealing with people, 2 = most people can be trusted)
Political values and attitudes. Ideology. Respondents’ self-placement on a 1–10 scale, left at position 1 and right at position 10. Evaluations of policy output: How well the respondent thinks the government is dealing with the economy; unemployment; political corruption; and public services (continuous variable: 1 = not well at all, 2 = not so well, 3 = fairly well, 4 = very well). Efficacy. The measure of efficacy is an additive scale created from responses to the following questions: Generally speaking, people like me don't have the power to influence government policy or actions; Politics and government are so complicated that sometimes I don't understand what's happening; Since so many people vote in elections, it really doesn't matter whether I vote or not (Cronbach's alpha of .60) (continuous variable 3–15, high values represent a greater sense of efficacy). The responsiveness of politicians. Generally speaking, the people who are elected to Congress stop thinking about the public once they're elected; Government officials pay little attention to what citizens like me think (Cronbach's alpha of 0.77) (continuous variable 2–10, high values represent feelings of closeness to politicians).
Sociodemographics. I also included sociodemographic characteristics that are often associated with political opinions. Life Satisfaction (continuous variable: 1 = Very dissatisfied, 2 = Somewhat dissatisfied, 3 = Neither satisfied nor dissatisfied, 4 = Somewhat satisfied, 5 = Very satisfied); Standard of Living (continuous variable: 1 = Low, 2 = Relatively low, 3 = Average, 4 = Relatively high, 5 = High); Female (0 = male, 1 = female); Age (continuous variable 19–69); Education (1 = No formal education, 2 = Elementary school/junior high school/middle school, 3 = High school, 4 = Professional/technical school, 5 = University/graduate school). See Appendix B for descriptive statistics.Footnote 4