Implications
Wagyu cattle are well known for high intramuscular lipid content. Results from this study shows that the satellite cell density in Wagyu cattle is lower than Angus cattle, which limits the muscle growth potential of Wagyu cattle. The attenuated muscle growth may direct nutrients to intramuscular adipose depot and contribute to high marbling in Wagyu cattle.
Introduction
The palatability of beef is correlated with the degree of marbling and tenderness, two top quality issues for the beef industry (Garcia et al., Reference Garcia, Nicholson, Hoffman, Lawrence, Hale, Griffin, Savell, Vanoverbeke, Morgan, Belk, Field, Scanga, Tatum and Smith2008). Marbling lipid provides juiciness and flavor, as well as smoothness of texture due to the lubrication effect of lipid (Dryden and Maechello, Reference Dryden and Maechello1970). Tenderness is another important factor determining consumer satisfactory of beef consumption. Tenderness is determined by the myofibrillar effect and background toughness; the background toughness correlates with collagen content and cross-linking, which increases as animals become older (Archile-Contreras et al., Reference Archile-Contreras, Mandell and Purslow2010). As a result, the USDA quality grading of beef carcasses is based on marbling and maturity, and beef from young cattle (Maturity A and B, accounts for vast majority of beef carcasses in the United States) is qualified for high-quality grades. However, only 2.1% of carcasses are above the Slightly Abundant marbling necessary to qualify for Prime grade (Moore et al., Reference Moore, Gray, Hale, Kerth, Griffin, Savell, Raines, Belk, Woerner, Tatum, Igo, VanOverbeke, Mafi, Lawrence, Delmore, Christensen, Shackelford, King, Wheeler, Meadows and O’Connor2012), though the ratio of Prime grade increases in last several years (Boykin et al., Reference Boykin, Eastwood, Harris, Hale, Kerth, Griffin, Arnold, Hasty, Belk and Woerner2017). The selection for high lean growth, the use of implants, and harvesting at increasingly younger ages could also reduce intramuscular adipose tissue (Albrecht et al., Reference Albrecht, Gotoh, Ebara, Xu, Viergutz, Nurnberg, Maak and Wegner2011; Du et al., Reference Du, Wang, Fu, Yang and Zhu2013). Thus, it is important to enhance marbling in beef cattle.
Skeletal muscle and intramuscular adipocytes are originated from the same pool of stem cells in paraxial mesoderm during early embryonic development, and continue to develop and grow in the same physiological environment (Gesta et al., Reference Gesta, Tseng and Kahn2007; Du et al., Reference Du, Wang, Fu, Yang and Zhu2013). In livestock, all muscle fibers are formed before birth and postnatal muscle growth is due to muscle fiber hypertrophy (Brameld et al., Reference Brameld, Mostyn, Dandrea, Stephenson, Dawson, Buttery and Symonds2000). Muscle satellite cells, originated from myogenic cells during fetal development, are critically important for postnatal muscle growth (Bailey et al., Reference Bailey, Holowacz and Lassar2001). Their proliferation and fusion with existing muscle fibers contribute to the majority of nuclei in adult muscle fibers (Davis and Fiorotto, Reference Davis and Fiorotto2009). On the other hand, if myogenesis during fetal development is weakened, both the number of muscle fibers and the density of satellite cells are reduced, resulting in permanent reduction of muscle mass (Zhu et al., Reference Zhu, Ford, Nathanielsz and Du2004 and Reference Zhu, Han, Tong, Ma, Kimzey, Underwood, Xiao, Hess, Ford, Nathanielsz and Du2008). In addition, fetal and neonatal stages are also important for adipose tissue development, and intramuscular adipogenesis during early development generates adipocytes for later lipid accumulation during fattening, which forms marbling adipose tissue (Zhu et al., Reference Zhu, Han, Tong, Ma, Kimzey, Underwood, Xiao, Hess, Ford, Nathanielsz and Du2008; Yan et al., Reference Yan, Zhu, Xu, Tong, Ford, Nathanielsz and Du2010; Du et al., Reference Du, Huang, Das, Yang, Duarte, Dodson and Zhu2015).
The Japanese Wagyu cattle is well known for its extremely high marbling. In our previous study, we found that high intramuscular adipogenesis in Wagyu cattle is a major factor contributing to high marbling (Duarte et al., Reference Duarte, Paulino, Das, Wei, Serao, Fu, Harris, Dodson and Du2013). Despite the excellent intramuscular lipid accumulation, Wagyu cattle has lower growth rate and smaller muscle mass compared with Angus and other common domestic cattle breeds at comparable age (Lunt et al., Reference Lunt, Riley and Smith1993; Afolayan et al., Reference Afolayan, Pitchford, Deland and McKiernan2007) , suggesting a low efficiency of myogenesis and muscle growth rate. Because myogenic cells and intramuscular adipocytes share developmental origins (Du et al., Reference Du, Wang, Fu, Yang and Zhu2013), we hypothesized that, compared with Angus cattle, the myogenic differentiation and myogenic cells in Wagyu cattle are attenuated, which contributes to the enhanced intramuscular lipid accumulation.
Material and methods
Animals and skeletal muscle tissue sampling
Wagyu (n=5, BW=302±9 kg) and Angus (n=5, BW=398±12 kg) heifers were managed under the same condition in the Beef Center of Washington State University (WSU). At 12 months of age, skeletal muscle tissue was obtained by biopsy per the protocol approved by the Institutional Animal Care and Use Committee of Washington State University. Briefly, an area (12×12 cm) over the right Biceps femoris muscle of the restrained cattle was clipped, followed by surgical preparation via standard techniques using a combination of povidine iodine scrub, 75% ethanol, and povidine solution. Lidocaine (2%) was locally injected for analgesia. Then a 2-cm incision using a surgical blade was made through the skin to expose the underlying subcutaneous tissues. Using blunt-end scissors, about 1 g of muscle tissue together with subcutaneous adipose tissue was collected from each animal. Muscle samples were separated from subcutaneous adipose tissue and were further divided into three portions, with one portion snap frozen in liquid nitrogen for biochemical analyses, one embedded for cryosection, and the remaining portion submerged in PBS supplemented with 100 IU/ml penicillin, 100 µg/ml streptomycin, and 250 ng/ml Fungizone B and used for cell separation. Note that due to the limited amount of biopsy tissue, we were only able to obtain a sufficient number of muscle-derived cells from three cattle of each genotype for cell analyses, including myogenesis, adipogenesis, and gene expression examination. And to ensure consistency, only tissues from these six animals were used for histological analysis.
Antibodies
Anti-myogenin (F5D), anti-Pax7 (PAX7), anti-MHC (MF20) and anti-β-tubulin (E7) mouse monoclonal antibodies were obtained from the Developmental Studies Hybridoma Bank (Iowa City, IA, USA). Anti-desmin (ab15200) was purchased from Abcam (Cambridge, MA, USA). Goat anti-mouse Alexa Fluor 555 (#4409) and goat anti-rat Alexa Fluor 488 (#4416) antibodies were purchased from Cell Signaling (Danvers, MA, USA).
Muscle cell isolation and culture
Muscle tissue was digested as previously described (Fu et al., Reference Fu, Zhao, Zhu, Foretz, Viollet, Dodson and Du2013). Briefly, muscle tissue was rinsed with PBS and minced with a dissecting scissors. Minced muscle tissue was then digested in Dulbecco’s Modified Eagle’s medium (DMEM) contaning 0.75 U/ml collagenase D and 1 U/ml of Dispase II for 1 h at 37°C. The tissue slurry was filtered through a 100 µm cell strainer and pelleted through centrifugation. The pellet was resuspended in growth medium composed of F10 medium with 20% fetal bovine serum (FBS), 100 IU/ml penicillin, 100 µg/ml streptomycin and 250 ng/ml Fungizone B. Cell culture medium was changed every 2 days. Myogenic differentiation was induced by replacing the medium with differentiation medium containing DMEM with 2% horse serum. Adipogenic differentiation was induced as previously described (Wei et al., Reference Wei, Fu, Liang, Zhu, Jiang, Parish, Dodson, Zan and Du2015). Briefly, cells were cultured in adipogenic differentiation medium containing DMEM+10% FBS supplemented with 1 µg/ml insulin, 1 µM dexamethasone and 0.5 mM isobutylmethylxanthine for 6 days, followed by treatment with DMEM+10% FBS supplemented with 1 µg/ml insulin only for 8 more days.
Real-time quantitative PCR
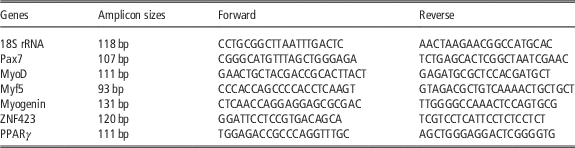
Total RNA was extracted using Trizol (Sigma, Saint Louis, MO, USA) followed by DNase (NEB, Ipswich, MA, USA) treatment, and cDNA was synthesized using a reverse transcription kit (Bio-Rad, Hercules, CA, USA). Real-time PCR (RT-PCR) was carried out using CFX RT-PCR detection system (Bio-Rad) with a SYBR Green RT-PCR kit from Bio-Rad. After amplification, a melting curve (0.01°C/s) was used to confirm product purity, and agarose gel electrophoresis was performed to confirm that only a single product of the right size was amplified. Relative mRNA content was normalized to 18S rRNA content (Fu et al., Reference Fu, Zhao, Zhu, Foretz, Viollet, Dodson and Du2013). Primer sequences and their respective PCR fragment lengths are listed in Table 1.
Primer sequences and their respective PCR amplicon sizes

Western blot analysis
Western blot was conducted as previously described (Fu et al., Reference Fu, Zhao, Zhu, Foretz, Viollet, Dodson and Du2013). Immunoreactive proteins in the membrane were scanned and analyzed by Odyssey Infrared Imaging System (LI-COR, Inc., Lincoln, NE, USA). Band density was normalized according to the β-tubulin content.
Immunocytochemical staining
Cells grown on multiple well plates were fixed in cold methanol for 10 min, permeabilized with 0.1% Triton X-100 for 5 min, blocked with 3% BSA, and incubated with primary antibodies (anti-desmin 1 : 100; anti-MHC 1 : 50) at 4°C overnight. Cells were then stained with corresponding secondary antibodies (1 : 1000) for 1 h. Cells were then mounted in a mounting medium containing DAPI (Vector Lab, Burlingame, CA, USA). Images were taken using a EVOS microscope (Thermo Fisher Scientific, Rockford, IL, USA).
Immunohistochemical staining
The B. femoris muscle sample was fixed in 4% paraformaldehyde and frozen in isopentane cooled in liquid nitrogen. Frozen tissue was sectioned (10 µm thick). Sections were heated in citrate buffer for 20 min, blocked in 5% goat serum in TBS containing 0.3% Triton X-100, and stained with anti-Pax7 antibody (1 : 5) and corresponding fluorescent seconday antibody (1 : 1000). Sections were then mounted in a mounting medium containing DAPI .
Oil-Red O staining
Oil-Red O staining was performed as previously described (Wei et al., Reference Wei, Fu, Liang, Zhu, Jiang, Parish, Dodson, Zan and Du2015). Briefly, after 14 days of adipogenic differentiation cells were fixed in 10% formalin for 30 min and stained with Oil-Red O in 60% isopropanol for 10 min.
Quantification of satellite cells
Pax7+ cells with nuclei identified by DAPI staining were classified as satellite cells. For each muscle sample, satellite cells in four randomly picked microscopic fields of each of three sections at different depths of each muscle were counted (four fields/section, three sections/muscle sample). The sums of satellite cells in the four picked fields of each section were caculated. Average numbers obtained from the three examined sections of each muscle sample were used as a biological replicate for comparative analysis.
Minimum muscle fiber diameter measurement
Gill’s Hematoxylin (26030-10) and Eosin Y–Phloxine B (26051-21) were purchased from Electron Microscopy Sciences (Hatfield, PA, USA). Hemotoxylin and eosin staining to frozen sections was conducted following the manufacturer’s protocol. The smallest diameter of muscle fibers was measured using Fiji Image J as described previously (Duarte et al., Reference Duarte, Paulino, Das, Wei, Serao, Fu, Harris, Dodson and Du2013).
Statistical analysis
All experiments were performed using three animals per breed. Due to the large difference in marbling and myogenic characteristics between Wagyu and Angus cattle, three animals per breed should provide power to discern biological effects (Whitley and Ball, Reference Whitley and Ball2002; Duarte et al., Reference Duarte, Paulino, Das, Wei, Serao, Fu, Harris, Dodson and Du2013). Each individual animal is an experimental unit. Statistical analysis was performed using SAS 9.2 (Statistical Analysis System Institute Inc., Cary, NC, USA) and means±SEM were reported. A bilateral t-test was used to identify difference and statistical significances were considered at P<0.05. Post-hoc power analysis was conducted for each experiment and the power to discern genotype effect is shown in the corresponding figure legend.
Results
Satellite cell density was lower in Wagyu than that in Angus muscle
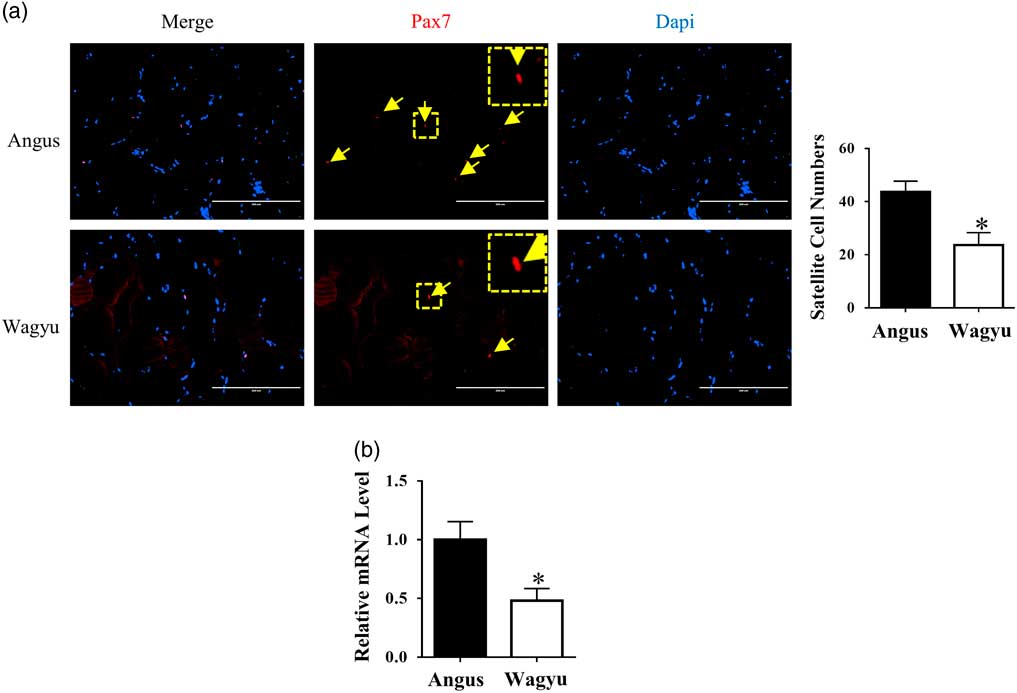
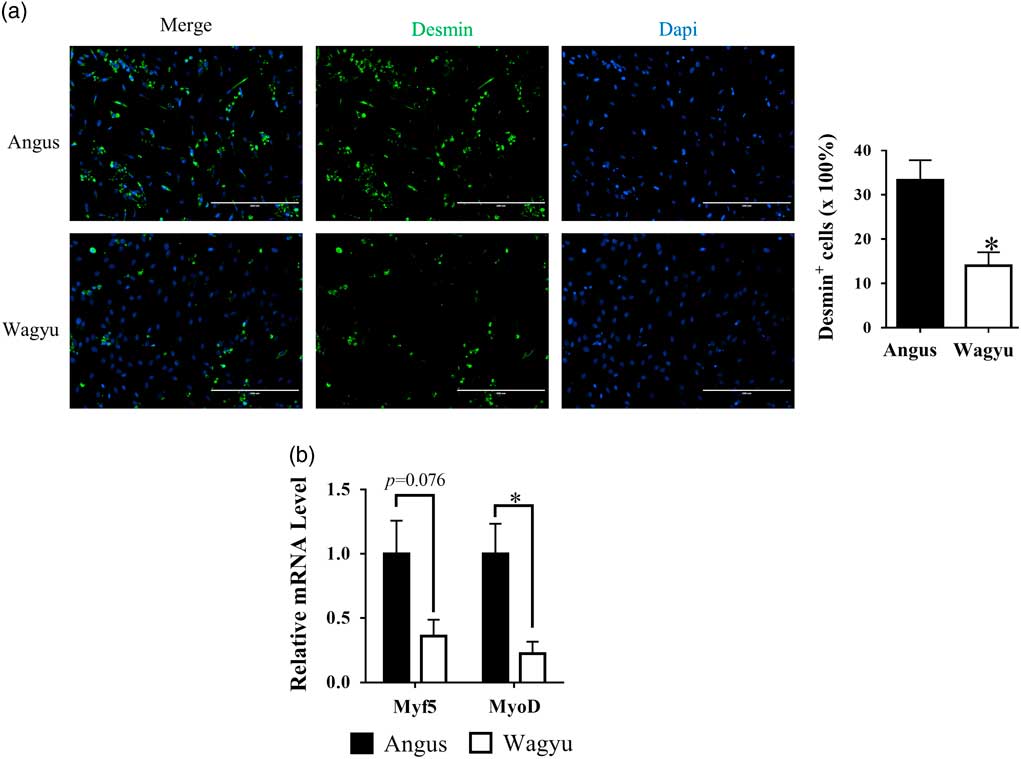
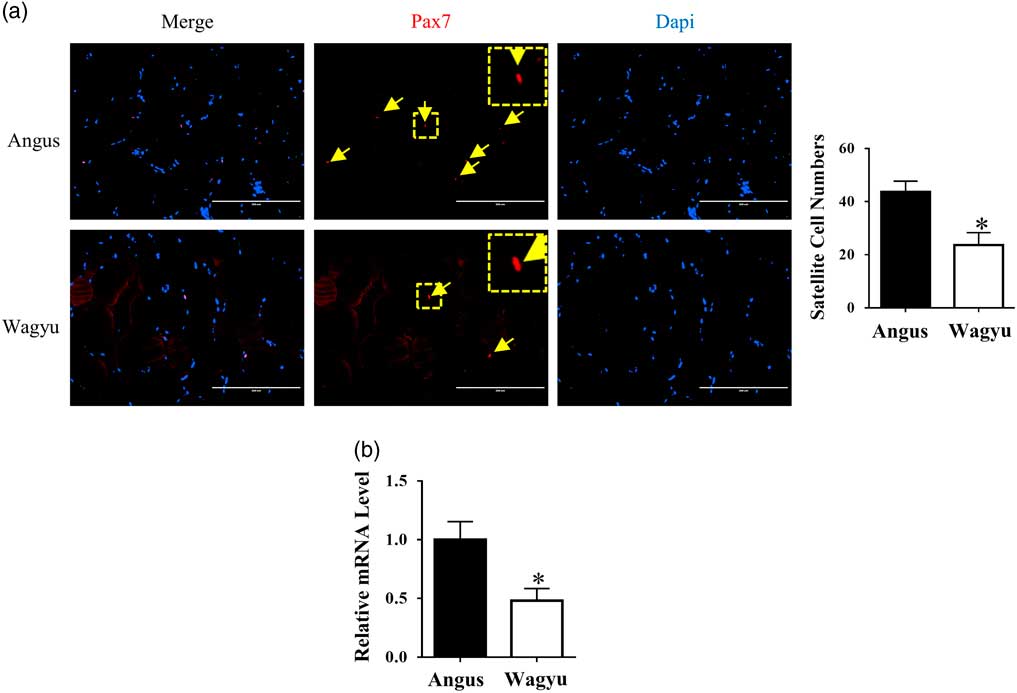
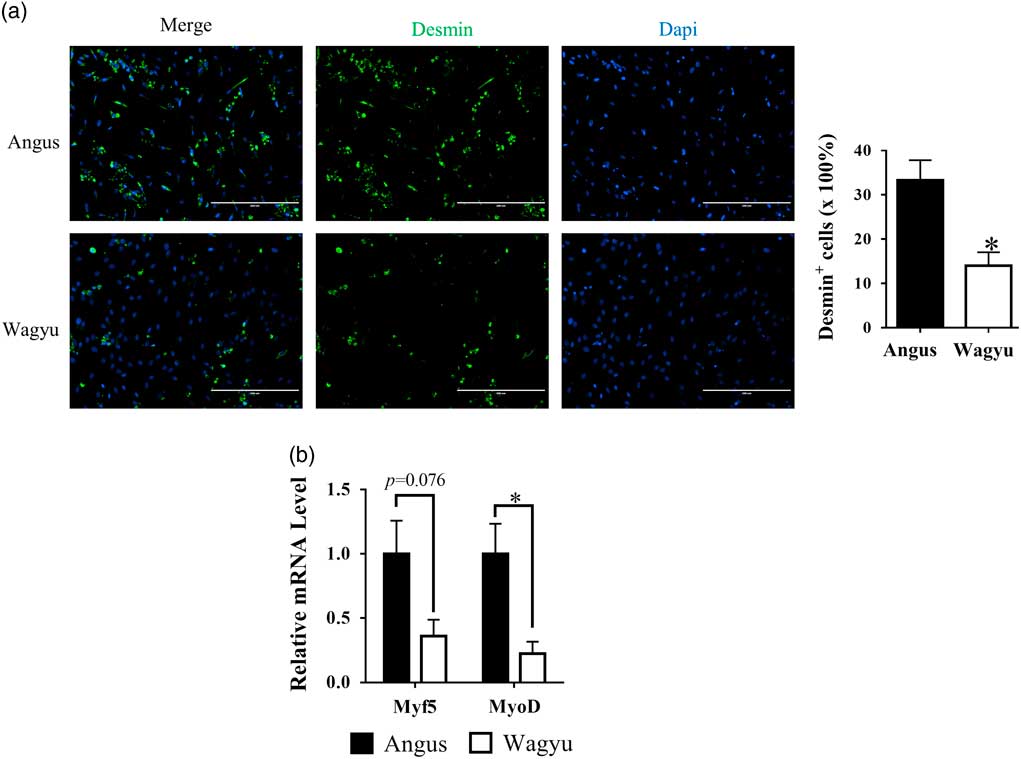
Muscle sections were staining with anti-Pax7 antibody for satellite cell identification. Satellite cell density was significantly lower in Wagyu than in Angus muscle (Figure 1a). Consistently, the mRNA level of Pax7 was lower in Wagyu muscle (Figure 1b). To better understand the single nucleated cell composition of muscle from Wagyu and Angus, these cells were isolated from muscle through enzymatic digestion. Two days after cell isolation, cells were stained with an antibody against desmin, a myoblast marker. As expected, less cells were stained positive for desmin in Wagyu as compared with Angus cells (Figure 2a). Moreover, Myf5 and MyoD, two other myoblast markers were expressed at lower levels in cells isolated from Wagyu than cells from Angus muscle, further indicating reduced myogenic cell density in Wagyu muscle compared with Angus (Figure 2b).
Satellite cell density in Wagyu cattle was lower than Angus cattle. (a) Muscle sections were stained with anti-Pax7 antibody to quantify the abundance of satellite cells (pointed by arrows) (Power=0.9). (b) Pax7 mRNA expression level in muscle of Angus cattle and Wagyu cattle was measured by real-time PCR (Power=0.8). *P<0.05; v. Angus; mean±SEM; n=3. Scale bars=200 μm.
Muscle-derived cells from Wagyu cattle contained less activated myoblasts than Angus cattle. Muscle-derived cells were isolated from Angus and Wagyu cattle, and were cultured in growth medium. (a) Cultured muscle-derived cells were stained with anti-desmin antibody to quantify activated myoblasts (Power=0.95). (b) The mRNA expression levels of myoblast markers, Myf5 (Power=0.66) and MyoD (Power=0.9), in muscle-derived cells from Angus and Wagyu cattle were measured by real-time PCR. *P<0.05; v. Angus; mean±SEM; n=3. Scale bars=200 μm.
Myogenic differentiation of muscle-derived cells isolated from Wagyu was lower than that from Angus
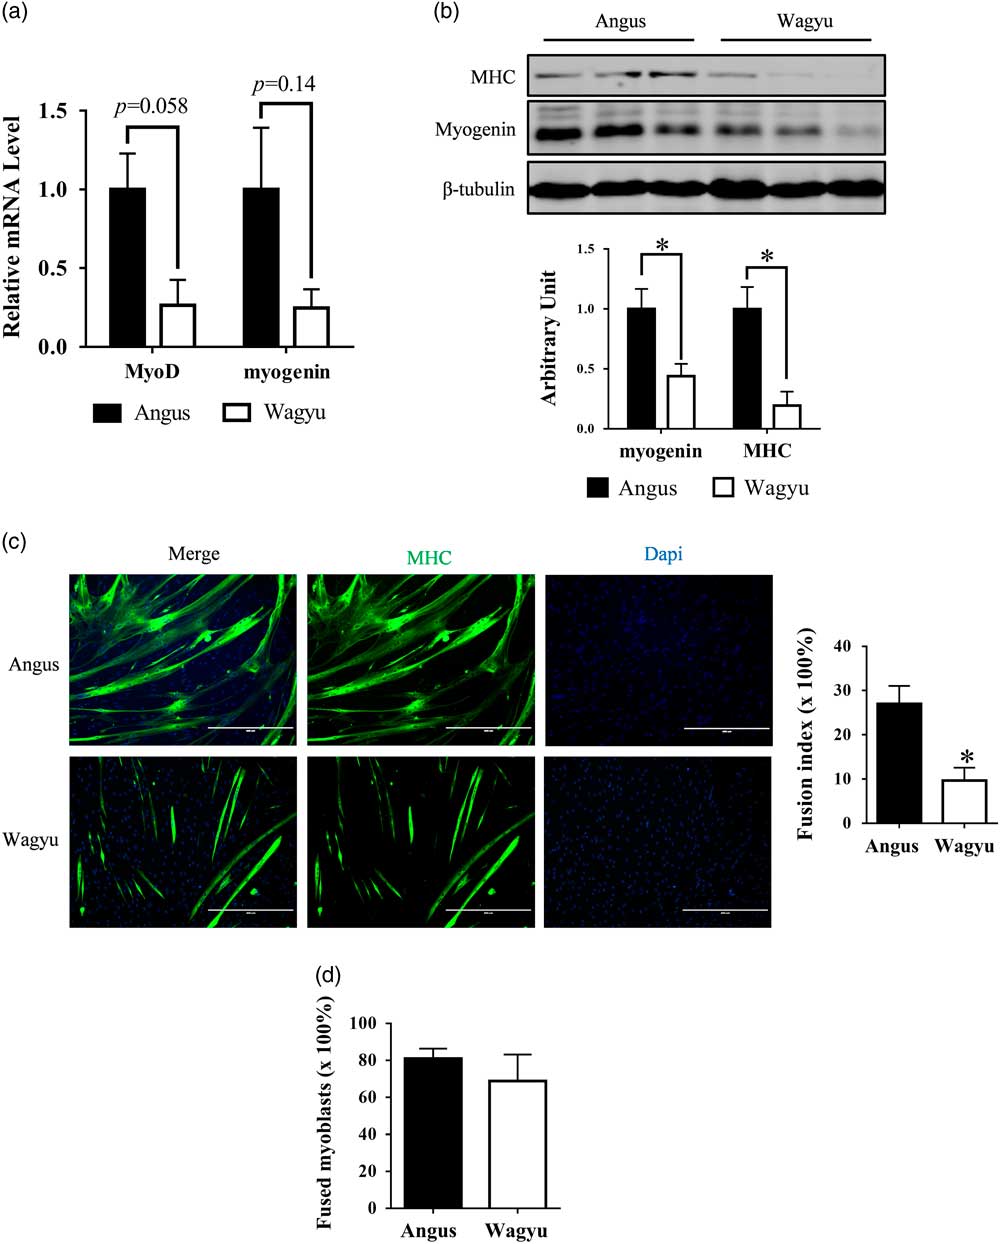
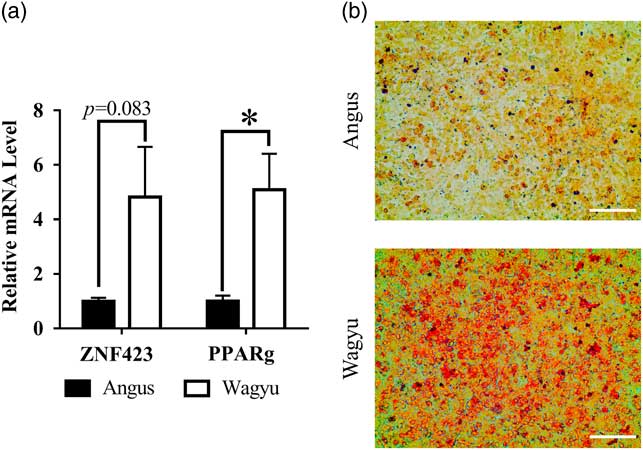
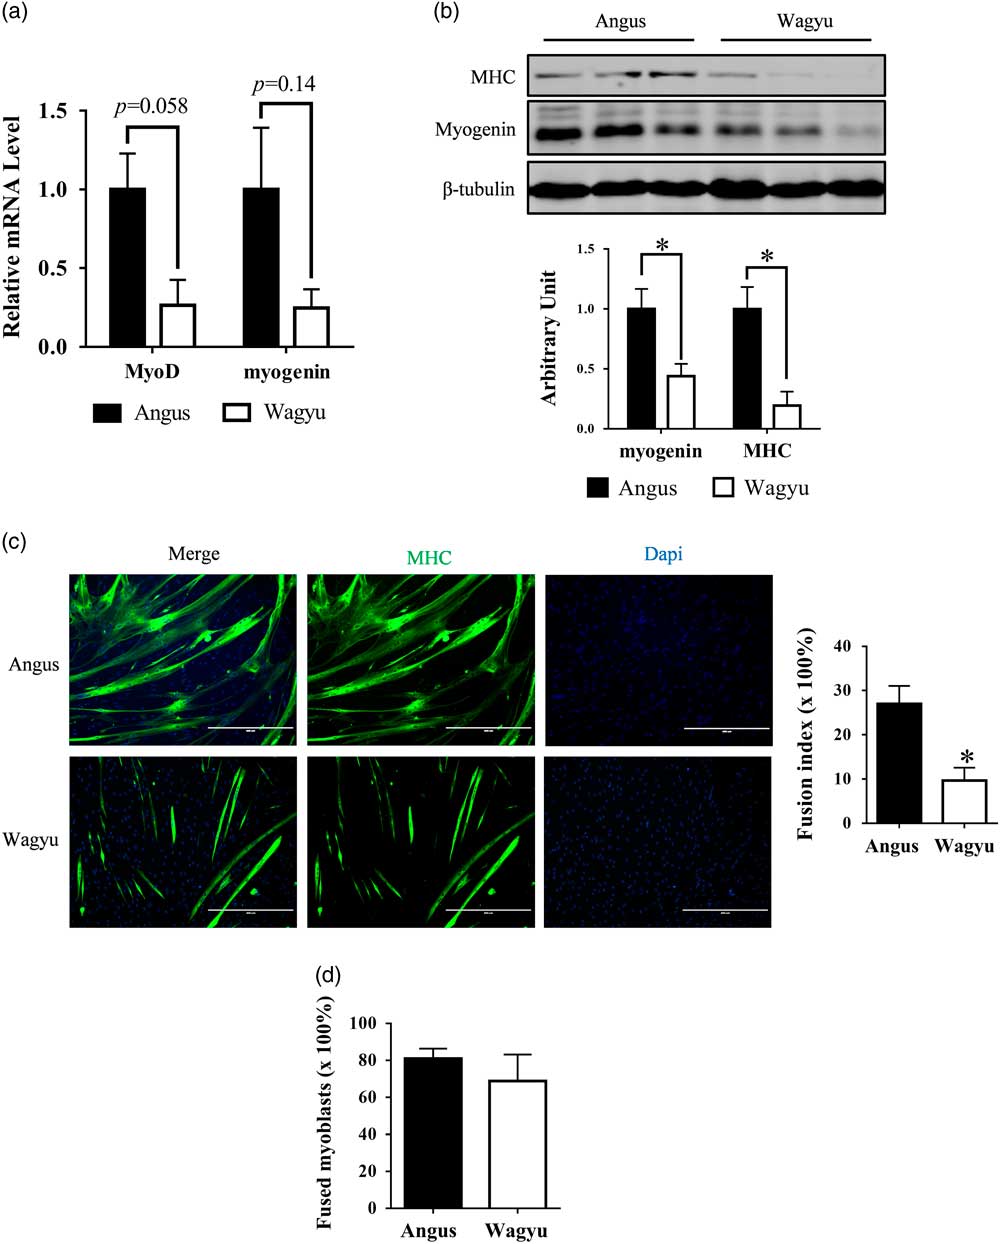
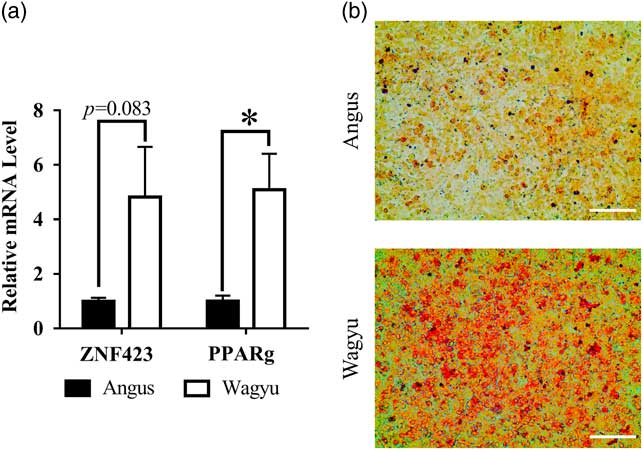
To compare the myogenic capacity of muscle-derived cells isolated from Wagyu and Angus, these cells were induced for myogenic differentiation. MyoD and myogenin mRNA expression levels were lower in cells from Wagyu compared with Angus after 2 days of myogenic induction (Figure 3a), consistent with significantly lower protein levels of myogenin and myosin heavy chain (MHC) in Wagyu after 4 days of myogenic induction, indicating that Wagyu cells had reduced myogenic differentiation (Figure 3b, Supplementary Material Figure S1). Myotube formation was further quantified by MHC immunocytochemical staining. As expected, less myotubes were seen in cells from Wagyu compared with Angus (Figure 3c). However, after normalizing the fusion index by the myogenic cell density, there was no difference in the efficiency of myoblast fusion into myotubes, suggesting that the lower myogenic differentiation of muscle-derived cells from Wagyu was mainly due to reduced myoblast numbers (Figure 3d). In contrast to myogenesis, adipogenic markers, ZNF423 and PPARγ, were expressed at greater levels in cells isolated from Wagyu than cells from Angus after 2 days of adipogenic induction, showing greater adipogenesis, which might be a combined effect of a greater number of adipogenic cells and enhanced adipogenic differentiation (Figure 4a). Consistently, lipid accumulation of cells isolated from Wagyu appeared greater than cells from Angus after 14 days of adipogenic induction (Figure 4b).
Myogenic differentiation of muscle-derived cells from Wagyu cattle was less than Angus cattle. Muscle-derived cells isolated from Angus and Wagyu cattle were cultured in growth medium until 80% confluency and were then switched to myogenic differentiation medium to induce myogenic differentiation. (a) The mRNA expression levels of MyoD (Power=0.75) and myogenin (Power=0.45) in muscle-derived cells from Angus and Wagyu cattle at 2 days after the induction of myogenic differentiation were measured by real-time PCR. (b) Protein contents of myogenin (Power=0.81) and MHC (Power=0.96) in muscle-derived cells from Angus and Wagyu cattle at 4 days after the induction of myogenic differentiation were measured by Western blot. (c) Immunocytochemistry staining of differentiated myotubes in muscle-derived cells from Angus and Wagyu cattle at 4 days after the induction of myogenic differentiation and calculated fusion index (Power=0.94). (d) Normalized fusion index indicating percentage of fused myoblasts was calculated by dividing fusion index (Figure 3c) by the percentage of myoblasts in total muscle-derived cells (Figure 2a) (Power=0.12). MHC=myosin heavy chain; *P<0.05; v. Angus; mean±SEM; n=3. Scale bars=200 μm.
Adipogenic potential of muscle-derived cells from Wagyu cattle was greater than cells from Angus cattle. Muscle-derived cells isolated from Angus and Wagyu cattle were cultured in growth medium until 80% confluency and were then switched to adipogenic differentiation medium to induce adipogenic differentiation. (a) The mRNA expression levels of ZNF423 (Power=0.63) and PPARγ (Power=0.86) in muscle-derived cells from Angus and Wagyu cattle at 2 days after the induction of adipogenic differentiation were measured by real-time PCR. (b) Representative images of Oil-Red O staining performed at 14 days of adipogenic differentiation. *P<0.05; v. Angus; mean±SEM; n=3. Scale bar=400 µm.
Average muscle fiber diameter was larger in Wagyu compared with Angus muscle
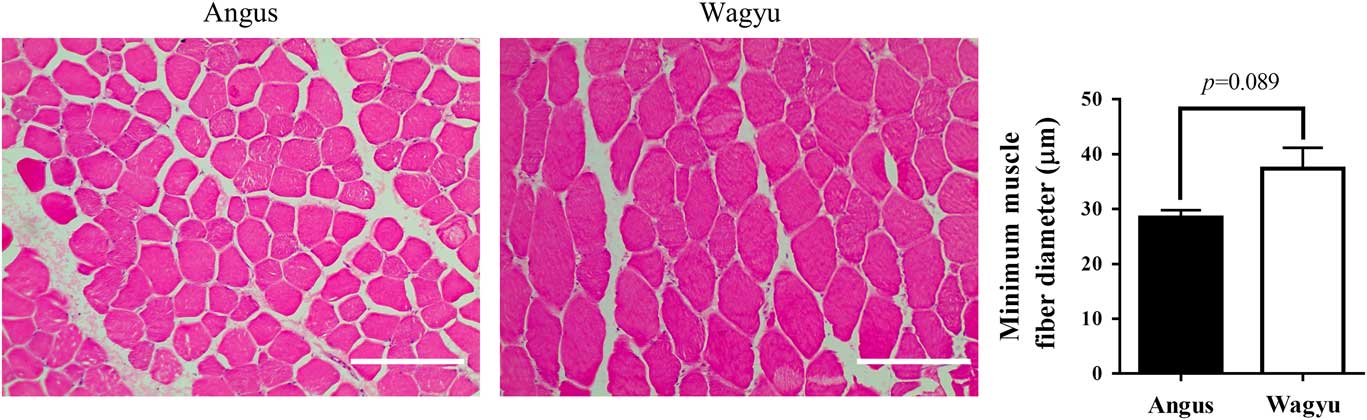
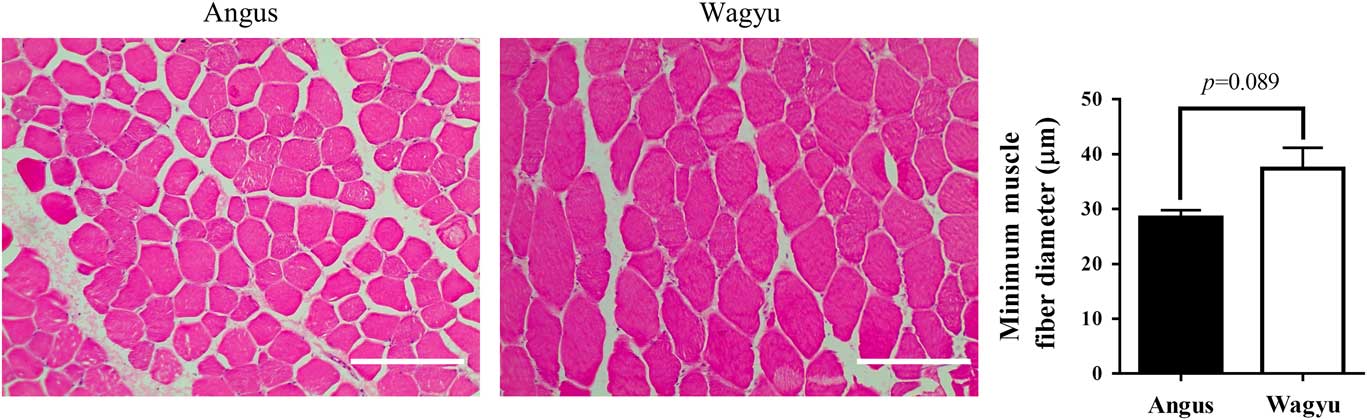
To analyze the impact of reduced satellite cells on muscle growth in Wagyu cattle, we measured the diameter of muscle fibers of Wagyu and Angus cattle. Surprisingly, the average diameters of muscle fibers from Wagyu were larger than those of Angus (by 23.9±6.8%, P=0.089), indicating that there was a smaller number of muscle fibers in Wagyu cattle compared with Angus cattle, suggesting that limited myogenesis in Wagyu muscle may contribute to their propensity to deposit more marbling (Figure 5).
Muscle fiber size of Wagyu cattle was larger than Angus cattle. HE staining was performed to muscle sections to analyze the minimum muscle fiber diameters of Angus and Wagyu cattle (Power=0.61). HE=hemotoxylin and eosin; mean±SEM; n=3. Scale bars=200 μm.
Discussion
In livestock, muscle fibers are formed before birth through two separated stages of myogenesis including primary myogenesis during the embryonic stage and secondary myogenesis primarily during the second trimester in cattle (Bonnet et al., Reference Bonnet, Cassar-Malek, Chilliard and Picard2010). Enhanced proliferation of myogenic progenitor cells and their myogenic differentiation during fetal development promote muscle fiber formation which increases offspring lean mass (Zhu et al., Reference Zhu, Ford, Nathanielsz and Du2004). Genetics such as myostatin mutation, maternal nutrition and physiological conditions affects fetal myogenesis and the subsequent formation of muscle fibers (Tong et al., Reference Tong, Yan, Zhu, Ford, Nathanielsz and Du2009; Yan et al., Reference Yan, Zhu, Xu, Tong, Ford, Nathanielsz and Du2010). In addition, during fetal development, a portion of myogenic cells become quiescent, which locate within basal lamina and form satellite cells in postnatal muscle. Thus, myogenic activity during the fetal stage correlates with satellite cell density in mature muscle (Bailey et al., Reference Bailey, Holowacz and Lassar2001).
Wagyu cattle are well known for producing high-quality beef with extremely high marbling (Lunt et al., Reference Lunt, Riley and Smith1993; Zembayashi and Lunt, Reference Zembayashi and Lunt1995). Previously, we observed that both adipogenesis and fibrogenesis are greater in Wagyu compared with Angus cattle (Duarte et al., Reference Duarte, Paulino, Das, Wei, Serao, Fu, Harris, Dodson and Du2013). Because myogenic and fibro/adipogenic cells share a common pool of progenitor cells in early embryo (Du et al., Reference Du, Huang, Das, Yang, Duarte, Dodson and Zhu2015), the greater adipogenic differentiation in Wagyu cattle is postulated to reduce myogenic differentiation. However, the muscle fiber formation and myogenic cells of Wagyu cattle has not been characterized. Satellite cell fusion into existing muscle fibers is a major mechanism of postnatal muscle growth (Davis and Fiorotto, Reference Davis and Fiorotto2009). Thus, satellite cell density was analyzed by immunostaining for Pax7, a marker of satellite cells (Davis and Fiorotto, Reference Davis and Fiorotto2009). We found that the satellite cell density in Wagyu cattle is significantly lower than that of Angus cattle, suggesting attenuated myogenesis during early development, considering that satellite cells are descendants of myogenic cells during fetal muscle development. Consistently, Wagyu muscle contains less muscle fibers than Angus muscle (Duarte et al., Reference Duarte, Paulino, Das, Wei, Serao, Fu, Harris, Dodson and Du2013). Given that muscle fibers are formed during early development, less muscle fibers further confirms the lower myogenesis occurred in Wagyu compared with Angus cattle. The lower myogenesis might not be due to impairment in myogenic differentiation of satellite cells, but rather the reduction in the abundance of satellite cells in overall muscle-derived single nuclear cells, a notion supported by the greater adipogenic capacity of Wagyu muscle-derived cells. Very interestingly, muscle fibers of Wagyu cattle were found to be larger than those of Angus cattle, which could be due to a compensatory hypertrophy of existing muscle fibers during muscle growth. Wagyu cattle grow slower than Angus cattle and, thus, require longer feeding to achieve the same market weight of Angus, resulting in compensatory muscle fiber hypertrophy and similar muscle cross area of Wagyu and Angus cattle at harvest (Lunt et al., Reference Lunt, Riley and Smith1993). In addition, Wagyu muscle has much higher intramuscular lipid and collagen content, further supporting the smaller muscle fiber number in Wagyu cattle (Duarte et al., Reference Duarte, Paulino, Das, Wei, Serao, Fu, Harris, Dodson and Du2013). In combination, these data point to a shift from myogenesis to adipo/fibrogenesis during early embryonic development in Wagyu cattle. This notion is consistent with observation in runt piglets; compared with littermates, runt piglets do not obtain sufficient nutrients during fetal development, which impair muscle fiber formation and have less muscle mass permanently (Aberle, Reference Aberle1984), but the marbling and overall adiposity are greater (Bushman, Reference Bushman2007). However, the underlying mechanisms leading to such a shift in Wagyu cattle remain to be established.
Of note, one possible limit of this study is that only B. femoris was tested and the physiology of different muscles may differ from each other. However, the high intramuscular fat content is constantly observed in meats derived from various Wagyu muscles compared with Angus muscles, which suggests that our findings could be extended to other muscles as well, including the economically important Longissimus dorsi muscle.
In summary, we found that Wagyu muscle has reduced satellite cell population and muscle fiber numbers compared with Angus cattle. Considering that both muscle fibers and satellite cells are results of fetal myogenesis, and the population of adipogenic cells is greater in Wagyu cattle, these data strongly suggest that the myogenesis is attenuated while adipogenic differentiation is enhanced during the early development of Wagyu cattle, which might provide an explanation to the high marbling but lower muscle mass in Wagyu compared with Angus cattle.
Acknowledgments
This project was supported by Agriculture and Food Research Initiative Competitive Grants no. 2015-67015-23219 and 2016-68006-24634 from the USDA National Institute of Food and Agriculture.
Supplementary material
To view supplementary material for this article, please visit https://doi.org/10.1017/S1751731117002403