





1. Introduction
This work investigates the growth of a planar three-dimensional (3-D) hydraulic fracture (HF) from the release of a finite volume of fluid from a point source and its possible transition to a self-sustained buoyant fracture. Hydraulic fractures are tensile, fluid-filled fractures driven by the internal fluid pressure exceeding the minimum compressive in situ stress (Detournay Reference Detournay2016). Natural occurrences of HFs are related to the transport of magma through the lithosphere by magmatic intrusions (Spence, Sharp & Turcotte Reference Spence, Sharp and Turcotte1987; Lister & Kerr Reference Lister and Kerr1991; Rivalta et al. Reference Rivalta, Taisne, Bunger and Katz2015) or pore pressure increases due to geochemical reactions during the formation of hydrocarbon reservoirs (Vernik Reference Vernik1994). One of the most frequent engineering applications of HFs is the production stimulation of hydrocarbon wells (Economides & Nolte Reference Economides and Nolte2000; Jeffrey et al. Reference Jeffrey, Chen, Mills and Pegg2013; Smith & Montgomery Reference Smith and Montgomery2015).
In the absence of buoyancy, the propagation of radial HFs upon the end of the release (denoted as ‘shut-in’ in industrial applications) has been analysed recently in detail (Möri & Lecampion Reference Möri and Lecampion2021). In an impermeable medium, the final radius of the HF depends solely on the material parameters and the total amount of fluid volume injected/released. However, the HF does not necessarily stop its growth directly upon the end of the release. When dissipation through viscous fluid flow is important at the end of the release, the propagation continues in a viscosity-dominated pulse regime before finally arresting at a radius independent of the release rate. These theoretical findings derived in Möri & Lecampion (Reference Möri and Lecampion2021) were recently verified experimentally by Tanikella, Sigallon & Dressaire (Reference Tanikella, Sigallon and Dressaire2023).
When considering gravity, recent research has focused on deriving the limiting volume necessary for the emergence of a 3-D buoyant fracture (Dahm Reference Dahm2000; Davis, Rivalta & Dahm Reference Davis, Rivalta and Dahm2020; Salimzadeh, Zimmerman & Khalili Reference Salimzadeh, Zimmerman and Khalili2020; Smittarello et al. Reference Smittarello, Pinel, Maccaferri, Furst, Rivalta and Cayol2021). Neglecting fluid viscosity, Davis et al. (Reference Davis, Rivalta and Dahm2020) identify a critical volume similar to previous two-dimensional (2-D) predictions (Weertman Reference Weertman1971). It is, however, impossible to constrain the ascent rate of the fracture without accounting for the effect of fluid viscosity (as discussed in Garagash & Germanovich Reference Garagash and Germanovich2014). The consensus of these studies is that the resulting buoyant fracture features a head and tail structure (Lister & Kerr Reference Lister and Kerr1991), where the head dominates the overall fracture behaviour, but the tail dominates the ascent rate (Garagash & Germanovich Reference Garagash and Germanovich2022) (see figure 1). Davis et al. (Reference Davis, Rivalta, Smittarello and Katz2023) estimate a maximum ascent velocity considering a viscosity-dominated tail. A similar solution has been derived by Garagash & Germanovich (Reference Garagash and Germanovich2014) (see Garagash & Germanovich (Reference Garagash and Germanovich2022) for details) for a finger-like fracture with a toughness-dominated head. In their work, they derive a 3-D head similar to the limiting volume of Davis et al. (Reference Davis, Rivalta and Dahm2020). This fracture ‘head’ is coupled to a tail of constant breath, providing a late-time solution after the end of the transition from radial to self-sustained buoyant propagation. Considering lubrication flow in the initially radially propagating fracture, Salimzadeh et al. (Reference Salimzadeh, Zimmerman and Khalili2020) performed a few simulations investigating the early phase of the transition to buoyant propagation. Equivalent to Davis et al. (Reference Davis, Rivalta and Dahm2020) and Garagash & Germanovich (Reference Garagash and Germanovich2014), a limiting value for the necessary volume released for a buoyant fracture to emerge is reported. All three minimal/critical volume release estimates have the same characteristic scale and differ only in prefactors. A combined study of the limiting volume, considering not only the emergence of buoyancy-driven fractures but also their evolution towards their late-time characteristics, is not yet available.
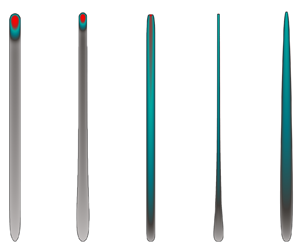
(a) Buoyant self-sustained growth of an HF. (b) Arrested HF at depth. Both fractures emerge from a finite fluid volume released from a point source through a block injection, and propagate in a homogeneous linear elastic medium ( $x\unicode{x2013}z$ plane) with the downwards oriented gravity vector
 ${\boldsymbol {g}}$ (in
 ${-z}$) creating linear confining stress
 ${\sigma _{o}(z)}$. The fracture area is denoted by
 ${\mathcal {A}(t)}$, with a closed front
 ${\mathcal {C}(t)}$ and a local normal velocity
 ${v_{c}(x_{c},z_{c})}$ (with
 ${({x_{c},}z_{c})\in {\mathcal {C}(t)}}$). The fracture extent is defined by its local breadth
 ${b(z,t)}$ and total length
 ${\ell (t)}$.

2. Preliminaries
We investigate tensile (mode I) HFs under the classical assumption of linear elastic fracture mechanics and laminar Newtonian lubrication flow (Detournay Reference Detournay2016). A finite volume is released from a point source at depth into a linearly elastic and impermeable medium with uniform properties. The fracture orientation and stress state are equivalent to those described in Möri & Lecampion (Reference Möri and Lecampion2022) and sketched in figure 1. We omit the detailed discussion of the mathematical formulation (see Möri & Lecampion (Reference Möri and Lecampion2022) for details) as the only difference pertains to the history of the fluid release. We consider here a simple injection history where the fluid volume is released at a constant rate until the end of the release at time  $t=t_{s}$ (the shut-in time), where the rate suddenly drops to zero. We denote the constant release rate during the block injection as
 $Q_{o}$ such that the rate history is simply
 \begin{equation} Q\left(t\right)=\begin{cases} Q_{o} & t\leq t_{s},\\ 0 & t>t_{s}. \end{cases}\end{equation}
The coherent global volume balance in the case of an impermeable medium is
 \begin{equation} \mathcal{V}(t)=\int_{\mathcal{A}(t)}w\left(t,x,z\right)\text{d}\kern0.7pt x\,\text{d}z=\begin{cases} Q_{o}t & t< t_{s},\\ V_{o}=Q_{o}t_{s} & t\geq t_{s}, \end{cases}\end{equation}
where  $V_{o}=Q_{o}t_{s}$ is the total volume of fluid released.
In the following, we combine scaling arguments and numerical simulations using the fully coupled planar 3-D HF solver PyFrac (Zia & Lecampion Reference Zia and Lecampion2020). We refer the reader to Peirce & Detournay (Reference Peirce and Detournay2008), Zia & Lecampion (Reference Zia and Lecampion2020) and references therein for a detailed description of the numerical scheme. In short, the solver is a Python-based displacement discontinuity method combined with the implicit level set algorithm implemented using boundary elements. The documentation of the open-source code and examples of applications are available for download at PyFrac. We initiate the fracture according to the self-similar solution of a radial, viscosity-dominated fracture (see its definition in Savitski & Detournay Reference Savitski and Detournay2002) at a fixed time  $t_{init}$. For this solution to be valid, we must ensure that the dimensionless numbers describing the transition from viscosity- to toughness-dominated (
 $\mathcal {K}_m(t)$, see (2.4)) and the change from radial to buoyant propagation (
 $\mathcal {B}_{k}(t)$ and
 $\mathcal {B}_{m}(t)$, see (2.9a,b)) are all significantly smaller than 1 at
 $t = t_{init}$. We provide the time of initialization and other parameters of the simulations in the shared data of this paper. Note that we could equivalently initiate our simulations with a finite-size radial fracture with a radius smaller than the respective transition scales
 $\ell _{mk}$,
 $\ell _{m\hat {m}}$ and
 $\ell _{k\hat {k}}$ (Savitski & Detournay Reference Savitski and Detournay2002; Möri & Lecampion Reference Möri and Lecampion2022). The simulation would then automatically approach the self-similar, viscosity-dominated solution. Note that in any case, we need to ensure that
 $t_{init} \ll t_s$ or equivalently for a finite-size fracture,
 $\ell _{init} \ll R_{a}$ (see (2.3)).
2.1. Arrest of a finite-volume radial HF without buoyancy
In the absence of buoyant forces, considering the limiting case of an impermeable medium, HFs finally arrest after the end of the injection when reaching an equilibrium between the injected volume and the linear elastic fracture mechanics propagation condition. This problem was investigated in Möri & Lecampion (Reference Möri and Lecampion2021). The fracture characteristics at arrest are independent of the shut-in time  $t_{s}$. They depend only on the properties of the solid and the total amount of fluid released. For example, the arrest radius
 $R_{a}$ (subscript
 $a$ for arrest) is given by
 \begin{equation} R_{a}=\left(\frac{3}{8\sqrt{\rm \pi}}\right)^{2/5}\left(\frac{E^{\prime}V_{o}}{K_{Ic}}\right)^{2/5},\end{equation}
where  $E^{\prime }=E/(1-\nu ^{2})$ is the plane-strain modulus, with
 $E$ the material's Young's modulus and
 $\nu$ its Poisson's ratio, and
 ${K_{Ic}}$ is the fracture toughness of the material.
Even though the arrest radius is independent of  $t_{s}$, the growth history prior to arrest depends on it. In particular, the arrest is not necessarily immediate after the end of the release. Notably, the arrest is not immediate when the HF propagates in the viscosity-dominated regime at the end of the release. The immediate arrest versus continuous growth is captured by the value of the dimensionless toughness at the shut-in time:
 \begin{equation} \mathcal{K}_{ms}=K_{Ic}\,\frac{t_{s}^{1/9}}{E^{\prime13/18}\mu^{\prime5/18}Q_{o}^{1/6}},\end{equation}
where  $\mu ^{\prime }=12\mu$, and
 $\mu$ is the fracturing fluid viscosity. In (2.4), we have used the subscripts
 $m$ and
 $s$ to indicate, respectively, a viscous scaling and the end of the release. If the fracture is viscosity-dominated (
 $\mathcal {K}_{ms}\ll 1$), then it propagates in a viscosity-dominated pulse regime for a while until it finally arrests when reaching
 $R=R_{a}$. On the other hand, if fracture energy is already dominating (
 $\mathcal {K}_{ms}\gg 1$), then the arrest is immediate upon shut-in. The viscosity-dominated pulse regime has been shown to emerge for
 $\mathcal {K}_{ms}\lessapprox 0.3$ (for a detailed description of the viscosity-dominated pulse regime, see § 3.2 of Möri & Lecampion Reference Möri and Lecampion2021). A numerical estimation of the immediate arrest yields a value
 $\mathcal {K}_{ms}\gtrapprox 0.8$ (note that Möri & Lecampion (Reference Möri and Lecampion2021) report a value
 $2.5$ due to an alternative definition of (2.4) using
 $K^{\prime }=\sqrt {32/{\rm \pi} }\,K_{Ic}$ instead of
 $K_{Ic}$).
2.2. Buoyant HF under a continuous release
In the case of a fluid release occurring at a constant volumetric rate  $Q_{o}$, the fracture elongates along the orientation of the gravity vector. These buoyant forces are generated by the density difference between the solid and the fracturing fluid. To obtain the value of the buoyancy, we assume fractures propagating in vertical planes and the minimum in situ horizontal stress as
 \begin{equation} \sigma_o(z) = \sigma_h(z) = \alpha\,\sigma_v^{\prime}(z) + p_p(z), \end{equation}
with  $\sigma _h$ the minimum in situ horizontal stress,
 $\sigma _v^{\prime }$ the effective vertical stress,
 $\alpha$ a lateral Earth pressure coefficient, and
 $p_p$ the pore pressure in the formation. Assuming now that the vertical stress is lithostatic,
 $\sigma _v = \rho _s g z'$, and the formation fluid pressure is hydrostatic,
 $p_p = \rho _F g z'$, the gradient of the stress normal to the fracture plane is (in the coordinate system sketched in figure 1)
 \begin{equation} \boldsymbol{\nabla}\sigma_o = \left(\alpha(\rho_s -\rho_F) + \rho_F\right)\boldsymbol{g}, \end{equation}
where  $\rho _s$ is the solid and
 $\rho _F$ the formation fluid density,
 $g$ is the Earth's gravitational acceleration coefficient, and
 $\boldsymbol {g} = (0,0,-g)$ is the gravity vector. Using the net pressure (
 $p = p_f -\sigma _o$) in the Poiseuille relation, we obtain the expression
 \begin{gather} \boldsymbol{q}(x,z,t) ={-} \frac{w(x,z,t)^3}{\mu^{\prime}} \left(\boldsymbol{\nabla} p (x,z,t) + {\rm \Delta}\gamma\, \frac{\boldsymbol{g}}{\lvert\boldsymbol{g}\rvert}\right), \end{gather}
 \begin{gather}\text{with } {\rm \Delta}\gamma = \left(\alpha(\rho_s -\rho_F) + \rho_F - \rho_f \right) g. \end{gather}
In (2.8),  ${\rm \Delta} \gamma$ is the effective buoyancy contrast of the system. A positive buoyancy will lead to a fracture elongation in the opposite direction of the gravity vector. A negative buoyancy will lead to propagation in the direction of the gravity vector. Without additional stresses (e.g. tectonic stresses), the lateral Earth pressure coefficient can be approximated as
 $\alpha = \nu /(1-\nu )$. In the following, we include any tectonic or other effects into
 $\alpha$ and assume, consistent with (2.8), that
 ${\rm \Delta} \gamma = {\rm const}$. Note that the expression for
 ${\rm \Delta} \gamma$ differs from that in Möri & Lecampion (Reference Möri and Lecampion2022), where we assumed a dry formation (e.g.
 $p_p = 0$). Two dimensionless buoyancies related to either the viscosity-dominated (subscript
 $m$) or the toughness-dominated (subscript
 $k$) regime emerge (Möri & Lecampion Reference Möri and Lecampion2022):
 \begin{equation} \mathcal{B}_{m}={\rm \Delta}\gamma\,\frac{Q_{o}^{1/3}t^{7/9}}{E^{\prime5/9}\mu^{\prime4/9}},\quad \mathcal{B}_{k}={\rm \Delta}\gamma\,\frac{E^{\prime3/5}Q_{o}^{3/5}t^{3/5}}{K_{Ic}^{8/5}}.\end{equation}
These dimensionless buoyancies are related through the dimensionless viscosity of a radial fracture when buoyancy becomes of order  ${O}(1)$:
 \begin{equation} \mathcal{M}_{\hat{k}}=\mu^{\prime}\,\frac{Q_{o}E^{\prime3}\,{\rm \Delta}\gamma^{2/3}}{K_{Ic}^{14/3}}\end{equation}
as
 \begin{equation} \mathcal{B}_{k}=\mathcal{B}_{m}^{27/35}\mathcal{M}_{\hat{k}}^{12/35}.\end{equation}
Similar to the dimensionless toughness at the end of the release  $\mathcal {K}_{ms}$ (see (2.4)),
 $\mathcal {M}_{\hat {k}}$ determines if the transition from a radial to an elongated buoyant fracture occurs in the viscosity-dominated (
 $\mathcal {M}_{\hat {k}}\gg 1$) or toughness-dominated (
 $\mathcal {M}_{\hat {k}}\ll 1$) phase of the radial HF propagation. A family of solutions emerges as a function of this dimensionless viscosity
 $\mathcal {M}_{\hat {k}}$, as discussed in detail in Möri & Lecampion (Reference Möri and Lecampion2022). Notably, a limiting large toughness solution has been obtained in Garagash & Germanovich (Reference Garagash and Germanovich2014) (see details in Garagash & Germanovich Reference Garagash and Germanovich2022). This large toughness limit is observed for
 $\mathcal {M}_{\hat {k}}\leq 10^{-2}$ (Möri & Lecampion Reference Möri and Lecampion2022) and shows a buoyant finger-like fracture with a constant breadth and a fixed-volume head. These attributes, combined with a constant injection rate, lead to a linear growth rate of the buoyant fracture. In an intermediate range of values for
 $\mathcal {M}_{\hat {k}}\in [10^{-2},10^{2}]$, the fractures exhibit a uniform horizontal breadth and a finger-like shape. In this range of
 $\mathcal {M}_{\hat {k}}$, the prefactors (for length, width, etc.) become dependent on the dimensionless viscosity
 $\mathcal {M}_{\hat {k}}$ (see (2.4)). In particular, an increase in fracture breadth and head volume is observed with increasing values of
 $\mathcal {M}_{\hat {k}}$. Even larger values of
 $\mathcal {M}_{\hat {k}}\geq 10^{2}$ generate fractures exhibiting a negligible-toughness, buoyant solution at intermediate times, where the growth of the fracture is sub-linear. The breadth of these fractures increases for a while before reaching an ultimately constant value determined by the non-zero fracture toughness value. The fracture's growth rate then becomes constant. Concurrently, the head and tail structure stabilizes. In the strictly zero-toughness limit, the breadth increases continuously, and the fracture height growth remains sub-linear due to global volume balance.
2.3. Hydrostatically loaded radial fracture
The occurrence of the self-sustained buoyant growth of a finite-volume fracture has been investigated by several authors from the point of view of the static linear elastic equilibrium of a radial fracture under a linearly varying load (Davis et al. Reference Davis, Rivalta and Dahm2020, Reference Davis, Rivalta, Smittarello and Katz2023; Salimzadeh et al. Reference Salimzadeh, Zimmerman and Khalili2020). Under the hypothesis of zero viscous flow, the net loading opening the fracture is equal to the hydrostatic fluid pressure minus the linearly varying background stress  $\sigma _{o}(z)$. The elastic solution and the evolution of the stress-intensity factor (SIF) at the upper and lower tips are known analytically for this loading (Tada, Paris & Irwin Reference Tada, Paris and Irwin2000) (see § 2.2 of Davis et al. (Reference Davis, Rivalta and Dahm2020) for a detailed derivation). Adopting a linear elastic fracture mechanics propagation condition, the SIF
 $K_{I}$ at the upper end is set to the material fracture toughness
 $K_{Ic}$. On the other hand, the lower-tip SIF is set to zero, allowing the fracture to close and liberate the volume necessary for further upward propagation. Enforcing the conditions of
 $K_{I}=K_{Ic}$ at the upper tip and
 $K_{I}=0$ at the lower tip constrains the limiting volume to
 \begin{equation} V_{{limit}}\propto\frac{K_{Ic}^{8/3}}{E^{\prime}\,{\rm \Delta}\gamma^{5/3}}=V_{\hat{k}}^{{head}}.\end{equation}
This minimal volume for buoyant propagation has been identified independently in recent contributions (Davis et al. Reference Davis, Rivalta and Dahm2020, Reference Davis, Rivalta, Smittarello and Katz2023; Salimzadeh et al. Reference Salimzadeh, Zimmerman and Khalili2020) and corresponds to that of the toughness-dominated head of a buoyant HF in the case of a constant release (Garagash & Germanovich Reference Garagash and Germanovich2014; Möri & Lecampion Reference Möri and Lecampion2022).
If the volume of fluid released in the radial fracture is slightly larger than this value, then the upper tip would have a stress intensity  $K_{I}>K_{Ic}$, indicating excess energy leading to upward propagation. Similarly, the lower end would have
 $K_{I}<0$ and the fracture would interpenetrate. Small perturbations of the released volume around this minimum would lead to either an arrest of the fracture (lower volume) or a departure of a buoyant fracture (larger volume). Note that when the fracture volume equals this minimal volume and fluid viscosity is neglected, the previous derivation fails to predict how the fracture will propagate subsequently. Only the introduction of fluid viscosity can resolve the physical limitation of this approach.
In addition, the previous derivation of the minimum volume for a buoyant self-sustained propagation assumes a perfectly radial shape until the entire fluid volume has been released. This approach is equivalent to considering buoyancy only at this moment. It does not cover cases where buoyant forces become non-negligible when the fracture is still propagating (whether this is the case during the release or after its end).
3. Arrest at depth versus self-sustained propagation of buoyant HFs
From the discussion of the arrest radius of an HF in the absence of buoyancy (see § 2.1) and the regimes of buoyant HF growth under a continuous release (see § 2.2), we can anticipate several scenarios with respect to the emergence of a self-sustained buoyant finite volume fracture. The transition towards buoyancy-driven growth can occur during the release of fluid or during the pulse propagation phase when the propagation is viscosity-dominated at the end of the release. We investigate these different propagation histories in relation to the dimensionless buoyancies and dimensionless buoyant viscosity introduced in § 2, and discuss their relationship with the critical minimum volume (2.12).
3.1. Toughness-dominated at the end of the release
We first investigate the case where the fracture is toughness-dominated at the end of the release. In the absence of buoyancy, a constant fluid pressure establishes in the penny-shaped fracture, which stops immediately at its arrest radius  $R_{a}$ (see (2.3)). Due to the addition of buoyant effects, a linear pressure gradient develops and creates the configuration discussed above (see § 2.3). We anticipate that the total volume released must exceed
 $V_{\hat {k}}^{{head}}$ (2.12) for a buoyant fracture to emerge. Neglecting the temporal evolution, the comparison
 $V_{o}/V_{\hat {k}}^{{head}}$ is sufficient to assess the emergence of buoyant fractures. When considering a radial growth in time, the dimensionless buoyancy
 $\mathcal {B}_{k}(t)$ (see (2.9a,b)) indicates when buoyant forces become dominant. Estimating
 $\mathcal {B}_{k}(t)$ at the end of the release
 $t=t_{s}$, we obtain
 \begin{equation} \mathcal{B}_{ks}=\mathcal{B}_{k}\left(t=t_{s}\right)={\rm \Delta}\gamma\, \frac{E^{\prime3/5}Q_{o}^{3/5}t_{s}^{3/5}}{K_{Ic}^{8/5}}={\rm \Delta}\gamma\, \frac{E^{\prime3/5}V_{o}^{3/5}}{K_{Ic}^{8/5}}=\left(\frac{V_{o}}{V_{\hat{k}}^{{head}}}\right)^{3/5}.\end{equation}
From (3.1), we see that the condition of a dimensionless buoyancy at the end of the release  $\mathcal {B}_{ks}>1$ (under the hypothesis of a radial toughness-dominated fracture) is strictly equivalent to the condition of a released volume larger than the minimal volume for buoyant growth (2.12).
3.2. Viscosity-dominated at the end of the release ( $\mathcal {K}_{ms}\ll 1$)

In contrast to toughness-dominated HFs, radial viscosity-dominated fractures at the end of the release will continue to propagate in a viscous pulse regime until they reach their arrest radius  $R_{a}$ (see (2.3)) (Möri & Lecampion Reference Möri and Lecampion2021). During that post-release propagation phase, the fracture may become buoyant and continue its growth. In addition, we need to check if it remains buoyant when it is already so at the end of the release. This can be done by estimating the dimensionless buoyancy of a radial viscous fracture
 $\mathcal {B}_{m}(t)$ (see (2.9a,b)) at the end of the release
 $t=t_{s}$:
 \begin{equation} \mathcal{B}_{ms}=\mathcal{B}_{m}\left(t=t_{s}\right)={\rm \Delta}\gamma\, \frac{Q_{o}^{1/3}t_{s}^{7/9}}{E^{\prime5/9}\mu^{\prime4/9}}={\rm \Delta}\gamma\, \frac{V_{o}^{1/3}t_{s}^{4/9}}{E^{\prime5/9}\mu^{\prime4/9}}.\end{equation}
A value  $\mathcal {B}_{ms}\geq 1$ indicates that the fracture has already transitioned to buoyant propagation when the release stops and is already elongated. On the other hand, if
 ${\mathcal {B}_{ms}<1}$, then buoyancy is not of primary importance at the end of the release, and the fracture still exhibits an essentially radial shape.
3.2.1. Dominant buoyancy at the end of the release $\mathcal {B}_{ms}\geq 1$

In the case  $\mathcal {B}_{ms}\geq 1$, the fracture is already buoyant at the end of the release. We must check if it remains buoyant or possibly arrests after the release ends. It is natural to compare the volume of the viscous head at the end of the release
 $V_{\hat {m}}^{{head}}(t=t_{s})$ to the limiting volume (2.12). The time-dependent volume of a viscous head is given in (5.6) of Möri & Lecampion (Reference Möri and Lecampion2022) and relates to (3.2) as
 \begin{equation} \mathcal{B}_{ms}=\left(\frac{V_{o}}{V_{\hat{m}}^{{head}}\left(t=t_{s}\right)}\right)^{2/3}.\end{equation}
Using the relationship (2.11), we obtain the following relation for the minimal limiting volume:
 \begin{equation} \frac{V_{o}}{V_{\hat{k}}^{{head}}}=\left(\frac{V_{o}}{V_{\hat{m}}^{{head}} \left(t=t_{s}\right)}\right)^{6/7}\mathcal{M}_{\hat{k}}^{4/7}. \end{equation}
For a viscosity-dominated fracture, one has  $\mathcal {M}_{\hat {k}}\geq 1$ necessarily, and to be buoyant at the end of the release, we have
 $V_{o}\geq V_{\hat {m}}^{{head}}(t=t_{s})$ necessarily as
 $\mathcal {B}_{ms}\geq 1$. As a result of the previous relations, we have
 $V_{o}\geq V_{\hat {k}}^{{head}}$ necessarily, respectively
 $\mathcal {B}_{ks}\ge 1$, and the volume released is larger than the minimum required for a toughness-dominated radial fracture subjected to a linear pressure gradient to become buoyant. After the release has ended, the viscous forces diminish in the head, which ultimately becomes toughness-dominated. As a result, after the release, as buoyancy is of order 1, the condition
 $\mathcal {B}_{ks}\ge 1$ is always satisfied, and self-sustained buoyant growth will continue necessarily.
3.2.2. Viscosity-dominated fracture with negligible buoyant forces at the end of the release ($\mathcal {B}_{ms}<1$)

If buoyancy forces are negligible at the end of the release, and the propagation is viscosity-dominated ( ${\mathcal {B}_{ms}<1}$ and
 $\mathcal {K}_{ms}\ll 1$), then the finite volume fracture will continue to grow radially in a viscous pulse regime for a while before it finally arrests. In the presence of buoyant forces, it may be possible that buoyancy takes over as a driving mechanism before the fracture arrests. To incorporate such a possible growth history into the analysis, we use a dimensionless buoyancy in such a radial viscous pulse regime:
 \begin{equation} \mathcal{B}_{m}^{[V]}\left(t\right)={\rm \Delta}\gamma\, \frac{V_{o}^{1/3}t^{4/9}}{E^{\prime5/9}\mu^{\prime4/9}}= \mathcal{B}_{ms}\left(t/t_{s}\right)^{4/9},\end{equation}
where the superscript  $[V]$ indicates that the scaling is related to a finite-volume release (replacing
 $Q_{o}$ by
 $V_{o}/t$ in the continuous release expression). From Möri & Lecampion (Reference Möri and Lecampion2021), we know that the radial viscous pulse fracture stops propagating when it becomes toughness-dominated. The corresponding time scale for which
 $\mathcal {\mathcal {K}}_{m}^{[V]}$ of a finite-volume radial HF in the absence of buoyancy (see equation (10) of Möri & Lecampion Reference Möri and Lecampion2021) becomes of order 1, and the fracture arrest is given by
 \begin{equation} t_{mk}^{[V]}=\frac{E^{\prime13/5}V_{o}^{3/5}\mu^{\prime}}{K_{Ic}^{18/5}}.\end{equation}
It is thus possible to check if buoyancy is of order 1 at this characteristic time of arrest by estimating the value of the dimensionless buoyancy  $\mathcal {B}_{m}^{[V]}(t)$ from (3.5) at
 $t=t_{mk}^{[V]}$:
 \begin{equation} \mathcal{B}_{m}^{[V]}\left(t=t_{mk}^{[V]}\right)= {\rm \Delta}\gamma\,\frac{E^{\prime3/5}V_{o}^{3/5}}{K_{Ic}^{8/5}}= \left(\frac{V_{o}}{V_{\hat{k}}^{{head}}}\right)^{3/5}=\mathcal{B}_{ks}.\end{equation}
Interestingly, this evaluation is strictly equivalent to the comparison of the limiting  $V_{\hat {k}}^{{head}}$ with the total released volume
 $V_{o}$ (see (3.1)). We conclude that regardless of the propagation history, comparing the released volume with the limiting volume for toughness-dominated buoyant growth is sufficient to characterize the emergence of a self-sustained buoyant HF. In what follows, we use the dimensionless buoyancy of a radial toughness-dominated finite-volume HF
 $\mathcal {B}_{ks}$ to quantify the emergence of self-sustained growth (
 $\mathcal {B}_{ks}>1$). Similarly, the volume ratio
 $V_{o}/V_{\hat {k}}^{{head}}=\mathcal {B}_{ks}^{5/3}$ could also be used.
3.3. Structure of the solution for a finite volume release
In the preceding subsections, the necessary and sufficient condition for the birth of a buoyant fracture  $\mathcal {B}_{ks}\geq 1$ (see (3.1)) was derived. The fact that the birth (or not) of a buoyant HF depends solely on the total released volume and elastic parameters but is independent of how the volume is accumulated intrinsically derives from this statement. Furthermore, we discussed that the characteristics of self-sustained buoyant fractures depend additionally on the dimensionless viscosity
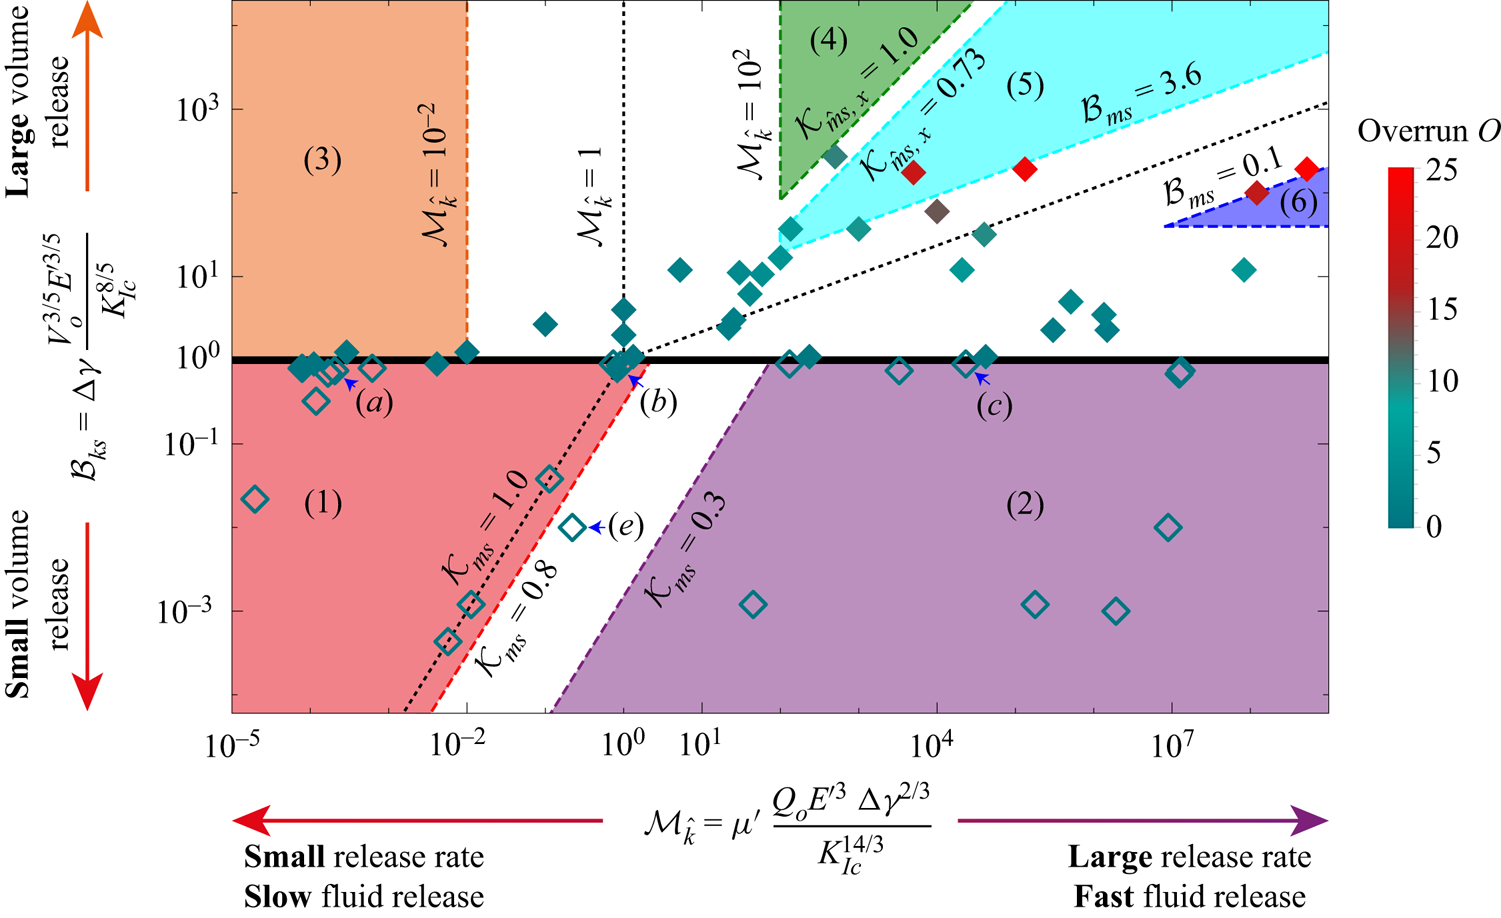
 $\mathcal {M}_{\hat {k}}$ (see (2.10)), and hence on the specifics of the release (how the volume got released). These two parameters combined encompass any possible configuration and thus form the parametric space of the entire problem (see figure 2).
Structure of the solution for a finite-volume release HF as a function of the dimensionless buoyancy  $\mathcal {B}_{ks}$ (see (3.1)) and viscosity
 ${\mathcal {M}_{\hat {k}}}$ (see (2.10)). Each symbol represents a simulation. Arrested fractures have empty symbols, and filled symbols indicate self-sustained buoyancy-driven pulses. Numbered areas of different colours delimit distinct propagation histories. The colour of the symbols represents the value of the horizontal overrun
 $O$ (see (5.4)). We indicate the simulations presented in figure 3 via blue arrows.
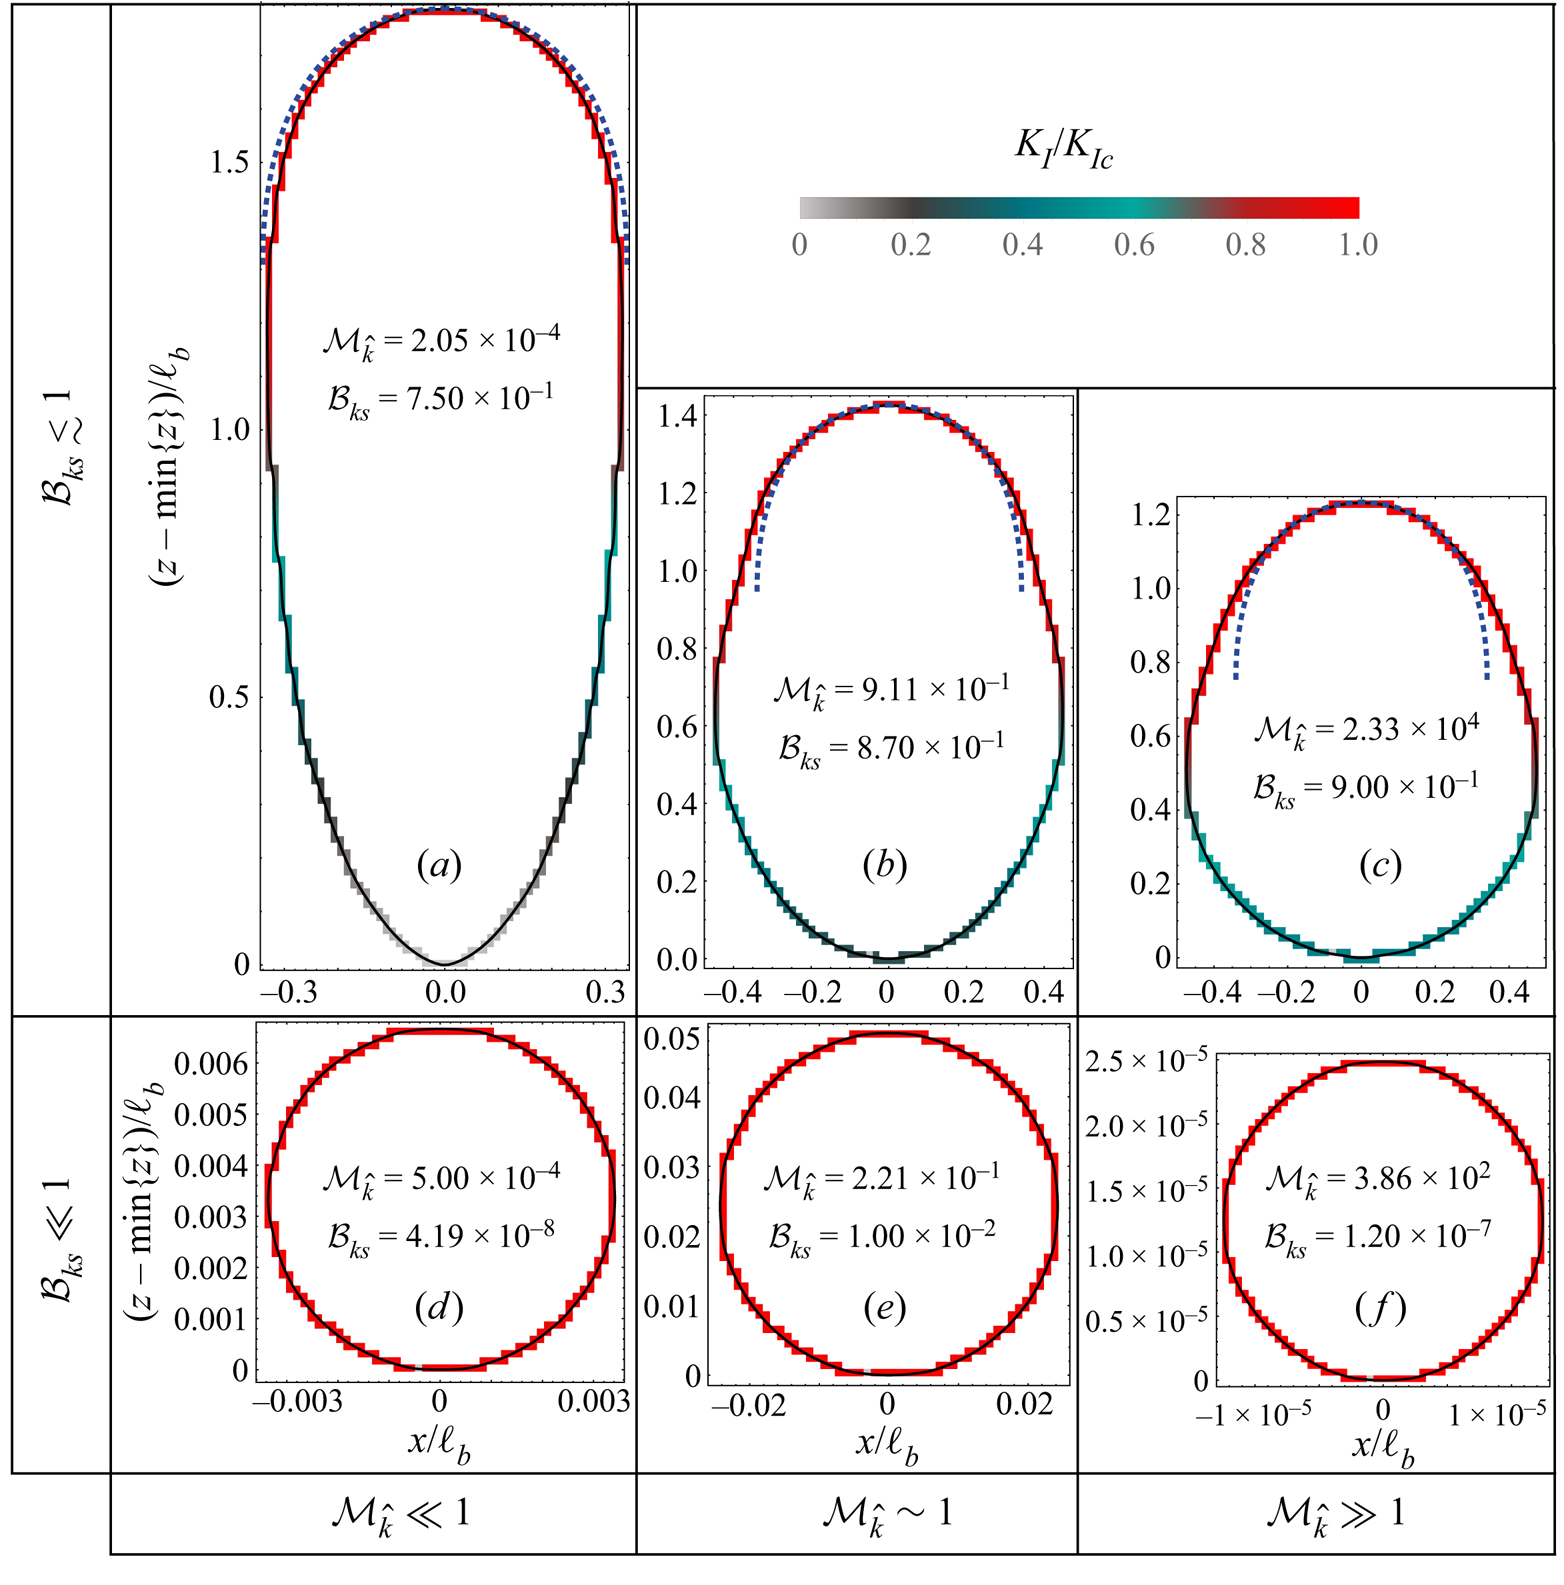
Final shape and SIFs along the front  $\mathcal {C}(t)$ of ultimately arrested fractures at depth (
 $\mathcal {B}_{ks}<1$) as a function of
 $\mathcal {B}_{ks}$ and
 $\mathcal {M}_{\hat {k}}$. Colours indicate the ratio between the local SIF
 $K_{I}$ and the material fracture toughness
 $K_{Ic}$ from 0 (light grey) to 1 (red). The blue dashed lines in (a–c) correspond to the shape of an expanding head of a propagating toughness-dominated buoyant fracture (Garagash & Germanovich Reference Garagash and Germanovich2014).
First, the parametric space can be split into an upper half ( $\mathcal {B}_{ks}\geq 1$) where self-sustained buoyant propagation occurs, and a lower half (
 $\mathcal {B}_{ks}<1$) where the fractures ultimately arrest at depth. We have investigated this limit numerically, where every symbol in figure 2 corresponds to a simulation. Empty symbols show simulations where the fracture ultimately arrests at depth, whereas filled symbols correspond to cases where self-sustained buoyant growth occurs. In general, figure 2 shows that the scaling argument that self-sustained buoyant growth occurs for
 $\mathcal {B}_{ks}\geq 1$ is correct without any prefactor. Only toughness-dominated fractures at the end of the release (
 $\mathcal {K}_{ms}\geq 0.8$, where no post-injection radial propagation occurs) sometimes lead to self-sustained buoyant growth for values of
 $\mathcal {B}_{ks}$ slightly smaller than 1. We use a value
 $\mathcal {B}_{ks}=1$ as the limit for the birth of a self-sustained finite-volume buoyant HF. This limit is close to the results obtained in previous contributions:
 $\mathcal {B}_{ks}\approx 0.90$ for Davis et al. (Reference Davis, Rivalta and Dahm2020), and
 $\mathcal {B}_{ks}\approx 0.91$ for Salimzadeh et al. (Reference Salimzadeh, Zimmerman and Khalili2020). The equivalent value of
 $\mathcal {B}_{ks}$ calculated from the semi-analytically derived head volume of a propagating toughness-dominated buoyant fracture by Garagash & Germanovich (Reference Garagash and Germanovich2014) is significantly higher:
 $\mathcal {B}_{ks}\approx 1.26$.
The parametric space of figure 2 captures more than the limit between fractures that ultimately arrest and self-sustained buoyant pulses. We distinguish six well-defined regions, corresponding to several propagation histories visiting the limiting regimes of radial and buoyant growth: stagnant fractures with a toughness-dominated end of the release (region 1, bottom left, red, § 4), stagnant fractures with a viscosity-dominated end of the release (region 2, bottom right, purple, § 4), toughness-dominated buoyant fractures at the end of the release (region 3, top left, orange, § 5.1), viscosity-dominated buoyant fractures with a stabilized breadth at the end of the release (region 4, top centre, dark green, § 5.2.2), viscosity-dominated buoyant fractures without stabilization at the end of the release (region 5, top centre, light blue, § 5.2.1), and viscosity-dominated radial fractures at the end of the release (region 6, top right, dark blue, § 5.2.3). The distinction between regions 4 and 5 stems from the stagnation of lateral growth observed for viscosity-dominated buoyant HFs under a constant release rate with finite toughness (Möri & Lecampion Reference Möri and Lecampion2022), and will be detailed later. We define in table 1 the sequence and respective limiting regimes visited for every region of the parametric space, with their estimated range of applicability as a function of the dimensionless numbers  $\mathcal {M}_{\hat {k}}$ and
 $\mathcal {B}_{ks}$. The scales of the buoyant finite-volume limiting regimes are listed in the Appendix. The characteristics of the propagation path of these different regions are described in the following sections.
The regions of figure 2 with their respective propagation history and the estimated limiting values of the dimensionless coefficients. The descriptions of the limiting regimes can be found in Savitski & Detournay (Reference Savitski and Detournay2002) for the M and K regimes, Möri & Lecampion (Reference Möri and Lecampion2021) for the M $^{[V]}$ and K
 $^{[V]}$ regimes, Möri & Lecampion (Reference Möri and Lecampion2022) for the
 $\hat {\text {M}}$ and
 $\hat {\text {K}}$ regimes, and this contribution for the
 $\hat {\text {M}}^{[V]}$ and
 $\hat {\text {K}}^{[V]}$ regimes (see the Appendix for a summary of the scalings).

4. Fractures arrested at depth $\mathcal {B}_{ks}<1$

Fractures that arrest at depth do not show self-sustained propagation in the buoyant direction. In the absence of any form of material or stress heterogeneities, and assuming an infinite impermeable elastic medium, a fracture will arrest only due to the release of an insufficient volume:  $\mathcal {B}_{ks}<1$. The lower part of figure 2 distinguishes two propagation histories for arresting fractures: a region where the fracture is toughness-dominated at the end of the release (region 1), and one where it is viscosity-dominated (region 2). As described in § 2.1, the characteristics of radially arresting fractures are independent of the propagation history. In the cases where
 $\mathcal {B}_{ks}\ll 1$, the fracture has an SIF
 $K_{I}$ along the entire fracture front equal to the fracture toughness
 $K_{Ic}$ (cf. figures 3d–f). In other words, as long as the final radius of the fracture
 $R_{a}$ (see 2.3) is small compared to the buoyancy length scale
 $\ell _{b}$ (Lister & Kerr Reference Lister and Kerr1991), the fracture arrests radially, and the findings obtained in the absence of buoyancy are valid (Möri & Lecampion Reference Möri and Lecampion2021).
For larger released volumes that are still insufficient for the start of self-sustained growth ( $\mathcal {B}_{ks}\lesssim 1$), fracture elongation occurs before it finally arrests. The fracture footprints of figures 3(a–c) indicate such elongated shapes as the dimensionless buoyancy approaches 1. In line with this, the SIF is smaller than the material toughness in the lower part of the fracture. The final elongation of the fracture is more pronounced for lower values of the dimensionless viscosity
 $\mathcal {M}_{\hat {k}}$. The continuous release case has shown that toughness- and viscosity-dominated transitions present a distinct evolution of their shape (Möri & Lecampion Reference Möri and Lecampion2022). Therefore, it is not surprising that the shapes of the arrested fractures differ as a function of the dimensionless viscosity if the released volume approaches the limiting one.
5. Self-sustained finite-volume buoyant fractures: $\mathcal {B}_{ks}>1$

5.1. Toughness-dominated, buoyant fractures at the end of the release (region 3): $\mathcal {M}_{k}\ll 1$

When the released volume is sufficient to create a buoyant HF ( $\mathcal {B}_{ks}>1$), a set of possible propagation histories exists as a function of the dimensionless viscosity
 $\mathcal {M}_{k}$. We first discuss toughness-dominated fractures, which, according to the arguments of §§ 2.1 and 3, must have a transition from radial to buoyant when the release is still ongoing. This results in a well-established, finger-like buoyant fracture with a constant-volume, toughness-dominated head at the end of the release. The head characteristics in the case of a continuous release were obtained from the assumption that
 $\ell ^{{head}}(t)\sim b^{{head}}(t)$ and elasticity, toughness and buoyant forces are dominating. If, additionally, we restrict these derivations by the finiteness of the total release volume, then the resulting length, opening and pressure scales remain unchanged (see (4.1) of Möri & Lecampion Reference Möri and Lecampion2021), but a time-dependent dimensionless viscosity emerges:
 \begin{equation} \mathcal{M}_{\hat{k}}^{[V]}\left(t\right)=\mu^{\prime}\, \frac{V_{o}E^{\prime3}\,{\rm \Delta}\gamma^{2/3}}{K_{Ic}^{14/3}t}=\mathcal{M}_{\hat{k}}\,\frac{t_{s}}{t}.\end{equation}
The decreasing nature of  $\mathcal {M}_{\hat {k}}^{[V]}$ with time indicates that the fracture head will necessarily become toughness-dominated at late time. Garagash & Germanovich (Reference Garagash and Germanovich2014) similarly derived the finite volume limit and concluded that the head and tail breadths do not change compared to the continuous release case. Their solution is thus equivalently representative of any finite-volume, buoyant HF with a finite toughness. We denote their result hereafter as the 3-D
 $\hat {K}^{[V]}$ GG (2014) solution. For cases in the intermediate range
 $\mathcal {M}_{\hat {k}}\in [10^{-2},10^{2}]$, we check how their head breadth approaches the 3-D
 $\hat {K}^{[V]}$ GG (2014) solution at late time (e.g.
 $b^{head}(t\to \infty )={\rm \pi} ^{-1/3}\ell _{b}$). We show in figure 4(a) the evolution of one toughness-dominated simulation with
 $\mathcal {M}_{\hat {k}}=10^{-2}$, and two fractures with an intermediate value
 $\mathcal {M}_{\hat {k}}=1$. The head breadth of the toughness-dominated fracture validates the limiting solution during the release (grey line in figure 4a) and shows no change after the release has ended. In contrast to this constant value of the head breadth, the simulations with an intermediate value of
 $\mathcal {M}_{\hat {k}}$ (green and red lines in figure 4a) have a maximum value exceeding the limiting breadth at the end of the release. Afterwards, the head breadth reduces gradually and approaches the limiting 3-D
 $\hat {K}^{[V]}$ GG (2014) solution. In the continuous release case, the limiting breadth is valid for
 $\mathcal {M}_{\hat {k}}\leq 10^{-2}$, so using (5.1), we can thus estimate the time for the fracture to reach the limit as
 $t(\mathcal {M}_{\hat {k}}^{[V]}(t)=10^{-2})=10^{2}\mathcal {M}_{\hat {k}}t_{s}$ (Möri & Lecampion Reference Möri and Lecampion2022). For
 $\mathcal {M}_{\hat {k}}\in [10^{-2},10^{2}]$, i.e. the simulations presented in figure 4, the 3-D
 $\hat {K}^{[V]}$ GG (2014) solution would be reached once
 $t\sim 100t_{s}$. From the rate with which the breadth approaches the 3-D
 $\hat {K}^{[V]}$ GG (2014) solution observed in figure 4(a), this estimate seems reasonable. In fact, the fracture with
 $\mathcal {M}_{\hat {k}}=1$ and
 $\mathcal {B}_{ks}=2$ is already within
 $15\,\%$ of the limiting solution at
 $t\sim 50t_{s}$.
Toughness-dominated self-sustained buoyant fractures. Evolution of the dimensionless (a) head breadth  $b^{head}(t)/\ell _{b}$ and (b) fracture length
 $\ell (t)/\ell (t=t_{s})$ as a function of the dimensionless shut-in time
 $t/t_{s}$. The green-dotted line corresponds to the limiting 3-D
 $\hat {K}$ GG (2014) solution (
 $b^{head}(t\to \infty )={\rm \pi} ^{-1/3}\ell _{b}$ in (a)), and the orange dashed line is the 3-D
 $\hat {K}^{[V]}$ GG (2014) solution. The inset of (b) shows the same quantity on the
 $y$-axis with a shifted
 $x$-axis (e.g.
 $(t-t_{s})/t_{s}$).

We derive the scaling of the viscosity-dominated tail of such a late-time solution using the assumption of a constant fracture breadth on the order of the breadth of the head  $b\sim \ell _{b}=K_{Ic}^{2/3}/{\rm \Delta} \gamma ^{2/3}$ as
 \begin{gather} \ell_{\hat{k}}^{[V]}(t)=\frac{V_{o}^{2/3}\, {\rm \Delta}\gamma^{7/9}\,t^{1/3}}{K_{Ic}^{4/9}\mu^{\prime1/3}},\quad b_{\hat{k}}^{[V]}=\frac{K_{Ic}^{2/3}}{{\rm \Delta}\gamma^{2/3}}\equiv\ell_{b}, \end{gather}
 \begin{gather}w_{\hat{k}}^{[V]}(t)=\frac{V_{o}^{1/3}\mu^{\prime1/3}}{K_{Ic}^{2/9}\, {\rm \Delta}\gamma^{1/9}\,t^{1/3}},\quad p_{\hat{k}}^{[V]}(t)=E^{\prime}\, \frac{{\rm \Delta}\gamma^{5/9}\,V_{o}^{1/3}\mu^{\prime1/3}}{t^{1/3}K_{Ic}^{8/9}}, \end{gather}
where we use  $\hat {{\cdot }}$ to refer to a buoyant scaling. These scales are obtained from the continuous release scales by replacing
 $Q_{o}$ with
 $V_{o}/t$, and reveal a sub-linear growth of the fracture height according to a power law of the form
 $\ell (t)\sim t^{1/3}$. Note that these scales have been obtained by Garagash & Germanovich (Reference Garagash and Germanovich2014) when deriving their 3-D
 $\hat {K}^{[V]}$ GG (2014) solution. We present in figure 4(b) the evolution of dimensionless fracture length
 $\ell (t)/\ell (t=t_{s})$ as a function of the dimensionless time
 $t/t_{s}$. The green line with a
 $1\,:\,1$ slope indicates the scaling-derived temporal power law for a toughness-dominated buoyant HF under a continuous fluid release. The two simulations with low
 $\mathcal {B}_{ks}$ (grey and red) cannot reach this intermediate regime, as they are not propagating long enough in this
 $\hat {K}$ regime (see the discussion in § 4.4 of Möri & Lecampion Reference Möri and Lecampion2022). The simulation with
 $\mathcal {B}_{ks}=4$ reaches this limit for about one order of magnitude in time before decelerating towards the late-time power law predicted by the scaling of (5.2a,b). A similar deceleration is observed for the other two simulations without any of the simulations reaching the limiting
 $\ell (t)\sim t^{1/3}$ power law. The orange dashed line indicates the 3-D
 $\hat {K}^{[V]}$ GG (2014) solution for fracture length, which we would expect to be valid at late times. The inset of figure 4(b) sets the time when the release ends as zero according to the hypothesis of Garagash & Germanovich (Reference Garagash and Germanovich2014). This correction of the data highlights the tendency of the fracture length of all simulations to approach the limiting solution. A late-time validation of the solution can be expected as the relative difference between the predicted length and the simulation with
 $\mathcal {B}_{ks}=2$ and
 $\mathcal {M}_{\hat {k}}=1$ at the end of the simulation is only of the order of
 $23\,\%$. These findings indicate that buoyant fractures with a finite toughness will have a late-time behaviour akin to the 3-D
 $\hat {K}^{[V]}$ GG (2014) solution. Even though this late-time behaviour will be consistent, it also shows that the exact shape of the fracture will depend on both parameters,
 $\mathcal {M}_{\hat {k}}$ and
 $\mathcal {B}_{ks}$. Only the breadth close to the head, the head itself, and the growth rate will be equivalent to the 3-D
 $\hat {K}^{[V]}$ GG (2014) solution. To get an idea of the overall fracture shape, we define a shape parameter called the overrun as
 \begin{equation} O=\frac{\underset{z,t}{\text{max}}\left\{ b(z,t)\right\} -{\rm \pi}^{{-}1/3}\ell_{b}}{{\rm \pi}^{{-}1/3}\ell_{b}}, \end{equation}
sketched in figure 5. This parameter defines how much the maximum lateral extent exceeds the late-time head breadth  ${\rm \pi} ^{-1/3}\ell _{b}$. Here,
 $O$ has lower bound
 $0$, reached for fully toughness-dominated fractures with
 $\mathcal {M}_{\hat {k}}\leq 10^{-2}$. This limit is validated by the simulation reported in this section with
 $\mathcal {M}_{\hat {k}}=10^{-2}$ and
 $\mathcal {B}_{ks}=1.25$, which effectively has overrun
 $0$ (see figure 5). For the fractures in between the toughness- and viscosity-dominated limits of the continuous release with a uniform breadth (e.g.
 $\mathcal {M}_{\hat {k}}\in [10^{-2},10^{2}]$), the overrun cannot be predicted by scaling laws. From the observation of figure 8 of Möri & Lecampion (Reference Möri and Lecampion2022), we can, however, derive that it will increase with increasing values of
 $\mathcal {M}_{\hat {k}}$. The overruns of the two other simulations reported here are, respectively,
 $0.88$ (
 $\mathcal {M}_{\hat {k}}=1$ and
 $\mathcal {B}_{ks}=4$), and
 $0.80$ (
 $\mathcal {M}_{\hat {k}}=1$ and
 $\mathcal {B}_{ks}=2$). We display the overrun value for simulations that lead to a buoyant HF in figure 2. Within the region of the toughness-dominated fractures with a buoyant end of the release (region 1), the values are effectively
 $0$. The overrun increases with the value of
 $\mathcal {M}_{\hat {k}}$ towards the viscosity-dominated domain (regions 4–6), and will be estimated using scaling arguments later (figure 5 sketches the concept for a fracture of region 5).
Illustration of the definition of the overrun (5.4). Left: example of a zero overrun (as obtained for toughness-dominated buoyant fractures at the end of the release – region 3). Right: example of an overrun with the maximum breadth larger than the limiting breadth of the 3-D  $\hat {K}^{[V]}$ GG (2014) solution (Garagash & Germanovich Reference Garagash and Germanovich2014, Reference Garagash and Germanovich2022).

5.1.1. Numerical limitations
The fact that no simulations propagating for longer times, which would ultimately exhibit the 3-D  $\hat {K}^{[V]}$ GG (2014) solution, are reported deserves discussion. These simulations have multiple numerical challenges, such as their overall computational cost and the numerical treatment of closing cells at the bottom of the fracture, among others. We illustrate the computational cost by the example of a toughness-dominated buoyant HF. Such fractures accelerate around the transition from radial to buoyant before slowing down to the ultimately constant velocity. Möri & Lecampion (Reference Möri and Lecampion2022) report that for their simulations, the acceleration terminates at a dimensionless time
 $t/t_{k\hat {k}}\approx 3$, where
 $t_{k\hat {k}}$ is the transition time from radial to buoyant (see (3.6) of Möri & Lecampion Reference Möri and Lecampion2022). Inspection of figure 4(b) shows that after the end of the release, additional time is required to transition to the late-time buoyant pulse solution. This figure gives an estimate of the time to reach the 3-D
 $\hat {K}^{[V]}$ GG (2014) solution for
 $t\sim 100t_{s}$. An estimate of the fracture extent for a simulation with
 $\mathcal {M}_{\hat {k}}=10^{-2}$ at this time, based on growth according to the power law of (5.2a,b), gives
 $\ell \sim 1600\ell _{b}$. The computational cost can now be estimated by taking a discretization of approximately
 $44$ elements per
 $\ell _{b}$ (see § 4.2 of Möri & Lecampion Reference Möri and Lecampion2022) and an approximation of the constant breadth
 $b(t)\approx {\rm \pi}^{-1/3}\ell _{b}$, yielding about
 $2\times 10^{6}$ elements in the fracture. Our current implementation of PyFrac (Zia & Lecampion Reference Zia and Lecampion2020) can handle buoyant simulations covering up to
 $20$ orders of magnitude in time and up to
 $15$ orders of magnitude in space within about
 $4$ weeks of computation time on a multithreaded Linux desktop system with 12 Intel®Core i7-8700 CPUs, using at most 30 GB of RAM, and discretization of up to
 $2\times 10^{5}$ elements within the fracture footprint. It is worth noting that the simulation with
 $\mathcal {M}_{\hat {k}} = 1$ tends towards the predicted
 $\ell (t) \propto t^{1/3}$ propagation with a significant offset. This difference is related to the inherent assumption of (5.2a,b) that the total released volume is significantly larger than the volume of the head
 $(V^{head} \gg V_o)$. The difference can thus be related to the ratio of the two volumes or equivalently to
 $\mathcal {B}_{ks}$ (see (3.1)). We show in the supplementary material available at https://doi.org/10.1017/jfm.2023.711 (§ 1.2) that reaching the solution to within
 $5\,\%$ is only possible if
 $\mathcal {B}_{ks} \geq 12$. For all simulations presented in figure 4, the fracture height could get within only
 ${\sim }17\,\%$ (for
 $\mathcal {B}_{ks} = 4$) of (5.2a,b). Reaching the exact solution efficiently would require a toughness-dominated fracture
 $\mathcal {M}_{\hat {k}}\leq 10^{-2}$ with
 $\mathcal {B}_{ks} \geq 12$, which becomes even more challenging than the calculations presented previously.
An additional issue presents closing cells at the bottom of the fracture. As the opening reduces continuously (see  $w_{\hat {k}}^{[V]}$ in (5.2a,b)), and we do not allow for complete fracture healing, a minimum width activates (Zia & Lecampion Reference Zia and Lecampion2020; the minimum width is considered fluid-filled, and we continue solving the width-averaged lubrication approximation for these cells). In the context of HFs in rocks, such a minimum aperture relates to the roughness of the fracture. With the current system of closed, fluid-filled cells, two effects arise. First, elastic contact stress changes the stress distribution. Second, some fluid volume gets trapped, reducing that available for fracture propagation. Both effects slow down propagation and ultimately arrest the fracture (Pezzulli Reference Pezzulli2022). They further increase the nonlinearity of the system, such that convergence is challenging, leading to a breakdown of the simulation at late time
 $t \gg t_{s}$. A possible remedy would be to remove these closed cells from the fracture domain, and re-allocate the fluid that they contain.
5.2. Viscosity-dominated at the end of the release (regions 4–6): $\mathcal {M}_{k}\gg 1$

The difference between a buoyant or radial end of the release has been shown to depend on the dimensionless viscosity at the end of the release  $\mathcal {B}_{ms}$ (see (3.2), § 3.2). An additional separation between two possible cases of buoyant fractures at the end of the release is required to evaluate accurately the emerging shape. Möri & Lecampion (Reference Möri and Lecampion2022) have shown that whenever a finite fracture toughness is present (e.g.
 $K_{Ic}\neq 0$), lateral growth stabilizes within a finite time at
 $\underset {z,t}{\text {max}}\{ b(z,t)\} \propto \mathcal {M}_{\hat {k}}^{2/5}\ell _{b}$. The time of stabilization is related to a dimensionless lateral toughness
 $\mathcal {K}_{\hat {m},x}(t)$ (see their (6.1)), which we can evaluate at the end of the release:
 \begin{equation} \mathcal{K}_{\hat{m}s,x}=\mathcal{K}_{\hat{m},x}(t=t_{s})=K_{Ic}\, \frac{{\rm \Delta}\gamma^{1/8}\,t_{s}^{1/3}}{E^{\prime19/24}V_{o}^{1/8} \mu^{\prime1/3}}=\mathcal{M}_{\hat{k}}^{1/3}\mathcal{B}_{ks}^{25/72}.\end{equation}
A value  $\mathcal {K}_{\hat {m}s,x}\geq 1$ indicates that lateral growth has ceased, whereas a value below 1 means that the fracture is still growing laterally as
 $b\sim t^{1/4}$ (see (5.4) of Möri & Lecampion Reference Möri and Lecampion2022).
5.2.1. Viscosity-dominated, buoyant fracture at the end of the release without laterally stabilized breadth (region 5): $\mathcal {B}_{ms}\geq 1$ and $\mathcal {K}_{\hat {m}s,x}\ll 1$


First, we consider the case of zero-fracturing toughness by developing a tail scaling. The principal hypotheses are buoyant forces, elasticity and viscous energy dissipation at first order, and an aspect ratio scaling like the respective lateral and horizontal fluid velocities ( $\ell (t)/b(t)\sim v_{z}(t)/v_{x}(t)$):
 \begin{equation} \left.\begin{gathered} \ell_{\hat{m}}^{[V]}=\frac{V_{o}^{1/2}\,{\rm \Delta}\gamma^{1/2}\,t^{1/3}}{E^{\prime1/6} \mu^{\prime1/3}},\quad b_{\hat{m}}^{[V]}=\frac{E^{\prime1/4}V_{o}^{1/4}}{{\rm \Delta}\gamma^{1/4}},\\ w_{\hat{m}}^{[V]}=\frac{V_{o}^{1/4}\mu^{\prime1/3}}{E^{\prime1/12}\, {\rm \Delta}\gamma^{1/4}\,t^{1/3}},\quad p_{\hat{m}}^{[V]}= \frac{E^{\prime2/3}\mu^{\prime1/3}}{t^{1/3}}. \end{gathered}\right\} \end{equation}
Note that Davis et al. (Reference Davis, Rivalta, Smittarello and Katz2023) presented the same scaling for fracture length. The finite volume inherently prevents the infinite lateral growth observed for a continuous release, and  $b_{\hat {m}}^{[V]}$ is time-independent. Figure 6(b) shows limited lateral growth for all simulations. It is interesting to note that the scaling predicts a fracture length evolution with a
 $\ell \sim t^{1/3}$ power law, equivalent to the height evolution in the toughness-dominated case. Figure 6(a) shows this evolution for various viscosity-dominated simulations. When
 $\mathcal {M}_{\hat {k}}$ is sufficiently large and
 $\mathcal {K}_{\hat {m}s}\ll 1$ (in other words, when the fracture is sufficiently far from lateral stabilization), the
 $1\,:\,3$ slope predicted by the scaling (5.6) emerges. However, the height growth quickly departs from the
 $t^{1/3}$ power law. The reason is the time-dependent inflow rate of the head (derived from the scaling (5.6)):
 \begin{equation} \left.\begin{gathered} \ell_{\hat{m}}^{head,[V]}=b_{\hat{m}}^{head,[V]}= \frac{E^{\prime11/24}V_{o}^{1/8}\mu^{\prime1/6}}{{\rm \Delta}\gamma^{5/8}\,t^{1/6}},\quad w_{\hat{m}}^{head,[V]}=\frac{V_{o}^{1/4}\mu^{\prime1/3}}{E^{\prime1/12}\, {\rm \Delta}\gamma^{1/4}\,t^{1/3}},\\ p_{\hat{m}}^{head,[V]}=\frac{E^{\prime11/24}V_{o}^{1/8} \mu^{\prime1/6}\,{\rm \Delta}\gamma^{3/8}}{t^{1/6}},\quad V_{\hat{m}}^{head,[V]}= \frac{E^{\prime5/6}V_{o}^{1/2}\mu^{\prime2/3}}{{\rm \Delta}\gamma^{3/2}\,t^{2/3}}, \end{gathered}\right\} \end{equation}
revealing a shrinking viscous head.
Evolution of (a) fracture length  $\ell (t)/\ell (t=t_{s})$ and (b) head breadth
 $b^{head}(t)/\ell _{b}$ for viscosity-dominated buoyant non-stabilized fractures at the end of the release as a function of the dimensionless shut-in time
 $t/t_{s}$:
 $\mathcal {M}_{\hat {k}}\gg 1$,
 $\mathcal {B}_{ks}\geq 1$,
 $\mathcal {K}_{\hat {m}x,s}<1$. Dash-dotted lines with colours identical to simulations (continuous lines) in (a) show the corresponding late-time, 3-D
 $\hat {K}^{[V]}$ GG (2014) solution; the blue dashed line shows the continuous-release buoyant scaling
 $\ell (t)/\ell (t=t_{s})\sim t^{5/6}$; the blue dash-dotted line shows a numerical zero-toughness fit
 $\ell (t)/\ell (t=t_{s})\approx 1.62(t/t_{s})^{0.33}$ (matching the
 $\hat {M}^{[V]}$ scaling). The green dashed line in (b) indicates the late-time limit of the 3-D
 $\hat {K}$ GG (2014) solution for the corresponding simulation. The blue dashed line indicates the scaling dependence in the
 $\hat {M}^{[V]}$ scaling
 $b^{head}(t)\sim t^{-1/6}$. Note that the two zero-toughness simulations differ by their value of
 $\mathcal {B}_{ms}$ (
 $100$ for the dark red simulation and
 $25$ for the light red simulation).

Considering now a finite fracture toughness, a dimensionless toughness can be obtained in the head:
 \begin{align} \mathcal{K}_{\hat{m}}^{[V]}(t)=K_{Ic}\,\frac{t^{1/4}}{E^{\prime11/16}V_{o}^{3/16}\, {\rm \Delta}\gamma^{1/16}\,\mu^{\prime1/4}}=\mathcal{B}_{ks}^{5/48}\mathcal{M}_{\hat{k}}^{[V]} (t)^{{-}1/4}=\mathcal{B}_{ks}^{5/48}\mathcal{M}_{\hat{k}}^{{-}1/4} \left(\frac{t}{t_{s}}\right)^{1/4}.\end{align}
Equation (5.8) indicates that the head will become toughness-dominated at late times as  $\mathcal {K}_{\hat {m}}^{[V]}(t)$ increases with time. From this observation, we anticipate that the region close to the propagating head will ultimately follow the 3-D
 $\hat {K}^{[V]}$ GG (2014) head solution (see § 5.1.1) and derive the characteristic time scale of the transition
 \begin{equation} t_{\hat{m}\hat{k}}^{[V]}=\frac{E^{\prime11/4}V_{o}^{3/4}\,{\rm \Delta}\gamma^{1/4}\,\mu^{\prime}}{K_{Ic}^{4}}.\end{equation}
Evaluating the viscosity-dominated head scaling (see (5.7)) at this characteristic time gives the scales of the toughness-dominated head (see (5.2a,b)). This observation implies that even though the shape further away from the head varies, the length scale  $\ell (t)_{\hat {k}}^{[V]}$ becomes applicable. Relating the two length scales of buoyant fractures from a finite volume release,
 \begin{equation} \ell{}_{\hat{k}}^{[V]}(t)= \mathcal{B}_{ks}^{5/18}\ell{}_{\hat{m}}^{[V]}(t),\end{equation}
shows that  $\ell {}_{\hat {k}}^{[V]}(t)\geq \ell {}_{\hat {m}}^{[V]}(t)$ for a buoyant fracture (as
 $\mathcal {B}_{ks}\geq 1$). The observation of figure 6(a) shows the fracture deviation from the lower, viscosity-dominated solution towards the upper, toughness-dominated solution (shown by dash-dotted lines for two simulations). The observed faster growth in height originates in the narrowing of the tail, creating a lateral inflow from the stagnant parts of the fracture into a central tube of the fixed breadth predicted by the 3-D
 $\hat {K}^{[V]}$ GG (2014) solution. We do not present a simulation that finishes the transition to the toughness-dominated regime due to its high computational cost (see the discussion in § 5.1.1).
In (5.4), we have introduced the overrun as a characteristic of the fracture shape. In the case of viscous fractures with a buoyancy-dominated, laterally non-stabilized end of the release, such overrun can be estimated from the viscous scaling as
 \begin{equation} O_{\hat{m}}=\frac{b_{\hat{m}}^{[V]}-{\rm \pi}^{{-}1/3}\ell_{b}}{{\rm \pi}^{{-}1/3}\ell_{b}}= {\rm \pi}^{1/3}\,\frac{E^{\prime1/4}V_{o}^{1/4}\,{\rm \Delta}\gamma^{5/12}}{K_{Ic}^{2/3}}-1={\rm \pi}^{1/3} \mathcal{B}_{ks}^{5/12}-1.\end{equation}
The increase of the overrun with the value of the dimensionless buoyancy  $\mathcal {B}_{ks}$ is observable in figure 2.
5.2.2. Viscosity-dominated, buoyant fracture at the end of the release with laterally stabilized breadth (region 4): $\mathcal {B}_{ms}\geq 1$ and $\mathcal {K}_{\hat {m}s,x}\geq 1$


Lateral stabilization of buoyant, viscosity-dominated fractures occurs when the volume of the fracture head becomes constant, leading to two fixed points, the laterally stabilized breadth with  $\underset {z,t}{\textrm {max}}\{ b(z,t)\} \sim \mathcal {M}_{\hat {k}}^{2/5}\ell _{b}$, and the constant-volume, constant-breadth head. The section of extending fracture breadth in between the two conserves its shape, creating a fracture where elongation concentrates within the zone of laterally stabilized breadth. From this observation, one can draw an analogy to a toughness-dominated buoyant fracture (see § 5.1). The scales of this equivalent toughness-dominated fracture are related through a factor
 $\mathcal {M}_{\hat {k}}^{2/5}$, such that the behaviour after the end of the release will be the same as presented in § 5.1, differing only by the starting point (
 $\mathcal {M}_{\hat {k}}^{2/5}$ instead of
 $\mathcal {M}_{\hat {k}}$).
Because the processes after the end of the release do not differ from toughness-dominated fractures, we omit a detailed discussion of this case hereafter and only list the difference in the shape parameter:
 \begin{equation} O_{\hat{m}}^{stab}=\frac{\mathcal{M}_{\hat{k}}^{2/5}\ell_{b}-{\rm \pi}^{{-}1/3}\ell_{b}}{{\rm \pi}^{{-}1/3} \ell_{b}}={\rm \pi}^{1/3}\mathcal{M}_{\hat{k}}^{2/5}-1.\end{equation}
The overrun in the non-stabilized case of viscosity-dominated fractures depends solely on the dimensionless buoyancy  $\mathcal {B}_{ks}$ and, as such, on the total released volume and elastic parameters. In contrast, the governing parameter of the stabilized case is the dimensionless viscosity
 $\mathcal {M}_{\hat {k}}$, and the history of the release (how the total volume gets accumulated) governs the overrun of the fracture.
5.2.3. Viscosity-dominated fracture with negligible buoyancy at the end of the release (region 6): $\mathcal {B}_{ms}\ll 1$

This type of fracture becomes buoyant in the pulse propagation phase as long as its dimensionless buoyancy  $\mathcal {B}_{ks}$ (see (3.1)) is larger than 1. This transition from radial to buoyant propagation is characterized by the dimensionless buoyancy of the viscous pulse
 $M^{[V]}$ scaling
 $\mathcal {B}_{m}^{[V]}(t)$ (see (3.5)) and has a characteristic transition time
 \begin{equation} t_{m\hat{m}}^{[V]}=\frac{E^{\prime5/4}\mu^{\prime}}{V_{o}^{3/4}\, {\rm \Delta}\gamma^{9/4}}=\mathcal{B}_{ks}^{{-}5/2}t_{\hat{m}\hat{k}}^{[V]}.\end{equation}
The corresponding transition length scale is equivalent to the constant breadth of a buoyant viscosity-dominated fracture  $\ell _{m}^{[V]}(t=t_{m\hat {m}}^{[V]})=\ell _{m\hat {m}}^{[V]}=b_{\hat {m}}^{[V]}$, indicating that the maximum breadth is reached at the transition. Figure 7(d) shows that for an increasing dimensionless buoyancy
 $\mathcal {B}_{ks}$ (see (3.1)), the growth of the maximal breadth continues (solid lines) after transition but remains within the order of magnitude predicted by the scaling (5.6). Lateral growth ultimately tapers off at approximately
 $3\ell _{m\hat {m}}^{[V]}$ at
 $t\approx 10^{3}t_{m\hat {m}}^{[V]}$. The expected overrun becomes equivalent to the case of a non-stabilized, buoyant viscosity-dominated end of the release (see (5.11)).
Viscosity-dominated fractures with negligible buoyancy at the end of the release:  $\mathcal {B}_{ks}\geq 1$ and
 $\mathcal {B}_{ms}\ll 1$. (a) Opening along the centreline
 $w(0,z,t)/w_{m\hat {m}}^{[V]}$ for
 $\mathcal {M}_{\hat {k}}=\infty$,
 $\mathcal {B}_{ks}=\infty$ and
 $\mathcal {B}_{ms}=10^{-3}$ (zero-toughness case). (b) Net pressure along the centreline
 $p(0,z,t)/p_{m\hat {m}}^{[V]}$ for the same case as in (a). (c) Fracture length
 $\ell (t)/\ell _{m\hat {m}}^{[V]}$ for large viscosity
 $\mathcal {M}_{\hat {k}}\in [5.1\times 10^{5},\infty ]$ simulations. The blue dashed line is a fit of the zero-toughness simulation
 $\ell (t)\propto t^{0.33}$. (d) Fracture breadth
 $b(t)/\ell _{m\hat {m}}^{[V]}$ (solid lines) and head breadth
 $b^{head}(t)/\ell _{m\hat {m}}^{[V]}$ (dashed lines) for the same simulations. Purple dashed lines indicate the
 $M^{[V]}$ solution (Möri & Lecampion Reference Möri and Lecampion2021); orange dashed lines indicate the 3-D
 $\hat {K}^{[V]}$ GG (2014) solution for the highest value of
 $\mathcal {B}_{ks}$. (e–i) Evolution of the fracture footprint from radial (e) towards the late-time shape (h,i) for the zero-toughness simulation. For the definition of the transition scales
 ${\cdot }_{m\hat {m}}^{[V]}$, see table 4.

The scaling for these fractures is given by (5.6) and (5.7). Despite the distinct propagation histories, the late-time fracture footprint does not vary significantly (see figure 8). Similar to the case of a constant release, the fracture first becomes somewhat elliptical, with a peak in pressure and opening appearing in the fracture head. Propagation then deviates to the buoyant direction with a continuously shrinking head, and no saddle point develops between the maximum lateral extent and the head. In the case of finite fracture toughness, an inflexion point forms in this area, such that the evolution of the breadth towards the head becomes convex at the transition time  $t_{\hat {m}\hat {k}}^{[V]}$ (see (5.9)). Note that the bottom ends of the fractures in figures 7(h,i) seem to be of uniform opening. This uniform opening results directly from activating the minimum width of the numerical scheme.
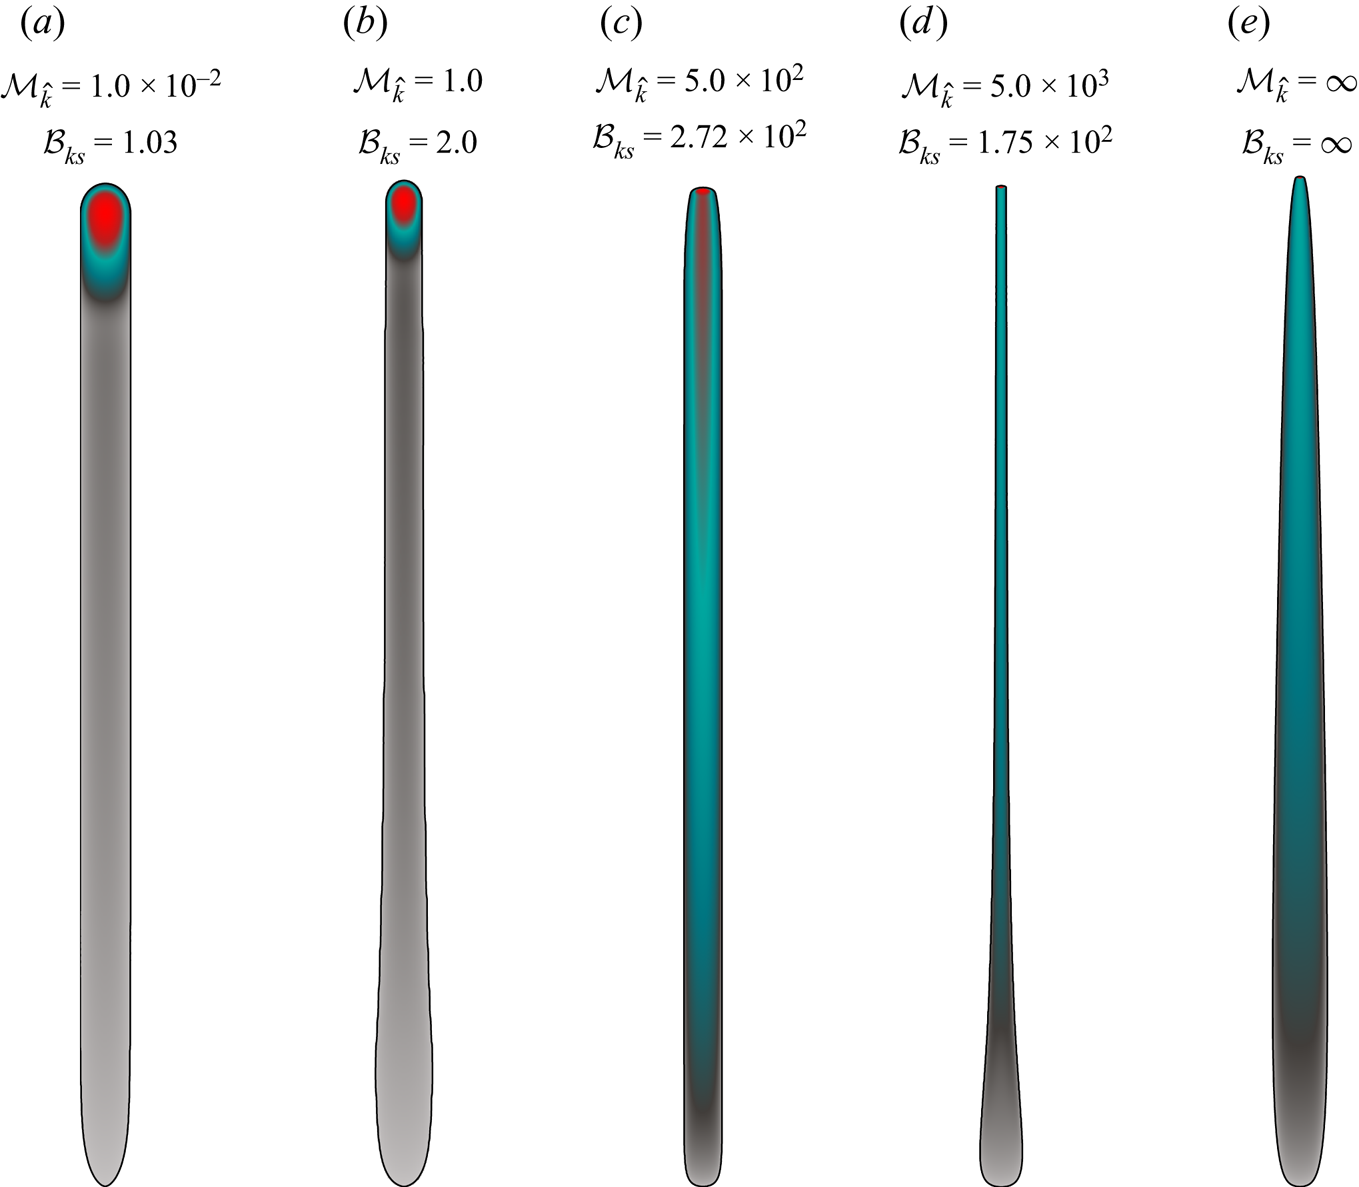
Phenotypes of possible buoyant HFs of finite volume emerging from a point source  $(\mathcal {B}_{ks}\geq 1)$. (a) Toughness-dominated finger-like fracture (region 3 in figure 1). (b) Intermediate fracture with a stable breadth and negligible overrun. (c) Viscosity-dominated buoyant end of the release with stabilized breadth (region 4 in figure 1). (d) Viscosity-dominated buoyant end of the release without stabilized breadth (region 5 in figure 1). (e) Zero-toughness case with a buoyant end of the release
 $(\mathcal {B}_{ms}=10^{2})$. Here, (a,b) are scaled by
 $\ell _{b}$ (Lister & Kerr Reference Lister and Kerr1991), and (c–e) by
 $\ell _{m\hat {m}}^{[V]}$ (see table 4).
When observing the evolution of the fracture length and head breadth, one observes that the simulations approach the 3-D  $\hat {K}^{[V]}$ GG (2014) solution for cases with finite toughness. The breadth and length evolution of the 3-D
 $\hat {K}^{[V]}$ GG (2014) solution in the viscous buoyant scaling (see (5.6) and (5.7)) depends on the value of
 $\mathcal {B}_{ks}$ such that we indicate only one of the possible late-time solutions. We pick the one that is most likely to be reached, corresponding to the smallest value of
 $\mathcal {B}_{ks}$ for the length and the largest for the breadth with dashed orange lines. The tendency towards those solutions is visible. Reaching them exactly is, however, associated with too high computational costs (see the discussion in § 5.1.1). The evolution of fracture opening and net pressure is plotted along the centreline (e.g.
 $x=0$) in figures 7(a,b). The head is identified once it departs from the source before it subsequently shrinks. This shrinking makes the head volume negligible compared to the overall fluid volume after sufficient buoyant propagation. When this moment is reached, the fracture propagates in the viscosity-dominated regime (see also the nearly self-similar footprint reported in the supplementary material). The supplementary material shows that the opening along the centreline approaches the 2-D solution of Roper & Lister (Reference Roper and Lister2005). An approximated solution may be possible when combining the zero toughness head (cf. figure 7 of Möri & Lecampion Reference Möri and Lecampion2022) with the tail solution of Roper & Lister (Reference Roper and Lister2007) (see their (6.7)), but this is left for further study.
5.3. Late-time fracture shapes
The governing mechanisms delimiting the different regions of the parametric space of figure 2 give rise to different phenotypes of fracture shape. Figure 8 displays the late-time shapes of buoyant fractures in different regions (3–5) of the parametric space. Figure 8(a) shows the characteristic shape of a toughness-dominated buoyant fracture at the end of the release (region 3). The footprint is finger-like with a constant breadth and head volume. Already early in the propagation, the bulk of the released volume is located in the head (indicated by the colour code). Except in the source region and for the expanding head, no change in breadth is observed, and the overrun  $O$ (see (5.4)) is zero. For fractures with a uniform breadth, not validating the toughness solution (e.g.
 $\mathcal {M}_{\hat {k}}\in [10^{-2},10^{2}]$ and
 $\mathcal {B}_{ks}\geq 1$, between regions 3 and 4), the bulk of the fluid volume is similarly in the head. One difference is the change in breadth observed close to the source region related to the end of the release, giving rise to a small, non-zero overrun. When the fractures are more viscosity-dominated (see figures 8c–e), the overrun becomes more pronounced, and the opening distribution is more homogeneous along the fracture length. For example, figure 8(c) shows a viscosity-dominated, buoyant fracture with a stabilized breadth at the end of the release (region 4) with a barely visible head (light red area at the propagating edge). The red-coloured part extending long into the tail shows that the tail opening is much closer to the head opening than in the toughness-dominated cases of figures 8(a,b). The particularity of this phenotype is its uniform breadth over a finite height due to lateral stabilization (associated with a finite fracture toughness value). Figure 8(d) (region 5) emphasizes the approach to the late-time 3-D
 $K^{[V]}$ GG (2014) solution of viscosity-dominated fractures by the thinning of the breadth along the fracture length towards its head. The head breadth of this simulation still exceeds the limiting solution by a factor of about
 $4.7$, and the opening distribution along the fracture is still too homogeneous. In other words, a significant proportion of the volume remains in the tail (compare the grey colour in figure 8(a) with the green colour in figure 8(d)). The last phenotype, in figure 8(e), represents the case of a zero-toughness simulation with a buoyant end of the release. Comparing this shape to the zero-toughness simulation with negligible buoyancy at the end of the release (cf. figures 7h,i) reveals no significant difference. All zero-toughness simulations, independent of the state at the end of the release, will show this particular shape. Only if a finite fracture toughness is present will the fracture tend to the late-time 3-D
 $K^{[V]}$ GG (2014) solution, and the shape will resemble figure 8(d) (see also figure 1(b) of Davis et al. Reference Davis, Rivalta, Smittarello and Katz2023).
6. Discussion
6.1. Implications for industrial treatments
We consider a single stage of a multistage fracturing treatment in a horizontal well, taking the fluid properties as the ones of slickwater (Economides & Nolte Reference Economides and Nolte2000; Lecampion & Zia Reference Lecampion and Zia2019) with density  $\rho _f \approx 1000$ kg m
 $^{-3}$ and viscosity
 $\mu \approx 0.005$ Pa s. We consider a relatively compliant rock with Young's modulus
 $E \approx 10$ GPa, Poisson's ratio
 $\nu \approx 0.1$, density of
 $\rho _s \approx 2300$ kg m
 $^{-3}$, and fracture toughness
 $K_{Ic} \approx 2$ MPa m
 $^{1/2}$. Assuming that the reservoir and fracturing fluids have similar densities (
 $\rho _F \approx \rho _f$), the effective density contrast (2.8) becomes
 ${\rm \Delta} \gamma = \alpha (\rho _s-\rho _f) g$. Typical injection rates are of the order of
 $Q_o \approx 0.1$–0.3 m
 $^3$ s
 $^{-1}$, with total fluid volume
 $V_o \approx 1500$–5700 m
 $^3$. With this set of material, fluid and injection parameters, the critical volume for buoyant propagation as a function of the lateral Earth pressure coefficient
 $\alpha$ reads
 $V_{lim}(\alpha ) \approx 0.90 \alpha ^{-5/3}$ (see (2.12)). For the fluid release with the smallest volume
 $V_o \approx 1500$ m
 $^3$ to become buoyant, the lateral Earth pressure coefficient must exceed
 $\alpha \gtrsim 0.012$. When using a lateral Earth pressure coefficient at rest
 $\alpha = \nu / (1-\nu ) = 0.11$, the fracture becomes buoyant with dimensionless buoyancy
 $\mathcal {B}_{ks} \approx 9.51$ (3.1). It is necessary to reduce the horizontal stress gradient by about 90 % (through tectonic relaxation or other processes) to prevent buoyant propagation under these conditions. Note that the corresponding dimensionless viscosity is of the order of
 $\mathcal {M}_{\hat {k}} \approx 0.60$–10.0 (see (2.10)) for the release rates considered. The emerging buoyant fractures are thus situated somewhere in between the toughness-dominated region 3 (§ 5.1), and the viscosity-dominated regions 4 and 5 (§§ 5.2.2 and 5.2.1).
6.2. Comparison with experiments
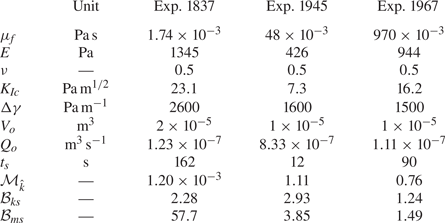
We compare recent laboratory experiments with our scalings and numerical simulations. We use three sets of parameters from experiments performed by Smittarello (Reference Smittarello2019) and reported in Davis et al. (Reference Davis, Rivalta, Smittarello and Katz2023) (see table 2). Table 2 lists the resulting dimensionless parameters. These fractures appear to be toughness-dominated (experiment 1837) or in the transition with a uniform breadth (experiments 1945 and 1967). We report the evolution of fracture height with time in figure 9 (data from the experiments of figure 5(a) of Davis et al. Reference Davis, Rivalta, Smittarello and Katz2023). Along with the three experiments, we show our simulation closest to experiments 1945 and 1967 as well as the limiting solutions derived by Garagash & Germanovich (Reference Garagash and Germanovich2014). The toughness-dominated experiment (experiment 1837) displays a linear fracture height growth with time, expected from the continuous release scaling. Surprisingly, the end of the release does not lead to a significant reduction in height growth (cf. the simulation with  $\mathcal {M}_{\hat {k}}=10^{-2}$ in figure 4b), which continues linearly until it reaches the top of the tank (end of the data stream). We expect this to be related to free-surface effects attracting the fracture, a hypothesis supported by observations of the other two experiments. The fractures of the other experiments grow without showing any scaling-based power laws. This behaviour is typical for many laboratory experiments, which unfortunately appear to be ‘in between’ limiting regimes. Additionally, the extent of the HFs created often suffers from detrimental effects associated with the finite size of the sample, making any comparison with theoretical and numerical predictions difficult.
Material parameters and the released volume  $V_{o}$ are taken from table 3 of Davis et al. (Reference Davis, Rivalta, Smittarello and Katz2023) (based on the work of Smittarello Reference Smittarello2019). We extract the shut-in time from figure 5(a) of Davis et al. (Reference Davis, Rivalta, Smittarello and Katz2023) and calculate the release rate as
 $Q_{o}=V_{o}/t_{s}$.
Fracture height evolution as a function of dimensionless time for the experiments listed in table 2. Data extracted from figure 5(a) of Davis et al. (Reference Davis, Rivalta, Smittarello and Katz2023) based on experiments reported in Smittarello (Reference Smittarello2019). The black line shows a simulation with dimensionless numbers similar to experiments 1945 and 1967. Purple dots mark the moment when the fracture becomes toughness-dominated (e.g.  $t=t_{mk}$), and dashed lines indicate the limiting solutions derived by Garagash & Germanovich (Reference Garagash and Germanovich2014): green for a continuous release, orange for the release of a finite volume.

The fact that the release rate in laboratory experiments is often not constant presents an additional inconvenience. Indeed, at early time, the interplay between compressibility of the injection line and fracture initiation leads to a non-constant entering flux (Lecampion et al. Reference Lecampion, Desroches, Jeffrey and Bunger2017). In addition, for many experiments related to buoyancy, the fluid is injected manually using a syringe, which is likely the case here. Especially in viscosity-dominated fracture propagation regimes, this has a significant influence on fracture growth via  $\mathcal {M}_{\hat {k}}$. Another possible effect is given by the ‘oriented’ fluid release with a syringe from the bottom of the tank rather than perpendicular to the fracturing plane. Such a difference notably influences the early propagation phase, which should be radial and reproduced accurately (note that PyFrac has been shown to reproduce laboratory experiments of initially radial HFs with success; Zia & Lecampion Reference Zia and Lecampion2019; Peruzzo Reference Peruzzo2023).
The complete parametric space characterizing 3-D finite-volume buoyant HFs described in this paper should help to better design experiments within well-defined propagation history.
7. Conclusions
We have shown that finite-volume hydraulic fractures (HFs) are characterized entirely by a dimensionless buoyancy  $\mathcal {B}_{ks}={\rm \Delta} \gamma \,E^{\prime 3/5}V_{o}^{3/5}/K_{Ic}^{8/5}$ relating the total released
 $V_{o}$ to the minimum volume necessary for self-sustained buoyant propagation,
 $V_{\hat {k}}^{head}=K_{Ic}^{8/3}/(E^{\prime }\,{\rm \Delta} \gamma ^{3/5})$, namely
 $\mathcal {B}_{ks}=(V_{o}/V_{\hat {k}}^{{head}})^{3/5}$, and a dimensionless viscosity
 $\mathcal {M}_{\hat {k}}=\mu ^{\prime }Q_{o}E^{\prime 3}\,{\rm \Delta} \gamma ^{2/3}/K_{Ic}^{14/3}$ representative of the ratio between the energy dissipation through viscous flow and the creation of new surfaces at the change from radial to buoyant propagation. Although the emergence (or not) of a self-sustained buoyant fracture depends solely on
 $\mathcal {B}_{ks}$ – in other words, on the total volume released and material and fluid parameters – the details of the release (duration and injection rate) have a first-order impact on the shape and propagation rates of the fracture through the dimensionless viscosity
 $\mathcal {M}_{\hat {k}}$. Combining these two dimensionless numbers (
 $\mathcal {B}_{ks}$,
 $\mathcal {M}_{\hat {k}}$) reveals six regions corresponding to distinct propagation histories (see figure 2 and table 1).
For a finite value of the material fracture toughness ( $K_{Ic}\neq 0$), the toughness-dominated pulse solution of Garagash & Germanovich (Reference Garagash and Germanovich2014) characterizes the late-time buoyant head and the fracture breadth in its vicinity (
 $b^{head}={\rm \pi} ^{-1/3}\ell _{b}$). Note that such a late-time solution may appear only at very late times and that it does not describe the complete fracture shape. In the zero-toughness case (
 $K_{Ic} = 0$), the fracture head continues to lose fluid such that its volume approaches zero asymptotically. Due to the finiteness of the released volume, the maximum lateral breadth stabilizes at a finite value even for the zero-toughness case. It is thus possible to relate the limiting breadth close to the head, given by the solution of Garagash & Germanovich (Reference Garagash and Germanovich2014), to the stabilized maximum one. We define this parameter as the overrun
 $O$, and derive its value for the different regions of the parametric space. Note that this parameter gives only an idea of the shape: a similar overrun does not imply that the fracture has the same overall shape. When the fracturing toughness is zero, the head breadth tends to zero (e.g.
 $\ell _{b}=0\to b^{head}=0$), resulting in an infinite overrun. It is important to note that this does not imply unbounded lateral growth, as lateral growth is limited by the finite volume rather than fracture toughness.
The identified late-time behaviour further fixes the late-time ascent rate to the toughness-dominated solution as  $\dot {\ell }_{\hat {k}}^{[V]}(t)\sim V_{o}^{2/3}\,{\rm \Delta} \gamma ^{7/9}/(K_{Ic}^{4/9}\mu ^{\prime 1/3}t^{2/3})\propto t^{1/3}$. An important observation is that the time power-law dependence of the ascent rate for a viscosity-dominated buoyant fracture is equivalent (e.g.
 $\dot {\ell }_{\hat {m}}^{[V]}\sim V_{o}^{1/2}\,{\rm \Delta} \gamma ^{1/2}/(E^{\prime 1/6}$
 $\mu ^{\prime 1/3}t^{2/3})\propto t^{1/3}$). During its history, a buoyant HF can first ascend in a viscosity-dominated manner as
 $\dot {\ell }_{\hat {m}}^{[V]}(t)$, and then transition to the limiting ascent rate dictated by the late toughness solution
 $\dot {\ell }_{\hat {k}}^{[V]}(t)$. The late-time ascent rate of the toughness limit is always faster than (or at least equal to) that of the viscosity-dominated limit (
 $\dot {\ell }{}_{\hat {k}}^{[V]}(t)=\mathcal {B}_{ks}^{5/18}\dot {\ell }{}_{\hat {m}}^{[V]}(t)$, with
 $\mathcal {B}_{ks}\geq 1$ for a self-sustained buoyant fracture). Fractures transitioning when the fluid release is still ongoing can show even higher velocities during their propagation history. Estimations or averaging of vertical growth rates must be done with great care and must necessarily account for both
 $\mathcal {M}_{\hat {k}}$ and
 $\mathcal {B}_{ks}$. In other words, both the details of the release history (rate and duration) do significantly impact the ascent rate even long after the end of the release. The dependence on the release history implies that for realistic cases (as well as laboratory experiments), the details of the release matter such that a more complicated evolution of the release (compared to the simple constant release rate / finite duration) will undoubtedly impact the growth of buoyant fractures.
Notably, most parameter combinations for anthropogenic HFs would lead to self-sustained buoyant propagation between the well-distinct regions of the parametric space depicted in figure 2. Additionally, the time required to reach the late-time solution at the propagating edge, and the fracture size when doing so, naturally clash with sample sizes in the laboratory or the scales of heterogeneities in the upper lithosphere. We emphasize that even though theoretically buoyant fractures emerge (see § 6.1), to our knowledge, nearly no cases of buoyant fractures from hydraulic fracturing treatments reaching the surface have been reported. We expect this to originate from the interaction with heterogeneities, fluid leak-off, confining stress jumps, and other possible arrest mechanisms not considered in this paper.
Supplementary material
Supplementary material is available at https://doi.org/10.1017/jfm.2023.711.
Acknowledgements
The authors gratefully acknowledge in-depth discussions with D. Garagash.
Funding
This work was funded by the Swiss National Science Foundation under grant no. 192237.
Declaration of interests
The authors report no conflict of interest.
Data availability statement
The data supporting this study's findings are openly available at 10.5281/zenodo.7788051.
Author contributions
A.M.: conceptualization, methodology, formal analysis, investigation, software, validation, visualization, writing – original draft. B.L.: conceptualization, methodology, formal analysis, validation, supervision, funding acquisition, writing – review and editing.
Appendix. Recapitulating tables of scales
We list all the characteristic scales used within this paper in tables 3 and 4, for completeness. A Wolfram Mathematica notebook containing their derivation and the different scalings is also provided as supplementary material.
Characteristic scales (and governing dimensionless parameters) in the different scalings.
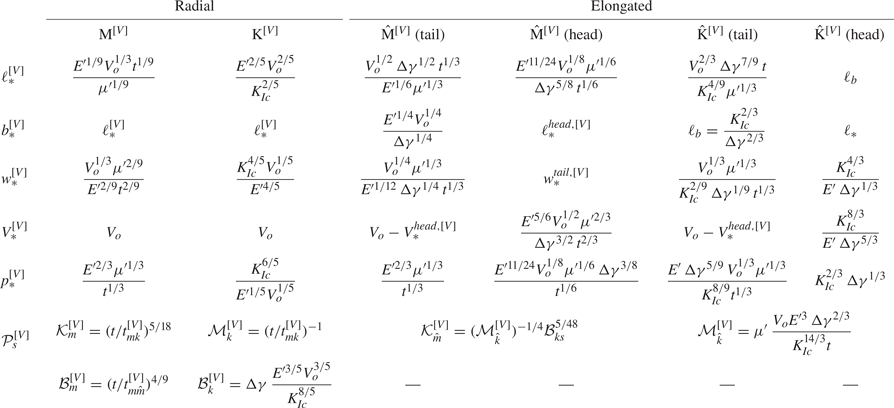
Transition scales between regimes. The transition scales of the  $\textrm {M}^{[V]}\rightarrow \textrm {K}^{[V]}$ transition correspond to the
 $\textrm {K}^{[V]}$ scales, and the transition scales of the
 $\hat {\textrm {M}}^{[V]}\rightarrow \textrm {\ensuremath {\hat {\textrm {K}}}}^{[V]}$ (head) to the
 $\hat {\textrm {K}}^{[V]}$ scales of the head, given respectively as
 $\textrm {K}^{[V]}$ and
 $\hat {\textrm {K}}^{[V]}$ (head) in table 3.
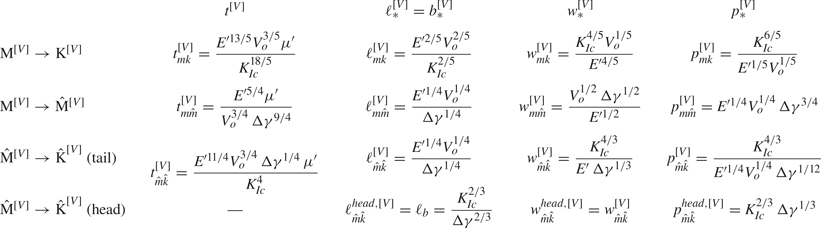


 Open access

