INTRODUCTION
Legumes are key components of sustainable cropping systems. This is because they may access atmospheric N2 through a symbiotic relationship in their root system with a group of soil-borne bacteria collectively called rhizobia, which results in the development of specialised organs called nodules. The symbiotic microorganisms in the root nodules take up gaseous di-nitrogen from the air and fix nitrogen into ammonia or amino acids. The N2 can then be assimilated by the host plant, which in turn provides carbon resources to the rhizobia. Symbiotic N2 fixation in legumes is not obligatory for the survival of the host plant as they can use mineral N in soil (Namvar and Sharifi, Reference Namvar and Sharifi2011; Voisin et al., Reference Voisin, Salon, Munier-Jolain and Ney2002a; Reference Voisin, Salon, Munier-Jolain and Ney2002b).
A number of reviews have been published on biological nitrogen fixation (BNF) in legumes (Cheema and Ahmad, Reference Cheema and Ahmad2000; Salvagiotti et al., Reference Salvagiotti, Cassman, Specht, Walters, Weiss and Dobermann2008; Van Kessel and Hartley, Reference Van Kessel and Hartley2000). Most authors agree that an increase in the concentration of combined N in soil decreases nodule establishment, legume nodulation activity and N2 fixation; thus, legume crops are not usually fertilised with mineral N. However, there are at least two agronomic cases when it would be advantageous to distribute N fertiliser to legume crops. The first is at sowing, before the onset of nodule functioning, when young legume plants require N from external sources in order to achieve proper vegetative growth and the N2-fixing symbiosis. In this situation, amounts of N fertiliser of about 50 kg ha−1, defined as ‘starter N’, have been proved to be beneficial to plant development and subsequent nodulation (Namvar and Sharifi, Reference Namvar and Sharifi2011; Van Kessel and Hartley, Reference Van Kessel and Hartley2000). The second case is when a legume is intercropped with a cereal. Given that the N transfer from the legume crop to companion intercropped species is very low (Mariotti et al., Reference Mariotti, Masoni, Ercoli and Arduini2012; Pirhofer-Walzl et al., Reference Pirhofer-Walzl, Rasmussen, Høgh-Jensen, Eriksen, Søegaard and Rasmussen2012), a rate of N fertiliser of about 80 kg ha−1 is required for the intercropping in order to sustain the cereal's high yield (Ghaley et al., Reference Ghaley, Hauggaard-Nielsen, Høgh-Jensen and Jensen2005).
Only a few studies have attempted to establish a quantitative relationship between grain yield or N2 fixation and the N fertiliser rate in grain legume crops grown in soil (Salon et al., Reference Salon, Munier-Jolain, Duc, Voisin, Grandgirard, Larmure, Emery and Ney2001; Voisin et al., Reference Voisin, Salon, Munier-Jolain and Ney2002b). According to Streeter (Reference Streeter1988), the vast majority of studies have been carried out in controlled environments with nutrient solutions supplied to inert solids, and most experiments have been conducted to verify whether soil N can inhibit the formation and development of nodules or nitrogen fixation. Moreover, many experiments only evaluated the starter N effect; thus, scheduling very low N rates and making observations only for a short time after sowing (Jensen, Reference Jensen1986; Reference Jensen1987; Voisin et al., Reference Voisin, Salon, Munier-Jolain and Ney2002b). Nitrogen rates higher than 50 kg ha−1 applied at sowing, usually decreased the BNF of grain legume crops (Voisin et al., Reference Voisin, Salon, Munier-Jolain and Ney2002b) whilst rarely affected grain yield (Clayton et al., Reference Clayton, Rice, Lupwayi, Johnston, Lafond, Grant and Walley2004; Voisin et al., Reference Voisin, Salon, Munier-Jolain and Ney2002a; Reference Voisin, Salon, Munier-Jolain and Ney2002b). The stimulating effect on legume BNF at relatively low levels of soil mineral N at sowing should be distinguished from the inhibition of legume BNF by high levels of soil mineral N, and declines in BNF should also be distinguished from grain yield reduction.
In this research, we hypothesised that in grain legume crops: (i) BNF is positively related to nodule mass, (ii) nodule mass is negatively related to N fertilisation and (iii) previous relationships differ amongst legume crops. Thus, we highlight the impact of various levels of fertiliser nitrogen applied at sowing time on grain yield, nodulation capacity and BNF in the four most common grain legume crops grown in central Italy: chickpea, field bean, pea and white lupin. The experiment was carried out in growth boxes in order to measure the entire root system and nodule biomass.
MATERIALS AND METHODS
Site characteristics and experimental design
The research was carried out in two consecutive years, 2011 and 2012, at the Research Centre of the Department of Agriculture, Food and Environment of the University of Pisa, Italy, which is located at a distance of approximately 5 km from the sea (43°40′ N, 10°19′ E) and 1 m above sea level. The climate of the area is hot-summer Mediterranean (Csa) with mean annual maximum and minimum daily air temperatures of 20.2 and 9.5 °C, respectively, and a mean rainfall of 971 mm year−1.
In both years, experimental treatments consisted of five crops (four legume crops plus durum wheat) and five levels of mineral nitrogen fertilisation, arranged in a randomised block design. Three replications were used. The four legumes were chickpea (Cicer arietinum L. cv. Pascia), field bean (Vicia faba L. var. minor cv. Chiaro di Torrelama), pea (Pisum sativum L. cv. Iceberg) and white lupin (Lupinus albus L. cv. Multitalia). Durum wheat (Triticum durum L. cv. Claudio) was used as non-N2-fixing reference crop in order to determine plant-available soil nitrogen and estimate BNF. Applied N rates were 0 kg ha−1 (N0), 40 kg ha−1 (N40), 80 kg ha−1 (N80), 120 kg ha−1 (N120) and 160 kg ha−1 (N160). Nitrogen was applied pre-planting as urea and deep placed at 10 cm. Legume crops and durum wheat were supplied with the same amounts of fertiliser and were grown exactly under the same conditions.
Experimental equipment and crop management
In each year, the open-air facility consisted of 75 growth boxes (15 per species) of 200-L volume (0.25 m2 area and 0.8 m depth), spaced 20 cm apart and embedded in expanded clay to avoid daily fluctuations in soil temperature. In both growing seasons, approximately 6 months before seeding, growth boxes were filled with soil collected from a field previously cultivated with rapeseed (Brassica napus L.). The main properties of the soil before N fertiliser application were similar in the 2 years and were approximately: 71.0% sand, 23.7% silt, 5.3% clay (USDA method), 8.1 pH, 1.5% organic matter (Walkley and Black method), 0.6 g kg−1 total nitrogen (Kjeldahl method), 11.9 mg kg−1 available P (Olsen method), 122.1 mg kg−1 available K (BaCl2-TEA method), 1.9 mg kg−1 soil mineral N (NO3-N and NH4-N) concentration (potentiometric method after extraction with 2M KCI and filtration). The soil pH was in the range of basic tolerance of all four legumes (Jayasundara et al., Reference Jayasundara, Thomson and Tang1998) and durum wheat (Westerman, Reference Westerman and Heyne1987).
Both legumes and durum wheat were grown following a standard technique for central Italy, with the exception of nitrogen fertilisation. Phosphorus was applied pre-planting as triple superphosphate at the rate of 150 kg ha−1 of P2O5 for all the crops. Potassium was also applied pre-planting as potassium sulphate at the rate of 150 kg ha−1of K2O and 54 kg ha−1 of S for all the crops. The legumes and durum wheat were sown on 11 February 2011 and on 14 February 2012, within the optimum planting time for spring legume production in central Italy. Legume seeds were inoculated just prior to sowing with a specific commercial rhizobial inoculant using Rhizobium leguminosarum bv. viciae for field bean and pea, Mesorhizobium ciceri for chickpea and Bradyrhizobium sp. (Lupinus) for white lupin. In both years, three weeks after sowing, chickpea was thinned to 32 plants m−2, field bean and pea to 56 plants m−2 and white lupin to 40 plants m−2. Row spacing was 30 cm for all the crops. Durum wheat was sown at a rate of 400 germinable seeds m−2 with a 15-cm row spacing and was not thinned. In both years, all crops were irrigated from flowering to maturity (May to June). In this period, 100 mm of irrigation water was applied and 40 mm in 2011 and 60 mm in 2012 came from rainfall. Weed control was performed throughout the two crop cycles by hand hoeing.
Sampling procedures and measurements
All five crops were harvested at physiological maturity: 24 June for field bean and pea, 5 July for chickpea, white lupin and durum wheat in 2011; and 22 June for pea, 26 June for field bean, 4 July for chickpea and durum wheat and 9 July for white lupin in 2012. Plants were cut at ground level and partitioned into seeds, pod-walls or chaff, stems+leaves, taproots, rootlets and nodules. Roots were separated from the soil by gently washing to minimise loss or damage by a low flow from sprinklers. One sample of roots was stored in a refrigerator until the length of the roots was measured, which was estimated with the line intersection method (Tennant, Reference Tennant1975). Dry weight of all plant parts was determined by oven-drying at 60 °C to constant weight. The number of pods or spikes was recorded and mean seed weight, harvest index and shoot/root ratio were determined. All plant parts were analysed for N concentration by the microKjeldahl method. Nitrogen content was obtained by multiplying N concentrations by dry matter of different plant parts.
The amount of N fixed was estimated with the improved N difference method, as proposed by Evans and Taylor (Reference Evans and Taylor1987): [total N content in legume crop – total N content in reference crop] + [soil mineral N in legume crop at harvest – soil mineral N in reference crop at harvest]. Durum wheat was grown as the non-N2-fixing reference crop. The non-N2-fixing reference crop should be (i) a non-legume; (ii) a non-nodulating legume of the same species as the N2-fixing plant or (iii) an uninoculated legume in a system without a background population of compatible rhizobia. Ideally, the non-N2-fixing and N2-fixing plants would be of the same species. In practice, it is difficult to prevent contamination with rhizobia and infection of plants, especially in soils, and so non-N2-fixing species are more commonly used (Ashworth et al., Reference Ashworth, West, Allen, Keyser, Weiss, Tyler, Taylor, Warwick and Beamer2015; Danso, Reference Danso1995, Peoples et al., Reference Peoples, Unkovich, Herridge, Emerich and Krishnan2009; Unkovich et al., Reference Unkovich, Herridge, Peoples, Cadisch, Boddey, Giller, Alves and Chalk2008). In order to estimate N2-fixation in cool season grain legumes, the non-legume species barley and wheat are the more suitable reference crops (Henson, Reference Henson1993; Kadiata et al., Reference Kadiata, Schubert and Yan2012; López-Bellido et al., Reference López-Bellido, López-Bellido, Redondo and Benítez-Vega2006; Reference López-Bellido, López-Bellido, Benítez-Vega, Munoz-Romero, López-Bellido and Redondo2011; Neugschwandtner et al., Reference Neugschwandtner, Ziegler, Kriegner, Wagentristl and Kaul2015; Unkovich et al., Reference Unkovich, Herridge, Peoples, Cadisch, Boddey, Giller, Alves and Chalk2008).
The nodule fixation activity (NFA) is the amount of N2 fixed per unit mass of nodules and was calculated at harvest as: N2 fixed (g m−2)/nodule dry weight (g m−2).
Weather conditions
Daily minimum and maximum temperatures, rainfall and reference evapotranspiration during both growing seasons were obtained from a meteorological station located within 100 m from the trial site. Accumulated growth season rainfall in 2011 and 2012 was 283 and 284 mm, respectively, both below the 20-year average of 322 mm. Rainfall was concentrated in February–March in 2011 and in April in 2012. The average maximum and minimum temperatures for the growing seasons were 21.6 and 8.7 °C in 2011 and 21.5 and 7.9 °C in 2012. Maximum and minimum temperatures did not differ from the 20-year average for the area and were similar in the 2 years, the only exception being the lower temperatures in February 2012. Accumulated reference evapotranspiration was similar in the 2 years (425 mm in 2011 and 396 mm in 2012) and did not differ from the 20-year average.
Statistical analysis
Results were subjected to analysis of variance. The effect of year, crop, and N rate, and their interactions were analysed using a split–split-plot design with year designed as whole plots, crop as sub-plots and N rate as sub–sub-plots. Significantly different means were separated at the 0.05 probability level by the least significant difference test (Steel et al., Reference Steel, Torrie and Dickey1997).
RESULTS
Analysis of variance revealed non-significant effects of years or ‘Year × Crop × N rate’ interaction, ‘Year × N rate’ interaction, ‘Year × Crop’ interaction for all the parameters measured. Accordingly, the following results are averaged over the 2 years.
Above ground biomass
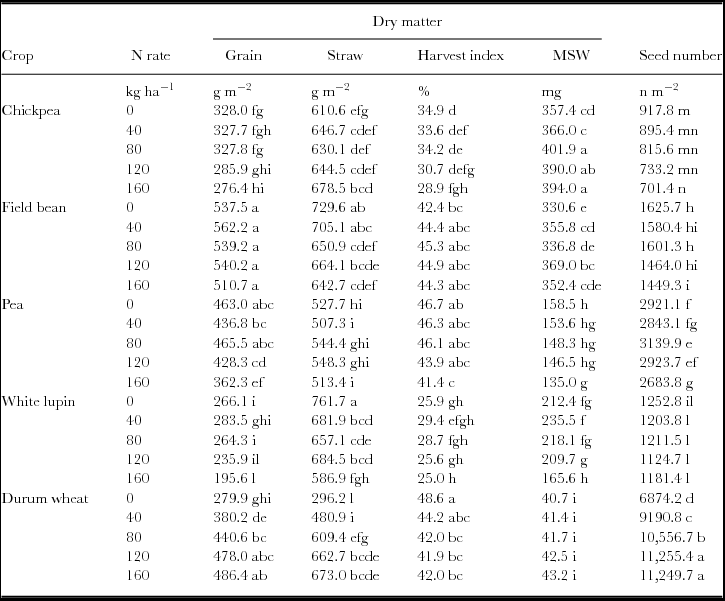
Biomass differed greatly amongst the four legume crops owing to their morphological and physiological features. Without N fertilisation, grain yield of field bean was 16% higher than pea, 64% higher than chickpea and 102% higher than white lupin, whilst straw of field bean was 38% higher than pea and 19% higher than chickpea but 4% lower than white lupin (Table 1).
Grain and straw dry matter, harvest index, mean seed weight (MSW) and seed number as affected by ‘Crop × N rate’ interaction. Values followed by different letters within column are significantly different (P < 0.05).

Nitrogen fertilisation did not modify the grain yield of field bean, whilst the highest N rate decreased the grain yields of white lupin (−27%), chickpea (−16%) and pea (−22%). The grain yield reduction was due to a lower number of seeds m−2 in chickpea, to a lower mean seed weight in white lupin and to both in pea (Table 1). Nitrogen fertilisation did not modify the straw of chickpea and pea, whilst the highest N rate decreased the straw of field bean (−12%) and white lupin (−23%) (Table 1). The harvest index (Table 1) was unaffected by N supply in field bean and white lupin, and was reduced by the highest N rate in chickpea (−17%) and in pea (−11%).
Nitrogen fertilisation progressively increased grain yield and straw of wheat and at the highest N rate grain yield and straw were 74 and 127%, respectively higher than control (Table 1). The grain yield increase in wheat was mainly due to increased seed number (Table 1).
Root system
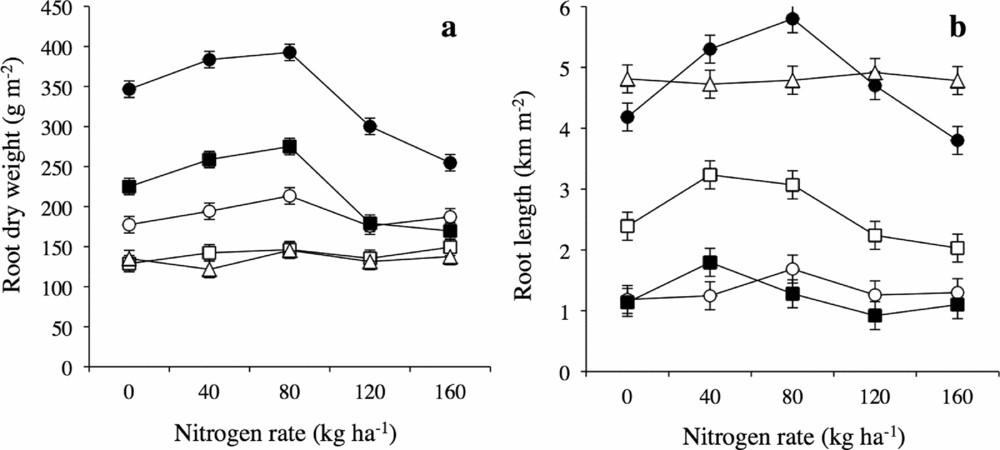
Without N fertilisation, the dry weight of field bean roots (347 g m−2) was 169% higher than pea, 95% higher than chickpea and 54% higher than white lupin (Figure 1). Nitrogen fertilisation did not modify root biomass in pea and increased that of field bean, chickpea and white lupin up to N80, and thereafter values decreased. With the highest N rate, root biomass was 25% lower than the control in field bean and in white lupin and equal in chickpea. Overall differences were due to the rootlets, since taproots were not affected by N supply in any of the crops. Taproot biomass was negligible in pea and chickpea, and accounted for 11% and 21% of the total root biomass, respectively in field bean and white lupin, irrespective of the N supply.
Root dry weight (a) and root length (b) as affected by ‘Crop × N rate’ interaction. Vertical bars indicate LSD at P < 0.05. Open circles, chickpea; solid circles, field bean; open squares, pea; solid squares, white lupin; open triangles, durum wheat.

Without N fertilisation, roots were 21% of the total plant biomass in field bean, 18% in white lupin, 16% in chickpea and 11% in pea. The root/shoot ratio was not modified by N fertilisation in chickpea and pea, whilst in the other two crops, it increased up to N80 and then decreased.
When no N fertiliser was added, the length of field bean roots (4.2 km m−2) was by 75% higher than pea, 253% higher than chickpea and 268% higher than white lupin (Figure 1). Roots were lengthened by N fertilisation up to N40 in pea and white lupin (+35 and +58%, respectively) and up to N80 in chickpea and in field bean (+42 and +86%, respectively). At higher N supply root length decreased, so that with the highest N rate it was slightly lower than the unfertilised control in field bean and pea (−9 and −15%) and was unchanged in chickpea and white lupin. Root biomass and length of wheat were unchanged by N fertilisation (Figure 1).
Nodule biomass
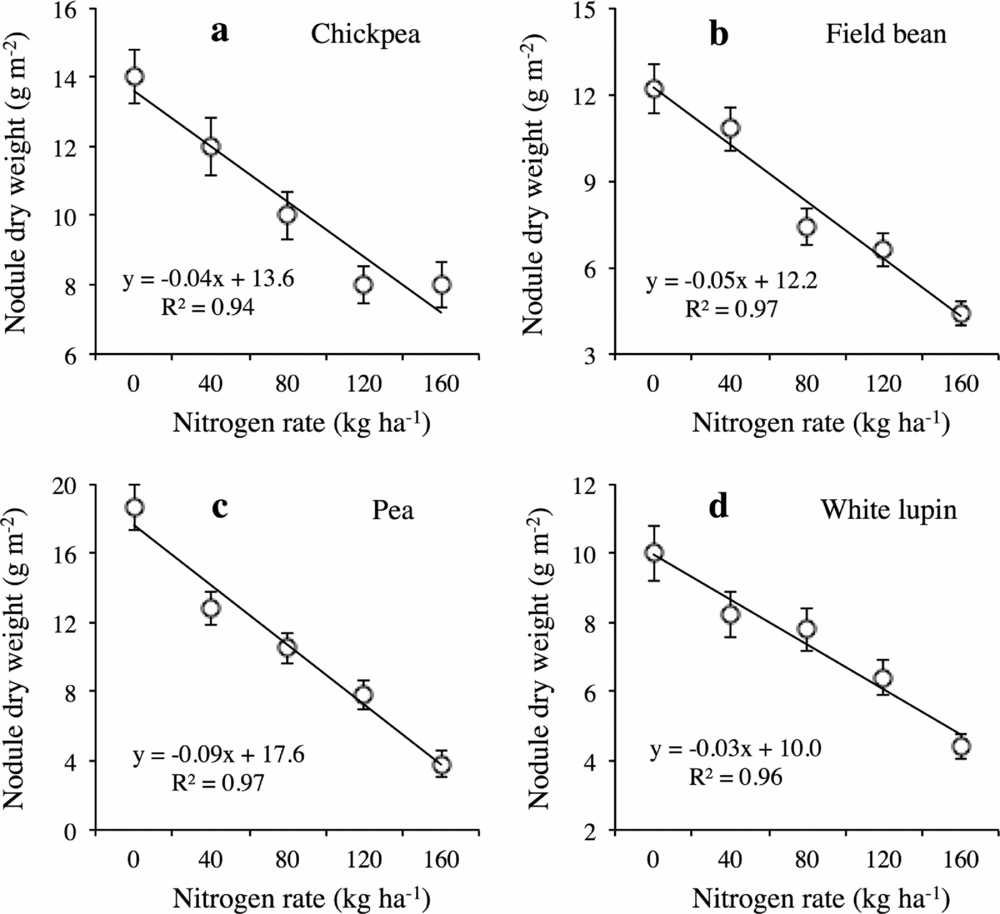
When no N fertiliser was added, nodule biomass of pea (18.6 g m−2) was 33% higher than chickpea, 52% higher than field bean and 86% higher than white lupin. The nodule mass of the four legumes was inversely related to the levels of the N fertiliser applied (Figure 2). The reduction rate differed amongst legume crops and each kg of applied N decreased the nodule biomass by 30 mg m−2 in white lupin, 40 mg m−2 in chickpea, 50 mg m−2 in field bean and 90 mg m−2 in pea. Accordingly, with 160 kg N ha−1 nodule biomass of chickpea was approximately twice that of field bean, pea and white lupin. When no N fertiliser was added, nodule biomass accounted for 4% of total root biomass in field bean and white lupin, for 8% in chickpea and for 14% in pea. With the highest N rate, nodule biomass declined to less than 4% in all the four crops.
Relationship between nodule dry weight and N rate in chickpea (a), field bean (b), pea (c) and white lupin (d). Vertical bars indicate standard error.

Nitrogen concentration and content
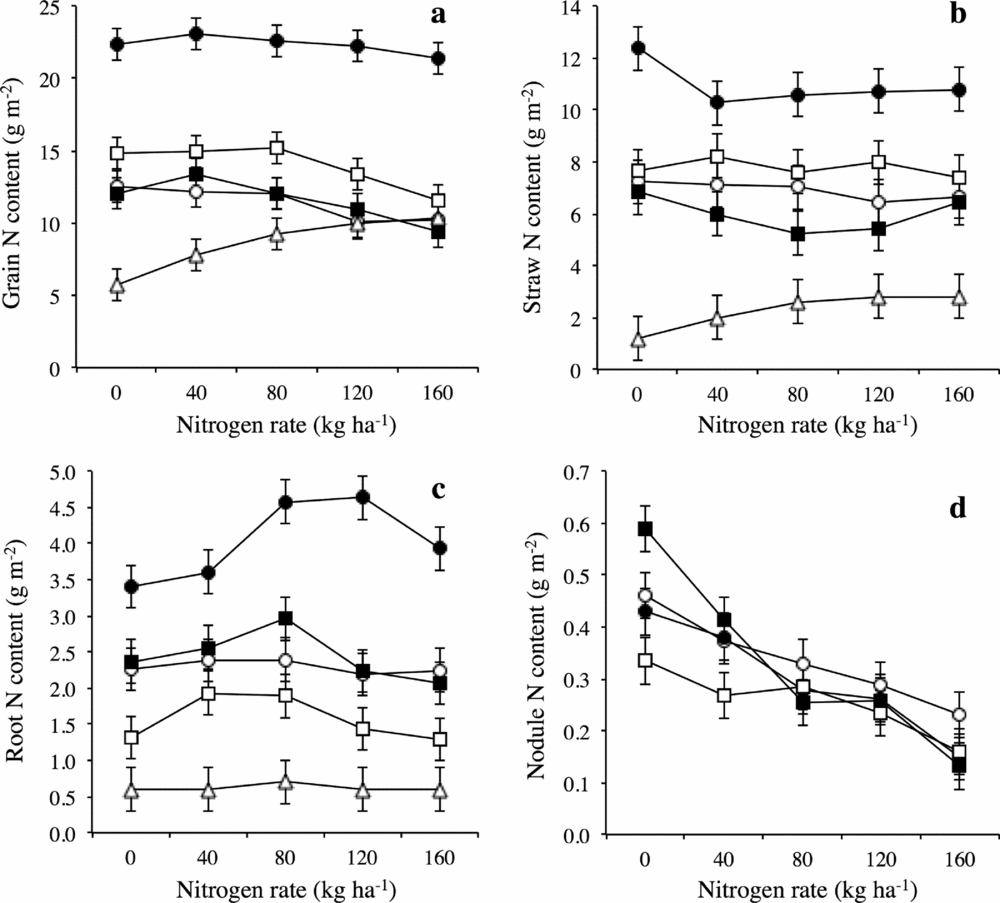
Nitrogen concentrations of grain and straw were not affected by N fertilisation. Considering averages over the N rates, grain N concentration of field bean and white lupin (4.5 g kg−1) was higher than that of chickpea and pea (3.5 g kg−1), whilst straw N concentration of field bean and pea (1.6 g kg−1) was higher than that of chickpea and white lupin (1.0 g kg−1). The N concentration of roots and nodules was not affected by N rates and was similar amongst crops averaging 1.2 and 3.4%, respectively.
Nitrogen fertilisation did not modify the grain N content of field bean, whilst the highest N rate decreased the grain N content of chickpea, pea and white lupin by approximately 20% (Figure 3). Straw N content of chickpea, pea and white lupin was unchanged by N fertilisation, whilst that of field bean decreased with all N rates applied. The N content of roots was the highest with N80 in field bean, pea and white lupin, whilst in chickpea the N content was not modified by N supply. When no N fertiliser was added, the nitrogen content of nodules was less than 0.6 g m−2 with slight differences amongst crops and amongst N rates, and depending on dry matter variations, decreased with increasing N rates (Figure 3). The amount of N uptake by durum wheat (reference crop) progressively increased with N supply from 7.5 to 13.7 g m−2 (Figure 3).
Nitrogen content of grain (a), straw (b), roots (c) and nodules (d) as affected by ‘Crop × N rate’ interaction. Vertical bars indicate LSD at P < 0.05. Open circles, chickpea; solid circles, field bean; open squares, pea; solid squares, white lupin; open triangles, durum wheat.

Without N fertilisation, total N content of field bean was 58% higher than pea, 72% higher than chickpea and 79% higher than white lupin. Nitrogen fertilisation did not statistically change total N content of field bean whilst it decreased that of chickpea and white lupin with N rates higher than 80 kg ha−1 and that of pea with the highest supply. As N rate increased from 0 to 160 kg ha−1, the total N content of chickpea, pea and white lupin decreased by approximately 15%.
Nitrogen fertilisation progressively increased grain and straw N content of wheat and at the highest N rate grain yield was 81% higher than control and straw was 133% (Table 1). Nitrogen content of roots was unchanged by N fertilisation.
Nitrogen fixation
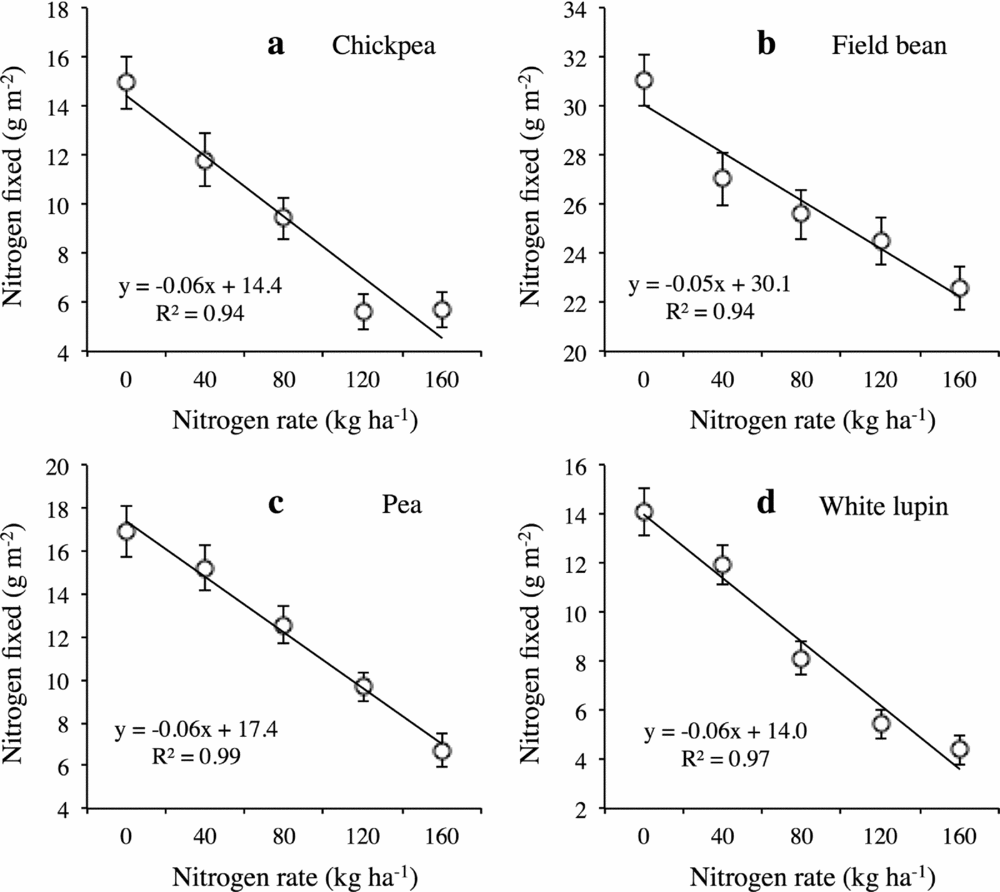
When no N fertiliser was added, the amount of N2 fixation in field bean reached 31.1 g m−2 and was approximately twice that of the other three legume crops. Nitrogen fertilisation significantly influenced the amounts of N2 fixed by all legume crops, and a negative linear relationship was observed between N fertiliser rate and N2 fixation (Figure 4). However, the reduction rate differed amongst crops and each kg of applied N decreased N2 fixed by 50 mg N m−2 in field bean and by approximately 60 mg N m−2 in chickpea, pea and white lupin. Because of the linear decline, the increasing N supply from 0 to 160 kg ha−1 reduced the amount of N2 fixed by only 27% in field bean but up to 60–69% in chickpea, pea and white lupin.
Relationship between nitrogen fixed and N rate in chickpea (a), field bean (b), pea (c) and white lupin (d). Vertical bars indicate standard error.

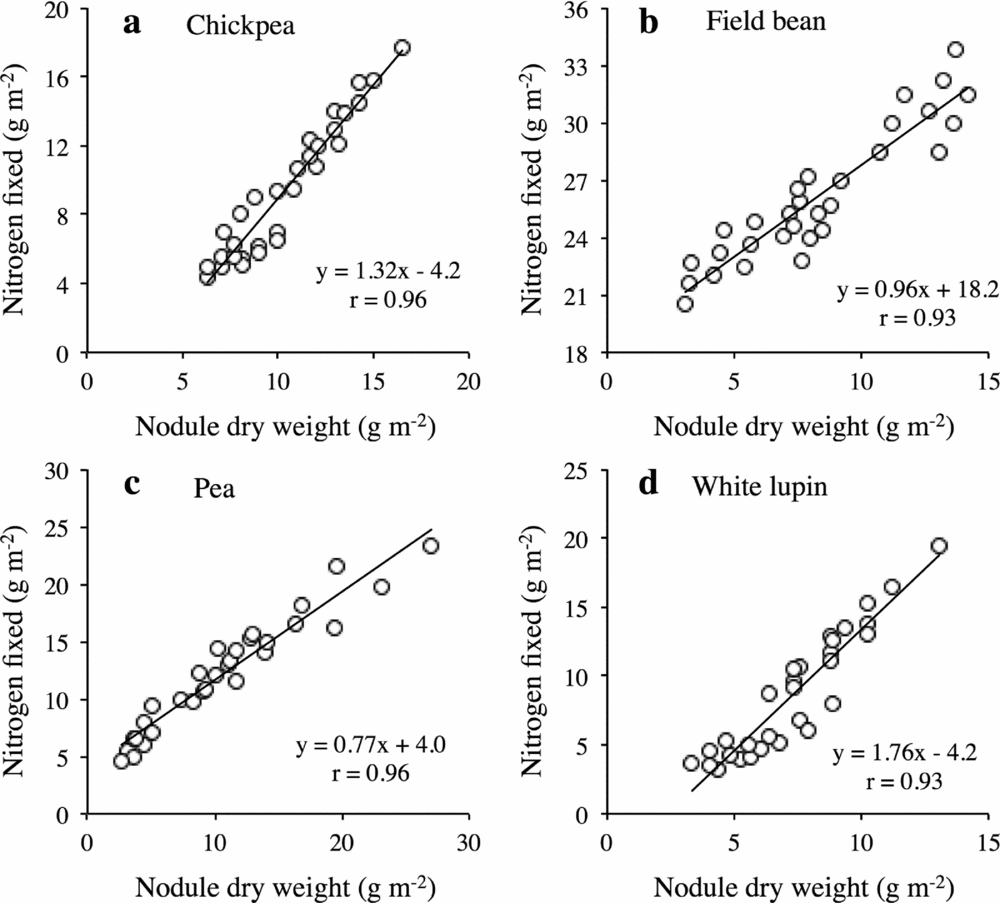
For each crop, the amount of N2 fixed was highly correlated with nodule mass (Figure 5). The increase in N2 fixed per gram of nodule dry weight was 1.8 g m−2 in white lupin, 1.3 g m−2 in chickpea, 1.0 g m−2 in field bean and 0.8 g m−2 in pea.
Relationship between nitrogen fixed and nodule dry weight in chickpea (a), field bean (b), pea (c) and white lupin (d). Data from 2 years, five N rates and three replications.

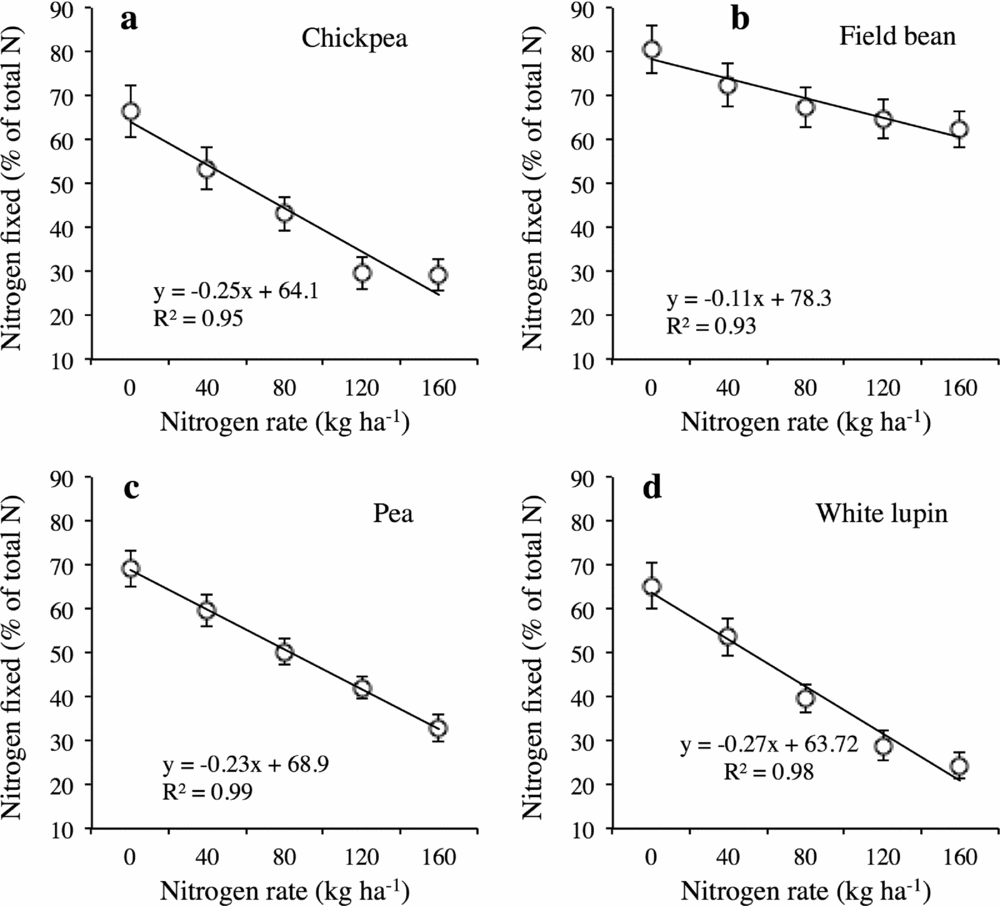
When no N fertiliser was added, N2 fixation accounted for 81% of total N in field bean and approximately 67% in chickpea, pea and white lupin. In all the four crops, the proportion of fixed N also linearly decreased with increasing N-fertiliser additions (Figure 6). However, once again, the decrease differed amongst species. In chickpea, pea and white lupin (about 0.25% kg−1 of N applied) the proportion was twice as high as in field bean. With 160 kg N ha−1 N2 fixation accounted for 62% in field bean, but only for 33% in pea, 29% in chickpea and 24% in white lupin.
Relationship between percentage of nitrogen fixed on total N and N rate in chickpea (a), field bean (b), pea (c) and white lupin (d). Vertical bars indicate standard error.

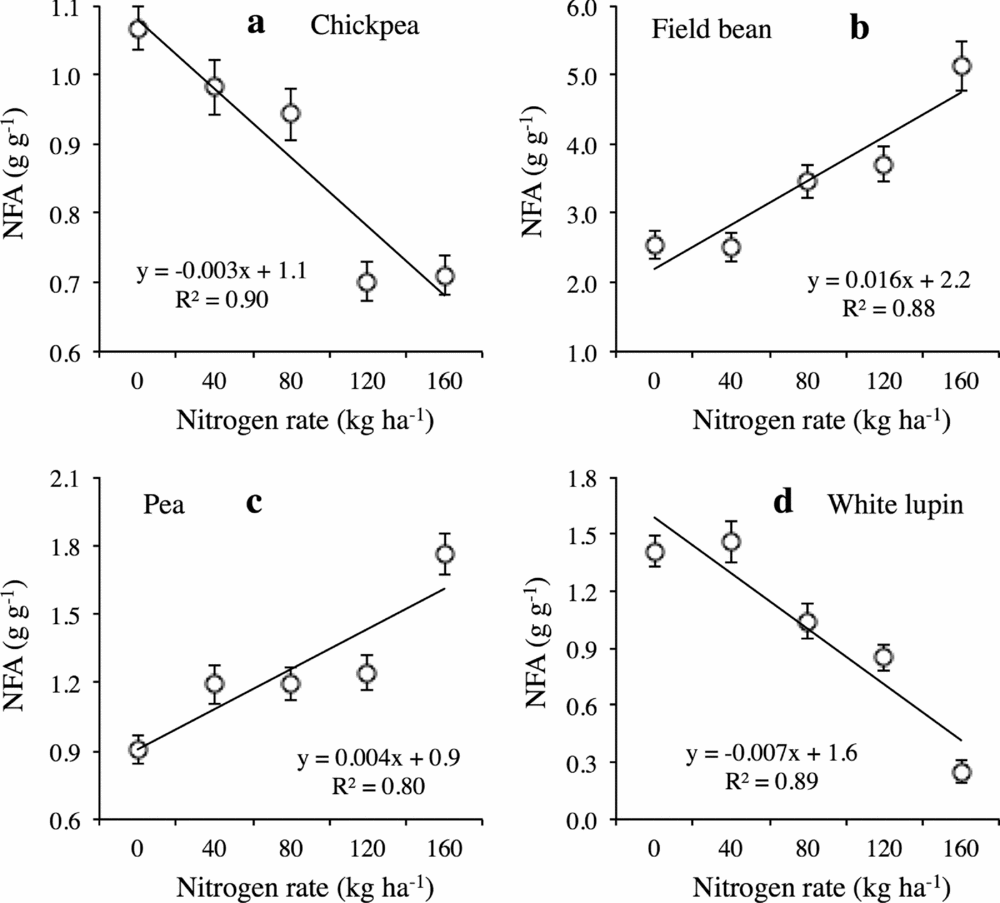
Regression analysis for NFA against N rate indicated highly significant relation in all the four legume crops (Figure 7). However, NFA increased in field bean and pea with the increasing N supply, whilst it decreased in chickpea and white lupin. Each kg of N applied with fertilisation increased the amount of N2 fixed per gram nodule by 16 mg in field bean and by 4 mg in pea, and decreased those of chickpea and white lupin, respectively by 3 and 7 mg.
Relationship between nodule fixation activity (NFA) and N rate in chickpea (a), field bean (b), pea (c) and white lupin (d). Vertical bars indicate standard error.

DISCUSSION
Aerial biomass
We found that well-nodulated legumes (non-fertilised controls) overall grew and yielded grain, total biomass and nitrogen at a similar level to plants supplied with 80–120 kg ha−1 of mineral nitrogen. These findings highlighted that symbiotic nitrogen fixation and root mineral N absorption are complementary up to a certain N supply, and within this range of N levels plants substituted with N from the fertiliser the amount of nitrogen they ordinarily would have derived from biological fixation. Similar results were previously reported by Deibert et al. (Reference Deibert, Bijeriego and Olson1979), Sagan et al. (Reference Sagan, Ney and Duc1993) and Voisin et al. (Reference Voisin, Salon, Munier-Jolain and Ney2002a; Reference Voisin, Salon, Munier-Jolain and Ney2002b), who found that biomass, nitrogen accumulation and seed yield were not affected by mineral N applications. However, above these N rates (80–120 kg N ha−1), the biomass and N yield of chickpea, pea and white lupin decreased, thus indicating that high N fertiliser supply decreased the level of N2 fixed to such an extent that the full N2-fixing potential might not have been achieved. Our results partially support the hypothesis of Lemaire et al. (Reference Lemaire, Gastal, Plenet, Le Bot, Lemaire and Nicolardot1997), who stated that relationships between N and growth would be unchanged by the N nutrition regime.
Root biomass
In greenhouse trials, Arrese-Igor et al. (Reference Arrese-Igor, Minchin, Gordon and Nath1997) and Schulze et al. (Reference Schulze, Adgo and Merbach1999) showed that legumes grown with mineral N usually have a more developed root system than strictly fixing plants. They hypothesised that the nitrate supply can have a considerable impact on carbohydrate partitioning, leading to enhanced root development thus providing an increased absorption surface. Thus, differences in carbon costs between symbiotic nitrogen fixation and nitrate absorption could be incurred by growth and/or maintenance of the nodulated roots. As such, the presence of mineral N in the soil can lead to higher root biomass through the limitation of BNF and its associated high C costs. However, under field conditions, Gunawardena et al. (Reference Gunawardena, McKenzie, Hill and Goh1998) and Jensen (Reference Jensen1987) did not find any difference in pea roots due to N fertilisation and Jensen (Reference Jensen1986) and Voisin et al. (Reference Voisin, Salon, Munier-Jolain and Ney2002a) reported a positive effect of mineral N on root growth but only with N rates lower than 100 kg ha−1, whilst no variation was found with higher rates. We found that the dry weight of pea roots progressively increased with the increase in N rate, whilst those of chickpea, field bean and white lupin increased up to 80 kg ha−1 and thereafter decreased. Similarly, in all four crops root length increased up to N40–N80, and thereafter decreased. Thus, upon a certain N concentration in the soil, plants may not have needed to lengthen their roots to absorb nitrogen.
Nodule biomass
Nodule mass of all four crops was inversely related to the levels of the N fertiliser applied. However, nitrogen fertilisation reduced the nodule mass of field bean and pea more than that of chickpea and white lupin (two fold). Voisin et al. (Reference Voisin, Salon, Jeudy and Warembourg2003) reported that nodule growth was not affected by N source and the negative effect of nitrate on nodule mass might only result from the delayed onset of nodules. Unfortunately, we did not measure the number of nodules per plant thus it is not possible to know whether the reduced nodule mass was due to a delay in nodule initiation; however, we assumed that when soil N was sufficiently depleted by plant uptake, nodule formation, development or function could be reinstated. Thus, the high N uptake of field bean depleted the N soil content in less time than other legumes, and Rhizobia were able to restart their infection at an early stage and nodule growth and N2 fixation were thus able to start again.
Nitrogen fixation
The two most commonly used methods for estimating N2 fixation across the growing season are 15N-isotope dilution and N difference. Reviewing the literature on BNF determination, Unkovich and Pate (Reference Unkovich and Pate2000) noted that the N difference method is less accurate than the 15N-isotope method. However, according to Herridge et al. (Reference Herridge, Peoples and Robert2008) and Müller and Thorup-Kristensen (Reference Müller and Thorup-Kristensen2002), the two methods deliver the same results when comparing BNF with different treatments. Ashworth et al. (Reference Ashworth, West, Allen, Keyser, Weiss, Tyler, Taylor, Warwick and Beamer2015) concluded that the N-difference method could be used instead of the 15N-isotope method when precise values are not necessary. Therefore, we think that for our research purposes, the N-difference method would be profitably utilised.
Nitrogen fertilisation linearly decreased the amount of N2 fixed by all four grain legumes with a slope ranging from 50 mg N m−2 kg−1 of applied N for field bean to 70 mg N m−2 for the other three crops. Thus, N supply affected N2 fixation of the four legume crops differently, and was more damaging for chickpea, pea and white lupin than for field bean, indicating that field bean rhizobia were the most tolerant to high soil mineral N concentrations. Similarly, Evans et al. (Reference Evans, O'Connor, Tuner, Coventru, Fettell, Mahoney, Armstrong and Walsgott1989), Rennie and Dubetz (Reference Rennie and Dubetz1986) and Turpin et al. (Reference Turpin, Herridge and Robertson2002) found a decrease in N2 fixation due to N fertilisation and the advantage of field bean in N fertilisation reactions. Nitrogen fertilisation also linearly decreased the plant dependence on bacterial N2 fixation but did not completely inhibit it. All four species continued to fix N2 even when the N rate was up to 160 kg ha−1, although with this N supply, N2 fixation accounted for almost two-thirds of total N uptake in field bean, but only for a quarter in chickpea, pea and white lupin. At harvest, soil mineral N concentration was approximately 1.7 mg kg−1 without appreciable differences amongst wheat and legume crops and N rates. This confirms that both legume crops and durum wheat, whether fertilised or not with N, take up practically all the available soil N irrespectively of N fertiliser supply (Jensen, Reference Jensen1987).
Estimates of N2 fixation have usually been based solely on measurements of above-ground plant biomass; thus, both N uptake and N2 fixation have often been underestimated since N in roots and nodules were not taken into account (Salvagiotti et al., Reference Salvagiotti, Cassman, Specht, Walters, Weiss and Dobermann2008; Unkovich and Pate, Reference Unkovich and Pate2000). However, we found that only slightly more than 10% of total N in chickpea, field bean and white lupin, and slightly less than 10% in pea were stored in roots and nodules at maturity, irrespective of N supply. These values are lower than those reported by Unkovich and Pate (Reference Unkovich and Pate2000) for chickpea and white lupin (28–40%), which were measured at mid-flowering stage and therefore without the grain supply to total N content. In all four grain legumes, the amount of N2-fixed was positively related to nodule mass which was inversely related to the levels of the N fertiliser applied. Thus, in all four crops, N2 fixation was reduced by depression of nodulation growth resulting from increasing in N fertilisation. Streeter (Reference Streeter1988) proposed that N2 fixed per unit nodule mass decreases progressively with the increase in medium nitrate concentration. In our research, the amount of N2 fixed per unit of nodule mass was linearly related to the N rate in all four legume crops. However, with an increasing N supply, nodules of field bean and pea appeared to intensify their NFA, whilst those of chickpea and white lupin appeared to reduce their activity. To the best of our knowledge, no research was carried out to compare NFA amongst Rhizobium types, an issue that would explain the differential NFA response to N supply amongst species.
All summarising, we found that N fertilisation reduced N2 fixation of field bean and pea by reducing nodule mass, and reduced N2 fixation of chickpea and white lupin by reducing both dry matter and nitrogen fixation activity of the nodules. These findings were in accordance with Streeter (Reference Streeter1988), who reported that N fertilisation can reduce N2 fixation by (i) inhibiting the infection and depression of nodulation growth, which results in a reduction in nodule mass per plant or (ii) inhibiting the nitrogenase activity per unit mass of nodule, corresponding to the amount of N2-fixed per unit mass of nodules. Rhizobium leguminosarum bv. viciae, used for field bean and pea, seems to be more tolerant to high levels of combined N than M. ciceri and Bradyrhizobium sp. (Lupinus). In addition, each kg of applied N reduced nodule biomass and N2 fixed of pea by 1.3 fold and 1.7 fold, respectively compared to field bean. Accordingly, different Rhizobium strains differ in their ability to induce nodulation and fix nitrogen and crop species differ in their susceptibility to nodulation. Thus, the nitrate inhibition would seem to be primarily host plant dependent as hypothesised by Cheema and Ahmad (Reference Cheema and Ahmad2000) and Ohyama et al. (Reference Ohyama, Fujikake, Yashima, Tanabata, Ishikawa, Sato, Nishiwaki, Ohtake, Sueyoshi, Ishii, Fujimaki and El-Shemy2011).
CONCLUSIONS
We found a negative relationship between N fertilisation rate and nodulation as well as N2 fixation in grain legume crops. However, with N rates lower than 120 kg ha−1 reductions in nodulation and N2 fixation had no effect on above ground growth and grain yield. Above this, N rate biomass production decreased, thus indicating that the high rates of N fertiliser decreased the level of N2 fixed to such an extent that the full N2-fixing potential might not have been achieved. We assumed that when soil mineral N was sufficiently depleted by plant uptake, nodule formation, development or function could be reinstated.
Our findings indicated that the N2-fixing symbiotic relationships between plants and bacteria do not respond to N fertilisation rate in the same manner across species. As Rhizobium strains likely differ in their ability to induce nodulation and fix nitrogen, crop species differed in their nodulation susceptibility to fertilisation. Mineral-N inhibition would thus seem to be primarily host-plant dependent. Further research is needed to determine the best N rate for cereal/legume intercropping and the most suitable phenological phase to perform N fertilisation.